- Page 1 and 2: Spasticity in children and young pe
- Page 3 and 4: Published by the RCOG Press at the
- Page 5 and 6: 1 Guideline summary 1.1 Guideline d
- Page 7 and 8: Principles of care Delivering care
- Page 9 and 10: Orthoses General principles Conside
- Page 11 and 12: Botulinum toxin type A General prin
- Page 13 and 14: Intrathecal baclofen General princi
- Page 15 and 16: Orthopaedic surgery Consider orthop
- Page 17 and 18: Guideline summary Number Recommenda
- Page 19 and 20: Guideline summary Number Recommenda
- Page 21 and 22: Guideline summary Number Recommenda
- Page 23 and 24: Guideline summary Number Recommenda
- Page 25 and 26: Guideline summary Number Recommenda
- Page 27 and 28: Guideline summary Number Recommenda
- Page 29 and 30: Guideline summary Number Recommenda
- Page 31 and 32: Guideline summary Number Recommenda
- Page 33 and 34: Guideline summary 1.6 Key research
- Page 35 and 36: Guideline summary Number Research r
- Page 37 and 38: Guideline summary Number Research r
- Page 39 and 40: 2 Introduction 2.1 Spasticity and c
- Page 41 and 42: Introduction who have a motor impai
- Page 43 and 44: Introduction parents or carers, cle
- Page 45 and 46: Guideline development methodology (
- Page 47 and 48: Guideline development methodology
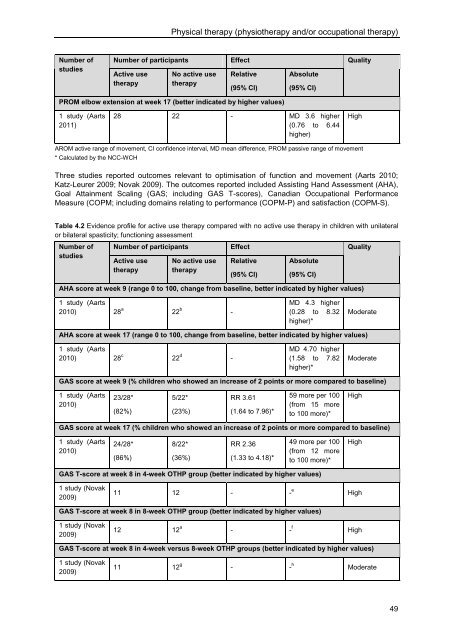
- Page 49 and 50: 4 Physical therapy (physiotherapy a
- Page 51: Physical therapy (physiotherapy and
- Page 55 and 56: Physical therapy (physiotherapy and
- Page 57 and 58: Physical therapy (physiotherapy and
- Page 59 and 60: Physical therapy (physiotherapy and
- Page 61 and 62: Physical therapy (physiotherapy and
- Page 63 and 64: Physical therapy (physiotherapy and
- Page 65 and 66: Physical therapy (physiotherapy and
- Page 67 and 68: Physical therapy (physiotherapy and
- Page 69 and 70: Physical therapy (physiotherapy and
- Page 71 and 72: Physical therapy (physiotherapy and
- Page 73 and 74: Physical therapy (physiotherapy and
- Page 75 and 76: Physical therapy (physiotherapy and
- Page 77 and 78: Physical therapy (physiotherapy and
- Page 79 and 80: Physical therapy (physiotherapy and
- Page 81 and 82: Physical therapy (physiotherapy and
- Page 83 and 84: 5 Orthoses Introduction The term or
- Page 85 and 86: Orthoses One parallel RCT evaluated
- Page 87 and 88: Orthoses k Mean final score ± SD r
- Page 89 and 90: Orthoses CI confidence interval, GM
- Page 91 and 92: Orthoses Table 5.5 Evidence profile
- Page 93 and 94: Orthoses Table 5.6 Evidence profile
- Page 95 and 96: Orthoses g Mean final score ± SD r
- Page 97 and 98: Orthoses Number of studies Number o
- Page 99 and 100: Orthoses Table 5.11 Evidence profil
- Page 101 and 102: Orthoses CI confidence interval, GM
- Page 103 and 104:
Orthoses was statistically signific
- Page 105 and 106:
Orthoses The same cross-over RCT pr
- Page 107 and 108:
Orthoses Elastomere arm splint vers
- Page 109 and 110:
Orthoses the guideline. Also, it di
- Page 111 and 112:
Orthoses spasticity, despite mixed
- Page 113 and 114:
Orthoses Number Recommendation o an
- Page 115 and 116:
6 Oral drugs Introduction Oral drug
- Page 117 and 118:
Oral drugs Table 6.2 Evidence profi
- Page 119 and 120:
Oral drugs Two of the studies repor
- Page 121 and 122:
Oral drugs Two of the studies exami
- Page 123 and 124:
Oral drugs CI confidence interval,
- Page 125 and 126:
Oral drugs b Six of the 16 particip
- Page 127 and 128:
Oral drugs With regard to optimisat
- Page 129 and 130:
Oral drugs increased oral secretion
- Page 131 and 132:
Oral drugs The GDG members consider
- Page 133 and 134:
Oral drugs Number Recommendation 64
- Page 135 and 136:
Botulinum toxin No related NICE gui
- Page 137 and 138:
Botulinum toxin Number of studies N
- Page 139 and 140:
Botulinum toxin Number of studies N
- Page 141 and 142:
Botulinum toxin Number of studies N
- Page 143 and 144:
Botulinum toxin L Mean change from
- Page 145 and 146:
Botulinum toxin Number of studies N
- Page 147 and 148:
Botulinum toxin Number of studies N
- Page 149 and 150:
Botulinum toxin Table 7.6 Evidence
- Page 151 and 152:
Botulinum toxin Excessive weakness
- Page 153 and 154:
Botulinum toxin The study also repo
- Page 155 and 156:
Botulinum toxin * Calculated by the
- Page 157 and 158:
Botulinum toxin and young people wh
- Page 159 and 160:
Botulinum toxin BoNT-A and physical
- Page 161 and 162:
Botulinum toxin treatment of the lo
- Page 163 and 164:
Botulinum toxin Chapter 11). The GD
- Page 165 and 166:
Botulinum toxin reported PEDI score
- Page 167 and 168:
Botulinum toxin drug is injected in
- Page 169 and 170:
Botulinum toxin treatment and, ther
- Page 171 and 172:
Botulinum toxin Aminoglycosides The
- Page 173 and 174:
Botulinum toxin Number Recommendati
- Page 175 and 176:
8 Intrathecal baclofen Introduction
- Page 177 and 178:
Intrathecal baclofen e When receivi
- Page 179 and 180:
Intrathecal baclofen b Mean 0.9 SD
- Page 181 and 182:
Intrathecal baclofen d During the t
- Page 183 and 184:
Intrathecal baclofen Table 8.10 Evi
- Page 185 and 186:
Intrathecal baclofen Number of stud
- Page 187 and 188:
Intrathecal baclofen Number of stud
- Page 189 and 190:
Intrathecal baclofen M Baseline med
- Page 191 and 192:
Intrathecal baclofen Number of stud
- Page 193 and 194:
Intrathecal baclofen Table 8.18 Evi
- Page 195 and 196:
Intrathecal baclofen have CITB repo
- Page 197 and 198:
Intrathecal baclofen series (a foll
- Page 199 and 200:
Intrathecal baclofen months in chil
- Page 201 and 202:
Intrathecal baclofen effectiveness
- Page 203 and 204:
Intrathecal baclofen person and in
- Page 205 and 206:
Intrathecal baclofen reported impro
- Page 207 and 208:
Intrathecal baclofen dangerous to s
- Page 209 and 210:
Intrathecal baclofen Number Recomme
- Page 211 and 212:
Intrathecal baclofen Number Researc
- Page 213 and 214:
Orthopaedic surgery and the natural
- Page 215 and 216:
Orthopaedic surgery Table 9.3 Evide
- Page 217 and 218:
Orthopaedic surgery Number of studi
- Page 219 and 220:
Orthopaedic surgery Number of studi
- Page 221 and 222:
Orthopaedic surgery with no change
- Page 223 and 224:
Orthopaedic surgery Despite the lac
- Page 225 and 226:
Orthopaedic surgery effective commu
- Page 227 and 228:
Orthopaedic surgery or bilateral sp
- Page 229 and 230:
10 Selective dorsal rhizotomy Intro
- Page 231 and 232:
Selective dorsal rhizotomy Three pa
- Page 233 and 234:
Selective dorsal rhizotomy (Steinbo
- Page 235 and 236:
Selective dorsal rhizotomy Number o
- Page 237 and 238:
Selective dorsal rhizotomy Number o
- Page 239 and 240:
Selective dorsal rhizotomy Optimisa
- Page 241 and 242:
Selective dorsal rhizotomy Number o
- Page 243 and 244:
Selective dorsal rhizotomy Motor Fu
- Page 245 and 246:
Selective dorsal rhizotomy Optimisa
- Page 247 and 248:
Selective dorsal rhizotomy Number o
- Page 249 and 250:
Selective dorsal rhizotomy Number o
- Page 251 and 252:
Selective dorsal rhizotomy y Mean c
- Page 253 and 254:
Selective dorsal rhizotomy reported
- Page 255 and 256:
Selective dorsal rhizotomy scores a
- Page 257 and 258:
Selective dorsal rhizotomy determin
- Page 259 and 260:
Selective dorsal rhizotomy Other co
- Page 261 and 262:
Selective dorsal rhizotomy as walki
- Page 263 and 264:
Selective dorsal rhizotomy to be ab
- Page 265 and 266:
Selective dorsal rhizotomy Number R
- Page 267 and 268:
Health economics quantify the benef
- Page 269 and 270:
Health economics 11.3 Orthoses Heal
- Page 271 and 272:
Health economics The assessment inc
- Page 273 and 274:
Health economics If two follow-up a
- Page 275 and 276:
Health economics The proportion of
- Page 277 and 278:
Health economics • ITB testing an
- Page 279 and 280:
Health economics Table 11.11 Costs
- Page 281 and 282:
Health economics testing first usin
- Page 283 and 284:
Health economics 11.6 Orthopaedic s
- Page 285 and 286:
Health economics multidisciplinary
- Page 287 and 288:
Health economics designed to benefi
- Page 289 and 290:
References Denhoff 1975 Denhoff,E.,
- Page 291 and 292:
References Krach 2004 Krach,L.E., K
- Page 293 and 294:
References Rice 2009 Rice,J., Waugh
- Page 295 and 296:
13 Abbreviations and glossary 13.1
- Page 297 and 298:
Abbreviations and glossary PSSRU QA
- Page 299 and 300:
Abbreviations and glossary Focal sp
- Page 301 and 302:
Abbreviations and glossary Passive