Pasco County, FL - Urban Land Institute
Pasco County, FL - Urban Land Institute
Pasco County, FL - Urban Land Institute

Create successful ePaper yourself
Turn your PDF publications into a flip-book with our unique Google optimized e-Paper software.
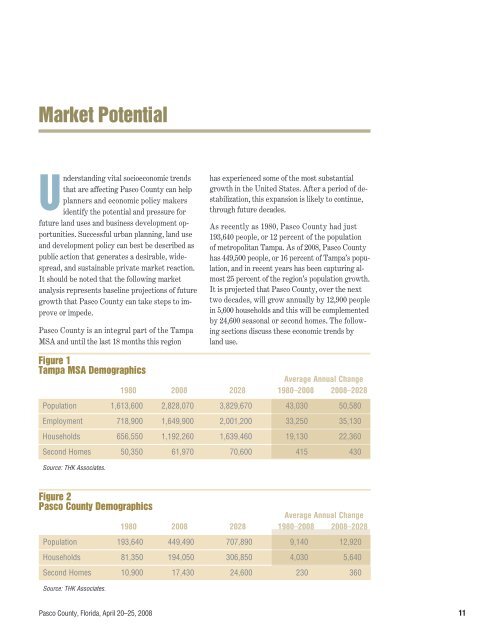
Market Potential<br />
Understanding vital socioeconomic trends<br />
that are affecting <strong>Pasco</strong> <strong>County</strong> can help<br />
planners and economic policy makers<br />
identify the potential and pressure for<br />
future land uses and business development opportunities.<br />
Successful urban planning, land use<br />
and development policy can best be described as<br />
public action that generates a desirable, widespread,<br />
and sustainable private market reaction.<br />
It should be noted that the following market<br />
analysis rep re sents baseline projections of future<br />
growth that <strong>Pasco</strong> <strong>County</strong> can take steps to improve<br />
or impede.<br />
<strong>Pasco</strong> <strong>County</strong> is an integral part of the Tampa<br />
MSA and until the last 18 months this region<br />
has experienced some of the most substantial<br />
growth in the United States. After a period of destabilization,<br />
this expansion is likely to continue,<br />
through future decades.<br />
As recently as 1980, <strong>Pasco</strong> <strong>County</strong> had just<br />
193,640 people, or 12 percent of the population<br />
of metropolitan Tampa. As of 2008, <strong>Pasco</strong> <strong>County</strong><br />
has 449,500 people, or 16 percent of Tampa’s population,<br />
and in recent years has been capturing almost<br />
25 percent of the region’s population growth.<br />
It is projected that <strong>Pasco</strong> <strong>County</strong>, over the next<br />
two decades, will grow annually by 12,900 people<br />
in 5,600 households and this will be complemented<br />
by 24,600 seasonal or second homes. The following<br />
sections discuss these economic trends by<br />
land use.<br />
Figure 1<br />
Tampa MSA Demographics<br />
Average Annual Change<br />
1980 2008 2028 1980–2008 2008–2028<br />
Population 1,613,600 2,828,070 3,829,670 43,030 50,580<br />
Employment 718,900 1,649,900 2,001,200 33,250 35,130<br />
Households 656,550 1,192,260 1,639,460 19,130 22,360<br />
Second Homes 50,350 61,970 70,600 415 430<br />
Source: THK Associates.<br />
Figure 2<br />
<strong>Pasco</strong> <strong>County</strong> Demographics<br />
Average Annual Change<br />
1980 2008 2028 1980–2008 2008–2028<br />
Population 193,640 449,490 707,890 9,140 12,920<br />
Households 81,350 194,050 306,850 4,030 5,640<br />
Second Homes 10,900 17,430 24,600 230 360<br />
Source: THK Associates.<br />
<strong>Pasco</strong> <strong>County</strong>, Florida, April 20–25, 2008 11