Homework 1 (pdf) - Geotechnical Earthquake Engineering
Homework 1 (pdf) - Geotechnical Earthquake Engineering
Homework 1 (pdf) - Geotechnical Earthquake Engineering

You also want an ePaper? Increase the reach of your titles
YUMPU automatically turns print PDFs into web optimized ePapers that Google loves.
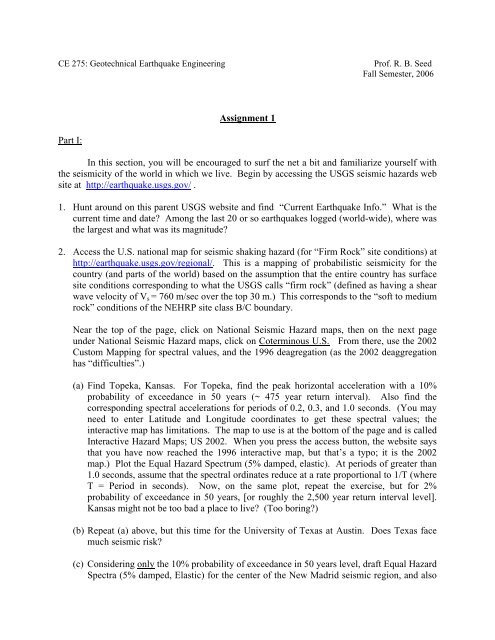
CE 275: <strong>Geotechnical</strong> <strong>Earthquake</strong> <strong>Engineering</strong><br />
Prof. R. B. Seed<br />
Fall Semester, 2006<br />
Assignment 1<br />
Part I:<br />
In this section, you will be encouraged to surf the net a bit and familiarize yourself with<br />
the seismicity of the world in which we live. Begin by accessing the USGS seismic hazards web<br />
site at http://earthquake.usgs.gov/ .<br />
1. Hunt around on this parent USGS website and find “Current <strong>Earthquake</strong> Info.” What is the<br />
current time and date? Among the last 20 or so earthquakes logged (world-wide), where was<br />
the largest and what was its magnitude?<br />
2. Access the U.S. national map for seismic shaking hazard (for “Firm Rock” site conditions) at<br />
http://earthquake.usgs.gov/regional/. This is a mapping of probabilistic seismicity for the<br />
country (and parts of the world) based on the assumption that the entire country has surface<br />
site conditions corresponding to what the USGS calls “firm rock” (defined as having a shear<br />
wave velocity of V s = 760 m/sec over the top 30 m.) This corresponds to the “soft to medium<br />
rock” conditions of the NEHRP site class B/C boundary.<br />
Near the top of the page, click on National Seismic Hazard maps, then on the next page<br />
under National Seismic Hazard maps, click on Coterminous U.S. From there, use the 2002<br />
Custom Mapping for spectral values, and the 1996 deagregation (as the 2002 deaggregation<br />
has “difficulties”.)<br />
(a) Find Topeka, Kansas. For Topeka, find the peak horizontal acceleration with a 10%<br />
probability of exceedance in 50 years (~ 475 year return interval). Also find the<br />
corresponding spectral accelerations for periods of 0.2, 0.3, and 1.0 seconds. (You may<br />
need to enter Latitude and Longitude coordinates to get these spectral values; the<br />
interactive map has limitations. The map to use is at the bottom of the page and is called<br />
Interactive Hazard Maps; US 2002. When you press the access button, the website says<br />
that you have now reached the 1996 interactive map, but that’s a typo; it is the 2002<br />
map.) Plot the Equal Hazard Spectrum (5% damped, elastic). At periods of greater than<br />
1.0 seconds, assume that the spectral ordinates reduce at a rate proportional to 1/T (where<br />
T = Period in seconds). Now, on the same plot, repeat the exercise, but for 2%<br />
probability of exceedance in 50 years, [or roughly the 2,500 year return interval level].<br />
Kansas might not be too bad a place to live? (Too boring?)<br />
(b) Repeat (a) above, but this time for the University of Texas at Austin. Does Texas face<br />
much seismic risk?<br />
(c) Considering only the 10% probability of exceedance in 50 years level, draft Equal Hazard<br />
Spectra (5% damped, Elastic) for the center of the New Madrid seismic region, and also
for the city of Charleston (in the Charleston seismic region). These are the two principal<br />
“eastern U.S.” seismic zones. Plot both spectra on the same plot.<br />
(d) Now consider Charleston a bit more closely. Plot approximate Equal Hazard Spectra for<br />
Charleston for both the 10% probability of exceedance in 50 years (~475 year return<br />
interval) level, and the 2% probability of exceedance in 50 years (~2,500 year return<br />
interval) level [Plot these both on the same figure.] Using the 1996 “deaggregation”<br />
option, deaggregate these spectra by Magnitude (M) and Distance (R). Note that the<br />
deaggregation will be different at shorter and longer periods, so you will want to<br />
deaggregate for PGA and for the various spectral ordinates separately.<br />
• Using your Equal Hazard Spectrum for 10% in 50 years, and the<br />
deaggregation, recommend the approximate initial characteristics (a max , M w<br />
and R) for a “design basis” earthquake for use in design of an 2 to 3-story<br />
apartment complex and shopping center in Charleston.<br />
• Using your Equal Hazard Spectrum for 2% in 50 years, and the deaggregation,<br />
recommend the approximate initial characteristics characteristics (a max, M w<br />
and R) for a “design basis” earthquake for use in design of a major earth dam<br />
(with a crest height of approximately 350 feet, and a predominant period of<br />
about 0.8 seconds) near Charleston.<br />
Part II:<br />
3. Find the location where you live (while attending U. C. Berkeley.) Again, find the PGA, and<br />
the S A values for T = 0.2, 0.3 0.5 and 1.0 seconds, and plot the Equal Hazard Spectrum (5%<br />
damped, elastic) for a probability of exceedance of 10% in 50 years (the presumed UBC<br />
building code level.) On the same figure, plot the actual response spectrum from the current<br />
UBC for Site Class C conditions. (Don’t forget to apply the near field factors if appropriate.)<br />
Does this worry you? Remember, if your building is more then about ten years old, it was<br />
probably designed for even lesser levels of shaking.<br />
Part III:<br />
Now, on your own volition, and despite a rigorous schedule of competing priorities and<br />
conflicting assignments from other courses, access another web site (still under construction)<br />
sponsored by CDMG at http://www.consrv.ca.gov/cgs/, and explore a bit. This site is dedicated<br />
more locally to California, and presents similar information to that presented by the USGS site,<br />
but it is not yet as well along.<br />
4. Repeat the First part of Question #3 above. Is the strong shaking hazard mapping of this site<br />
the same (same basis, and same values) as the USGS site? (Don’t spend a long time on this<br />
one….just make a few quick checks.)