

full_annual_report_2014
full_annual_report_2014
full_annual_report_2014

You also want an ePaper? Increase the reach of your titles
YUMPU automatically turns print PDFs into web optimized ePapers that Google loves.
Overview<br />
Strategy<br />
review Performance Governance Financials<br />
Additional<br />
information<br />
151<br />
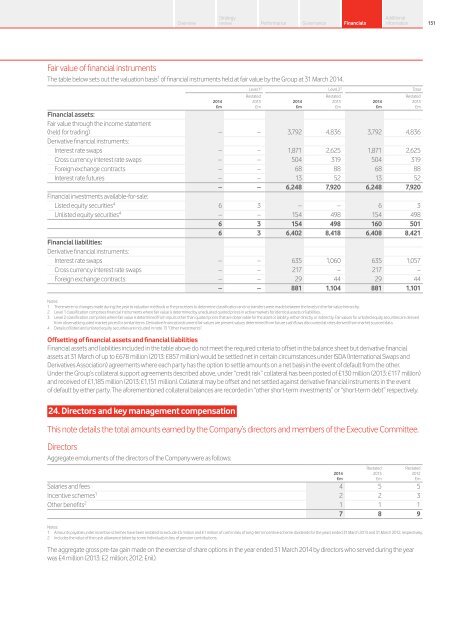
Fair value of financial instruments<br />
The table below sets out the valuation basis 1 of financial instruments held at fair value by the Group at 31 March <strong>2014</strong>.<br />
Level 1 2 Level 2 3 Total<br />
Restated<br />
Restated<br />
Restated<br />
<strong>2014</strong><br />
2013 <strong>2014</strong><br />
2013 <strong>2014</strong><br />
2013<br />
£m £m £m £m £m £m<br />
Financial assets:<br />
Fair value through the income statement<br />
(held for trading) – – 3,792 4,836 3,792 4,836<br />
Derivative financial instruments:<br />
Interest rate swaps – – 1,871 2,625 1,871 2,625<br />
Cross currency interest rate swaps – – 504 319 504 319<br />
Foreign exchange contracts – – 68 88 68 88<br />
Interest rate futures – – 13 52 13 52<br />
– – 6,248 7,920 6,248 7,920<br />
Financial investments available-for-sale:<br />
Listed equity securities 4 6 3 – – 6 3<br />
Unlisted equity securities 4 – – 154 498 154 498<br />
6 3 154 498 160 501<br />
6 3 6,402 8,418 6,408 8,421<br />
Financial liabilities:<br />
Derivative financial instruments:<br />
Interest rate swaps – – 635 1,060 635 1,057<br />
Cross currency interest rate swaps – – 217 – 217 –<br />
Foreign exchange contracts – – 29 44 29 44<br />
– – 881 1,104 881 1,101<br />
Notes:<br />
1 There were no changes made during the year to valuation methods or the processes to determine classification and no transfers were made between the levels in the fair value hierarchy.<br />
2 Level 1 classification comprises financial instruments where fair value is determined by unadjusted quoted prices in active markets for identical assets or liabilities.<br />
3 Level 2 classification comprises where fair value is determined from inputs other than quoted prices that are observable for the asset or liability, either directly or indirectly. Fair values for unlisted equity securities are derived<br />
from observable quoted market prices for similar items. Derivative financial instrument fair values are present values determined from future cash flows discounted at rates derived from market sourced data.<br />
4 Details of listed and unlisted equity securities are included in note 13 “Other Investments”.<br />
Offsetting of financial assets and financial liabilities<br />
Financial assets and liabilities included in the table above do not meet the required criteria to offset in the balance sheet but derivative financial<br />
assets at 31 March of up to £678 million (2013: £857 million) would be settled net in certain circumstances under ISDA (International Swaps and<br />
Derivatives Association) agreements where each party has the option to settle amounts on a net basis in the event of default from the other.<br />
Under the Group’s collateral support agreements described above, under “credit risk” collateral has been posted of £130 million (2013: £117 million)<br />
and received of £1,185 million (2013: £1,151 million). Collateral may be offset and net settled against derivative financial instruments in the event<br />
of default by either party. The aforementioned collateral balances are recorded in “other short-term investments” or “short-term debt” respectively.<br />
24. Directors and key management compensation<br />
This note details the total amounts earned by the Company’s directors and members of the Executive Committee.<br />
Directors<br />
Aggregate emoluments of the directors of the Company were as follows:<br />
£m £m £m<br />
Salaries and fees 4 5 5<br />
Incentive schemes 1 2 2 3<br />
Other benefits 2 1 1 1<br />
7 8 9<br />
Notes:<br />
1 Amounts payable under incentive schemes have been restated to exclude £5 million and £1 million of cash in lieu of long-term incentive scheme dividends for the years ended 31 March 2013 and 31 March 2012, respectively.<br />
2 Includes the value of the cash allowance taken by some individuals in lieu of pension contributions.<br />
The aggregate gross pre-tax gain made on the exercise of share options in the year ended 31 March <strong>2014</strong> by directors who served during the year<br />
was £4 million (2013: £2 million; 2012: £nil).<br />
<strong>2014</strong><br />
Restated<br />
2013<br />
Restated<br />
2012