full_annual_report_2014
full_annual_report_2014
full_annual_report_2014
Create successful ePaper yourself
Turn your PDF publications into a flip-book with our unique Google optimized e-Paper software.
158<br />
Vodafone Group Plc<br />
Annual Report <strong>2014</strong><br />
Notes to the consolidated financial statements (continued)<br />
27. Share-based payments (continued)<br />
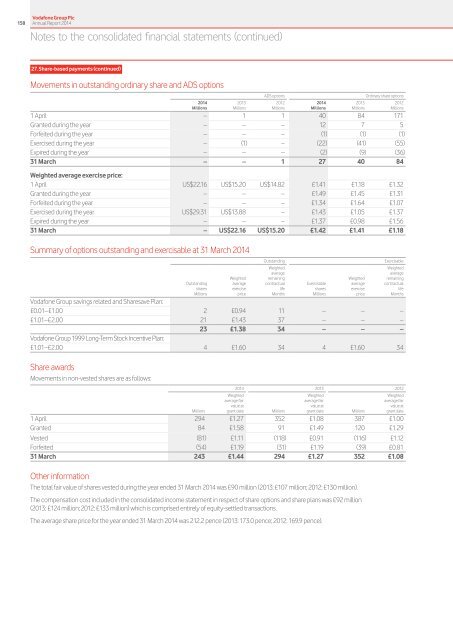
Movements in outstanding ordinary share and ADS options<br />
ADS options<br />
Ordinary share options<br />
<strong>2014</strong> 2013 2012 <strong>2014</strong> 2013 2012<br />
Millions Millions Millions Millions Millions Millions<br />
1 April – 1 1 40 84 171<br />
Granted during the year – – – 12 7 5<br />
Forfeited during the year – – – (1) (1) (1)<br />
Exercised during the year – (1) – (22) (41) (55)<br />
Expired during the year – – – (2) (9) (36)<br />
31 March – – 1 27 40 84<br />
Weighted average exercise price:<br />
1 April US$22.16 US$15.20 US$14.82 £1.41 £1.18 £1.32<br />
Granted during the year – – – £1.49 £1.45 £1.31<br />
Forfeited during the year – – – £1.34 £1.64 £1.07<br />
Exercised during the year US$29.31 US$13.88 – £1.43 £1.05 £1.37<br />
Expired during the year – – – £1.37 £0.98 £1.56<br />
31 March – US$22.16 US$15.20 £1.42 £1.41 £1.18<br />
Summary of options outstanding and exercisable at 31 March <strong>2014</strong><br />
Outstanding<br />
Exercisable<br />
Weighted<br />
Weighted<br />
average<br />
average<br />
Weighted remaining Weighted remaining<br />
Outstanding average contractual Exercisable average contractual<br />
shares exercise life shares exercise life<br />
Millions price Months Millions price Months<br />
Vodafone Group savings related and Sharesave Plan:<br />
£0.01–£1.00 2 £0.94 11 – – –<br />
£1.01–£2.00 21 £1.43 37 – – –<br />
23 £1.38 34 – – –<br />
Vodafone Group 1999 Long-Term Stock Incentive Plan:<br />
£1.01–£2.00 4 £1.60 34 4 £1.60 34<br />
Share awards<br />
Movements in non-vested shares are as follows:<br />
<strong>2014</strong> 2013 2012<br />
Weighted Weighted Weighted<br />
average fair average fair average fair<br />
value at value at value at<br />
Millions grant date Millions grant date Millions grant date<br />
1 April 294 £1.27 352 £1.08 387 £1.00<br />
Granted 84 £1.58 91 £1.49 120 £1.29<br />
Vested (81) £1.11 (118) £0.91 (116) £1.12<br />
Forfeited (54) £1.19 (31) £1.19 (39) £0.81<br />
31 March 243 £1.44 294 £1.27 352 £1.08<br />
Other information<br />
The total fair value of shares vested during the year ended 31 March <strong>2014</strong> was £90 million (2013: £107 million; 2012: £130 million).<br />
The compensation cost included in the consolidated income statement in respect of share options and share plans was £92 million<br />
(2013: £124 million; 2012: £133 million) which is comprised entirely of equity-settled transactions.<br />
The average share price for the year ended 31 March <strong>2014</strong> was 212.2 pence (2013: 173.0 pence; 2012: 169.9 pence).


