%Unit: Perimeter & Area% %Grade level: 10- Geometry% %Time ...
%Unit: Perimeter & Area% %Grade level: 10- Geometry% %Time ...
%Unit: Perimeter & Area% %Grade level: 10- Geometry% %Time ...
SHOW LESS

Create successful ePaper yourself
Turn your PDF publications into a flip-book with our unique Google optimized e-Paper software.
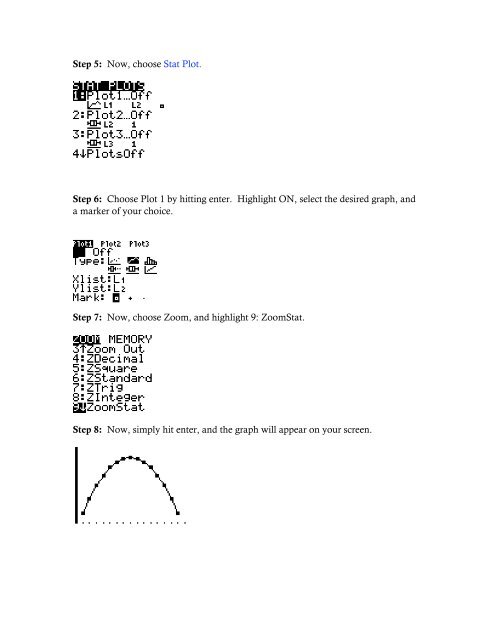
Step 5: Now, choose Stat Plot.<br />
Step 6: Choose Plot 1 by hitting enter. Highlight ON, select the desired graph, and<br />
a marker of your choice.<br />
Step 7: Now, choose Zoom, and highlight 9: ZoomStat.<br />
Step 8: Now, simply hit enter, and the graph will appear on your screen.