%Unit: Perimeter & Area% %Grade level: 10- Geometry% %Time ...
%Unit: Perimeter & Area% %Grade level: 10- Geometry% %Time ...
%Unit: Perimeter & Area% %Grade level: 10- Geometry% %Time ...

Create successful ePaper yourself
Turn your PDF publications into a flip-book with our unique Google optimized e-Paper software.
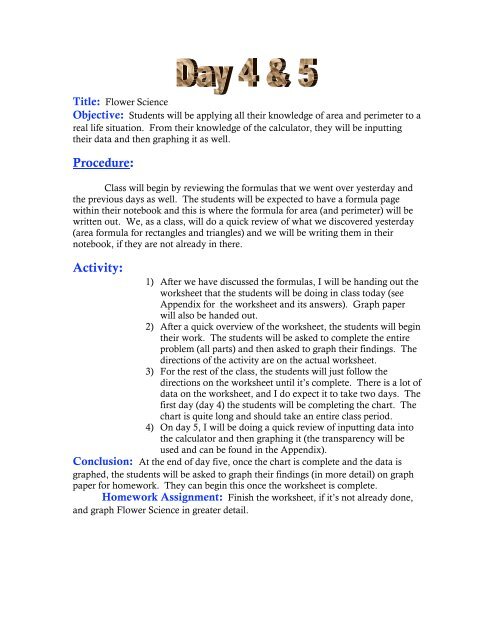
Title: Flower Science<br />
Objective: Students will be applying all their knowledge of area and perimeter to a<br />
real life situation. From their knowledge of the calculator, they will be inputting<br />
their data and then graphing it as well.<br />
Procedure:<br />
Class will begin by reviewing the formulas that we went over yesterday and<br />
the previous days as well. The students will be expected to have a formula page<br />
within their notebook and this is where the formula for area (and perimeter) will be<br />
written out. We, as a class, will do a quick review of what we discovered yesterday<br />
(area formula for rectangles and triangles) and we will be writing them in their<br />
notebook, if they are not already in there.<br />
Activity:<br />
1) After we have discussed the formulas, I will be handing out the<br />
worksheet that the students will be doing in class today (see<br />
Appendix for the worksheet and its answers). Graph paper<br />
will also be handed out.<br />
2) After a quick overview of the worksheet, the students will begin<br />
their work. The students will be asked to complete the entire<br />
problem (all parts) and then asked to graph their findings. The<br />
directions of the activity are on the actual worksheet.<br />
3) For the rest of the class, the students will just follow the<br />
directions on the worksheet until it’s complete. There is a lot of<br />
data on the worksheet, and I do expect it to take two days. The<br />
first day (day 4) the students will be completing the chart. The<br />
chart is quite long and should take an entire class period.<br />
4) On day 5, I will be doing a quick review of inputting data into<br />
the calculator and then graphing it (the transparency will be<br />
used and can be found in the Appendix).<br />
Conclusion: At the end of day five, once the chart is complete and the data is<br />
graphed, the students will be asked to graph their findings (in more detail) on graph<br />
paper for homework. They can begin this once the worksheet is complete.<br />
Homework Assignment: Finish the worksheet, if it’s not already done,<br />
and graph Flower Science in greater detail.