Safety of Anaesthesia in Australia - Australian and New Zealand ...
Safety of Anaesthesia in Australia - Australian and New Zealand ...
Safety of Anaesthesia in Australia - Australian and New Zealand ...

You also want an ePaper? Increase the reach of your titles
YUMPU automatically turns print PDFs into web optimized ePapers that Google loves.
F<strong>in</strong>d<strong>in</strong>gs for Nsw, Vic <strong>and</strong> Wa cont<strong>in</strong>ued<br />
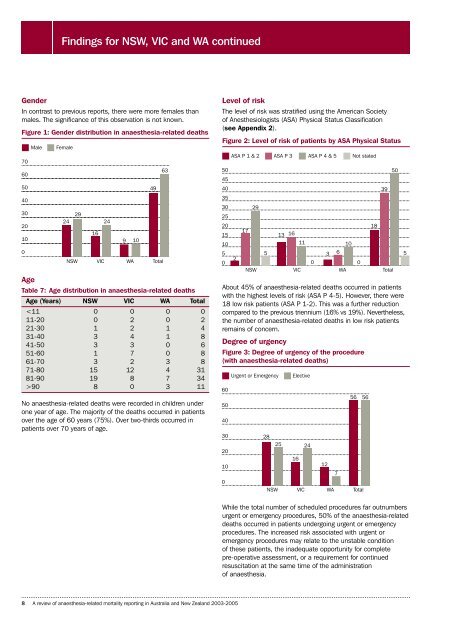
Gender<br />
In contrast to previous reports, there were more females than<br />
males. The significance <strong>of</strong> this observation is not known.<br />
Figure 1: Gender distribution <strong>in</strong> anaesthesia-related deaths<br />
70<br />
60<br />
50<br />
40<br />
30<br />
20<br />
10<br />
0<br />
Male<br />
Female<br />
63 50<br />
45<br />
49<br />
40<br />
35<br />
30<br />
29<br />
25<br />
24<br />
24<br />
20<br />
16<br />
15<br />
9 10<br />
10<br />
5<br />
NSW VIC WA Total<br />
0<br />
Age<br />
Table 7: Age distribution <strong>in</strong> anaesthesia-related deaths<br />
Age (Years) NSW VIC WA Total<br />
90 8 0 3 11<br />
No anaesthesia-related deaths were recorded <strong>in</strong> children under<br />
one year <strong>of</strong> age. The majority <strong>of</strong> the deaths occurred <strong>in</strong> patients<br />
over the age <strong>of</strong> 60 years (75%). Over two-thirds occurred <strong>in</strong><br />
patients over 70 years <strong>of</strong> age.<br />
Level <strong>of</strong> risk<br />
The level <strong>of</strong> risk was stratified us<strong>in</strong>g the American Society<br />
<strong>of</strong> Anesthesiologists (ASA) Physical Status Classification<br />
(see Appendix 2).<br />
Figure 2: Level <strong>of</strong> risk <strong>of</strong> patients by ASA Physical Status<br />
About 45% <strong>of</strong> anaesthesia-related deaths occurred <strong>in</strong> patients<br />
with the highest levels <strong>of</strong> risk (ASA P 4-5). However, there were<br />
18 low risk patients (ASA P 1-2). This was a further reduction<br />
compared to the previous triennium (16% vs 19%). Nevertheless,<br />
the number <strong>of</strong> anaesthesia-related deaths <strong>in</strong> low risk patients<br />
rema<strong>in</strong>s <strong>of</strong> concern.<br />
Degree <strong>of</strong> urgency<br />
Figure 3: Degree <strong>of</strong> urgency <strong>of</strong> the procedure<br />
(with anaesthesia-related deaths)<br />
60<br />
50<br />
40<br />
30<br />
20<br />
10<br />
0<br />
ASA P 1 & 2 ASA P 3 ASA P 4 & 5 Not stated<br />
2<br />
17<br />
29<br />
5<br />
13 16 11<br />
3 6<br />
0 0<br />
NSW VIC WA Total<br />
Urgent or Emergency<br />
28<br />
25<br />
Elective<br />
16<br />
24<br />
12<br />
10<br />
NSW VIC WA Total<br />
7<br />
56 56<br />
18<br />
39<br />
50<br />
5<br />
While the total number <strong>of</strong> scheduled procedures far outnumbers<br />
urgent or emergency procedures, 50% <strong>of</strong> the anaesthesia-related<br />
deaths occurred <strong>in</strong> patients undergo<strong>in</strong>g urgent or emergency<br />
procedures. The <strong>in</strong>creased risk associated with urgent or<br />
emergency procedures may relate to the unstable condition<br />
<strong>of</strong> these patients, the <strong>in</strong>adequate opportunity for complete<br />
pre-operative assessment, or a requirement for cont<strong>in</strong>ued<br />
resuscitation at the same time <strong>of</strong> the adm<strong>in</strong>istration<br />
<strong>of</strong> anaesthesia.<br />
8 A review <strong>of</strong> anaesthesia-related mortality report<strong>in</strong>g <strong>in</strong> <strong>Australia</strong> <strong>and</strong> <strong>New</strong> Zeal<strong>and</strong> 2003-2005