STOCK TO STUDY: T. Rowe Price Group, Inc ... - BetterInvesting
STOCK TO STUDY: T. Rowe Price Group, Inc ... - BetterInvesting
STOCK TO STUDY: T. Rowe Price Group, Inc ... - BetterInvesting

Create successful ePaper yourself
Turn your PDF publications into a flip-book with our unique Google optimized e-Paper software.
The basic question everyone facing retirement asks is: How<br />
much can I withdraw safely and not run out of money before I<br />
die? Of course, this question would be a lot easier to answer if<br />
we knew how long we were going to live and how much our living<br />
costs would be.<br />
Thirty years ago, when retirement planning was in<br />
its infancy, financial planners would just assume<br />
that your assets would grow at 8 percent indef -<br />
initely and that if you were withdrawing 5 percent, you’d<br />
be OK. But as we’ve seen over the years, most dramatically<br />
in the 2008 to 2009 market, making projections like this<br />
is unrealistic. What if you had retired in fall 2008 relying on<br />
these simplistic projections? You’d have had a rude awakening<br />
as your principal declined.<br />
Various approaches have been developed to better<br />
simulate real life. The most common approach used today<br />
is one using a fixed rate of return, a constant level of ex -<br />
penses only changing with inflation and a constant inflation<br />
rate. This is often referred to as “deterministic” and<br />
doesn’t take any changes into account for the variables of<br />
returns, expenses and inflation.<br />
This more simple projection doesn’t address the pos -<br />
sible varia bility in any of the assumptions. Also, be aware<br />
that the longer-term financial projections are the more<br />
likely errors will be present. This is why financial plans<br />
need to be updated regularly.<br />
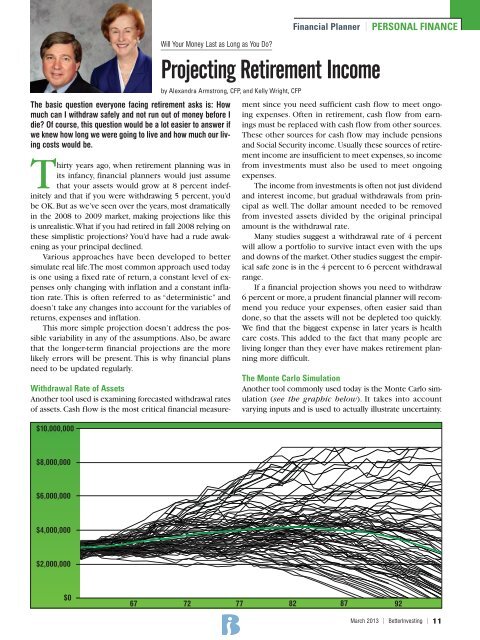
$10,000,000<br />
Financial Planner | PERSONAL FINANCE<br />
Will Your Money Last as Long as You Do?<br />
Projecting Retirement <strong>Inc</strong>ome<br />
by Alexandra Armstrong, CFP, and Kelly Wright, CFP<br />
Withdrawal Rate of Assets<br />
Another tool used is examining forecasted withdrawal rates<br />
of assets. Cash flow is the most critical financial measurement<br />
since you need sufficient cash flow to meet ongoing<br />
expenses. Often in retirement, cash flow from earnings<br />
must be replaced with cash flow from other sources.<br />
These other sources for cash flow may include pensions<br />
and Social Security income. Usually these sources of re tire -<br />
ment income are insufficient to meet expenses, so in come<br />
from investments must also be used to meet ongoing<br />
expenses.<br />
The income from investments is often not just dividend<br />
and interest income, but gradual withdrawals from prin -<br />
cipal as well. The dollar amount needed to be re moved<br />
from invested assets divided by the original principal<br />
amount is the withdrawal rate.<br />
Many studies suggest a withdrawal rate of 4 percent<br />
will allow a portfolio to survive intact even with the ups<br />
and downs of the market. Other studies suggest the em pir -<br />
ical safe zone is in the 4 percent to 6 percent withdrawal<br />
range.<br />
If a financial projection shows you need to withdraw<br />
6 percent or more, a prudent financial planner will rec om -<br />
mend you reduce your expenses, often easier said than<br />
done, so that the assets will not be depleted too quickly.<br />
We find that the biggest expense in later years is health<br />
care costs. This added to the fact that many people are<br />
living longer than they ever have makes retirement planning<br />
more difficult.<br />
The Monte Carlo Simulation<br />
Another tool commonly used today is the Monte Carlo sim -<br />
u lation (see the graphic below). It takes into account<br />
varying inputs and is used to actually illustrate uncertainty.<br />
$8,000,000<br />
$6,000,000<br />
$4,000,000<br />
$2,000,000<br />
$0<br />
67 72 77 82 87 92<br />
March 2013 | <strong>BetterInvesting</strong> | 11