STOCK TO STUDY: T. Rowe Price Group, Inc ... - BetterInvesting
STOCK TO STUDY: T. Rowe Price Group, Inc ... - BetterInvesting
STOCK TO STUDY: T. Rowe Price Group, Inc ... - BetterInvesting

Create successful ePaper yourself
Turn your PDF publications into a flip-book with our unique Google optimized e-Paper software.
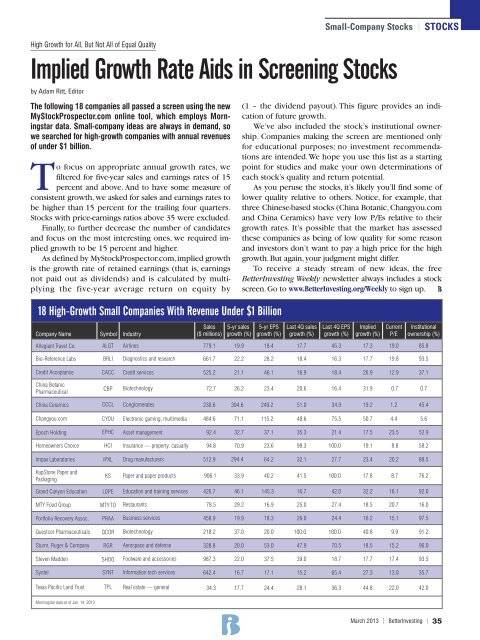
The following 18 companies all passed a screen using the new<br />
MyStockProspector.com online tool, which employs Morn -<br />
ingstar data. Small-company ideas are always in demand, so<br />
we searched for high-growth companies with annual revenues<br />
of under $1 billion.<br />
To focus on appropriate annual growth rates, we<br />
filtered for five-year sales and earnings rates of 15<br />
percent and above. And to have some measure of<br />
consistent growth, we asked for sales and earnings rates to<br />
be higher than 15 percent for the trailing four quarters.<br />
Stocks with price-earnings ratios above 35 were excluded.<br />
Finally, to further decrease the number of candidates<br />
and focus on the most interesting ones, we required im -<br />
plied growth to be 15 percent and higher.<br />
As defined by MyStockPros pector.com, implied growth<br />
is the growth rate of retained earnings (that is, earnings<br />
not paid out as dividends) and is calculated by mul ti -<br />
plying the five-year average return on equity by<br />
Small-Company Stocks | <strong>S<strong>TO</strong>CK</strong>S<br />
High Growth for All, But Not All of Equal Quality<br />
Implied Growth Rate Aids in Screening Stocks<br />
by Adam Ritt, Editor<br />
18 High-Growth Small Companies With Revenue Under $1 Billion<br />
(1 – the dividend payout). This figure provides an indi -<br />
cation of future growth.<br />
We’ve also included the stock’s institutional ownership.<br />
Companies making the screen are mentioned only<br />
for educational purposes; no investment recommendations<br />
are intended. We hope you use this list as a starting<br />
point for studies and make your own determinations of<br />
each stock’s quality and return potential.<br />
As you peruse the stocks, it’s likely you’ll find some of<br />
lower quality relative to others. Notice, for example, that<br />
three Chinese-based stocks (China Botanic, Changyou.com<br />
and China Ceramics) have very low P/Es relative to their<br />
growth rates. It’s possible that the market has assessed<br />
these com panies as being of low quality for some reason<br />
and investors don’t want to pay a high price for the high<br />
growth. But again, your judgment might differ.<br />
To receive a steady stream of new ideas, the free<br />
<strong>BetterInvesting</strong> Weekly newsletter always includes a stock<br />
screen. Go to www.<strong>BetterInvesting</strong>.org/Weekly to sign up.<br />
Company Name<br />
Symbol<br />
Industry<br />
Sales<br />
($ millions)<br />
5-yr sales<br />
growth (%)<br />
5-yr EPS<br />
growth (%)<br />
Last 4Q sales<br />
growth (%)<br />
Last 4Q EPS<br />
growth (%)<br />
Implied<br />
growth (%)<br />
Current<br />
P/E<br />
Institutional<br />
ownership (%)<br />
Allegiant Travel Co. ALGT Airlines 779.1<br />
19.9<br />
18.4<br />
17.7<br />
45.3<br />
17.3<br />
19.0<br />
85.8<br />
Bio-Reference Labs<br />
BRLI<br />
Diagnostics and research<br />
661.7<br />
22.2<br />
28.2<br />
18.4<br />
16.3<br />
17.7<br />
19.8<br />
93.5<br />
Credit Acceptance<br />
CACC<br />
Credit services<br />
525.2<br />
21.1<br />
46.1<br />
16.9<br />
18.4<br />
26.9<br />
12.9<br />
37.1<br />
China Botanic<br />
Pharmaceutical<br />
CBP<br />
Biotechnology<br />
72.7<br />
26.2<br />
23.4<br />
20.6<br />
16.4<br />
31.9<br />
0.7<br />
0.7<br />
China Ceramics<br />
CCCL<br />
Conglomerates<br />
230.6<br />
394.6<br />
249.2<br />
51.0<br />
34.9<br />
19.2<br />
1.2<br />
45.4<br />
Changyou.com<br />
CYOU<br />
Electronic gaming, multimedia<br />
484.6<br />
71.1<br />
115.2<br />
48.6<br />
75.5<br />
50.7<br />
4.4<br />
5.6<br />
Epoch Holding<br />
EPHC<br />
Asset management<br />
92.4<br />
32.7<br />
37.1<br />
35.3<br />
21.4<br />
17.5<br />
23.5<br />
52.9<br />
Homeowners Choice<br />
HCI<br />
Insurance — property, casualty<br />
94.8<br />
70.9<br />
23.6<br />
98.3<br />
100.0<br />
19.1<br />
8.8<br />
58.2<br />
Impax Laboratories<br />
IPXL<br />
Drug manufacturers<br />
512.9<br />
294.4<br />
64.2<br />
32.1<br />
27.7<br />
23.4<br />
20.2<br />
88.5<br />
KapStone Paper and<br />
Packaging<br />
KS<br />
Paper and paper products<br />
906.1<br />
33.9<br />
40.2<br />
41.5<br />
100.0<br />
17.8<br />
8.7<br />
76.2<br />
Grand Canyon Education<br />
LOPE<br />
Education and training services<br />
426.7<br />
46.1<br />
145.3<br />
16.7<br />
42.0<br />
32.2<br />
16.1<br />
92.0<br />
MTY Food <strong>Group</strong><br />
MTY.<strong>TO</strong><br />
Restaurants<br />
78.5<br />
29.2<br />
16.9<br />
25.0<br />
27.4<br />
18.5<br />
20.7<br />
16.0<br />
Portfolio Recovery Assoc.<br />
PRAA<br />
Business services<br />
458.9<br />
19.9<br />
18.3<br />
26.0<br />
24.4<br />
16.2<br />
15.1<br />
97.5<br />
Questcor Pharmaceuticals<br />
QCOR<br />
Biotechnology<br />
218.2<br />
37.0<br />
20.0<br />
100.0<br />
100.0<br />
40.8<br />
9.9<br />
91.2<br />
Sturm, Ruger & Company<br />
RGR<br />
Aerospace and defense<br />
328.8<br />
20.0<br />
53.0<br />
47.9<br />
70.5<br />
18.5<br />
15.2<br />
96.0<br />
Steven Madden<br />
SHOO<br />
Footware and accessories<br />
987.3<br />
22.0<br />
37.5<br />
39.0<br />
18.7<br />
17.7<br />
17.4<br />
93.5<br />
Syntel<br />
SYNT<br />
Information tech services<br />
642.4<br />
16.7<br />
17.1<br />
15.2<br />
65.4<br />
27.3<br />
13.0<br />
35.7<br />
Texas Pacific Land Trust<br />
TPL<br />
Real estate — general<br />
34.3<br />
17.7<br />
24.4<br />
28.1<br />
36.3<br />
44.8<br />
22.0<br />
42.0<br />
Morningstar data as of Jan. 14, 2013<br />
March 2013 | <strong>BetterInvesting</strong> | 35