STOCK TO STUDY: T. Rowe Price Group, Inc ... - BetterInvesting
STOCK TO STUDY: T. Rowe Price Group, Inc ... - BetterInvesting
STOCK TO STUDY: T. Rowe Price Group, Inc ... - BetterInvesting

You also want an ePaper? Increase the reach of your titles
YUMPU automatically turns print PDFs into web optimized ePapers that Google loves.
<strong>S<strong>TO</strong>CK</strong>S | Growth Stocks<br />
Colgate Is Slowing But Won’t Get the Brushoff<br />
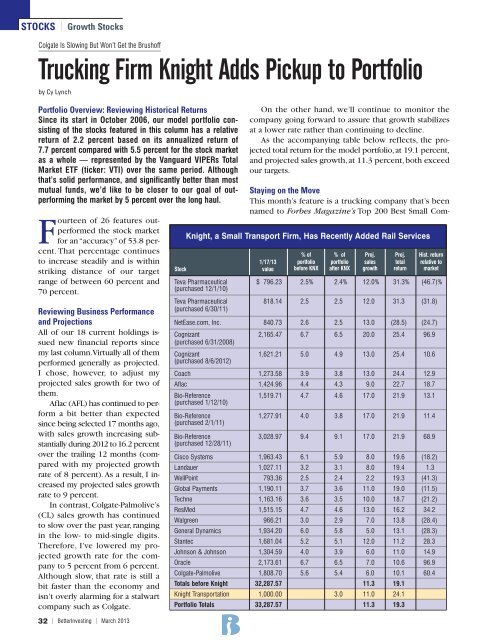
Trucking Firm Knight Adds Pickup to Portfolio<br />
by Cy Lynch<br />
Portfolio Overview: Reviewing Historical Returns<br />
Since its start in October 2006, our model portfolio con -<br />
sisting of the stocks featured in this column has a rel ative<br />
return of 2.2 percent based on its annualized return of<br />
7.7 percent compared with 5.5 percent for the stock market<br />
as a whole — represented by the Vanguard VIPERs Total<br />
Market ETF (ticker: VTI) over the same period. Although<br />
that’s solid performance, and significantly better than most<br />
mutual funds, we’d like to be closer to our goal of out -<br />
performing the market by 5 percent over the long haul.<br />
Fourteen of 26 features outperformed<br />
the stock market<br />
for an “accuracy” of 53.8 percent.<br />
That percentage continues<br />
to increase steadily and is within<br />
striking distance of our target<br />
range of between 60 percent and<br />
70 percent.<br />
Reviewing Business Performance<br />
and Projections<br />
All of our 18 current holdings is -<br />
sued new financial reports since<br />
my last column. Virtually all of them<br />
performed generally as projected.<br />
I chose, however, to adjust my<br />
projected sales growth for two of<br />
them.<br />
Aflac (AFL) has continued to per -<br />
form a bit better than expected<br />
since being selected 17 months ago,<br />
with sales growth increasing sub -<br />
stantially during 2012 to 16.2 percent<br />
over the trailing 12 months (compared<br />
with my projected growth<br />
rate of 8 percent). As a result, I in -<br />
creased my projected sales growth<br />
rate to 9 percent.<br />
In contrast, Colgate-Palmolive’s<br />
(CL) sales growth has continued<br />
to slow over the past year, ranging<br />
in the low- to mid-single digits.<br />
There fore, I’ve lowered my projected<br />
growth rate for the com -<br />
pany to 5 percent from 6 percent.<br />
Although slow, that rate is still a<br />
bit faster than the economy and<br />
isn’t overly alarming for a stalwart<br />
company such as Colgate.<br />
32 | <strong>BetterInvesting</strong> | March 2013<br />
Teva Pharmaceutical<br />
(purchased 12/1/10)<br />
Teva Pharmaceutical<br />
(purchased 6/30/11)<br />
On the other hand, we’ll con tinue to monitor the<br />
company going forward to assure that growth stabilizes<br />
at a lower rate rather than continuing to decline.<br />
As the accompanying table below reflects, the projected<br />
total return for the model portfolio, at 19.1 percent,<br />
and projected sales growth, at 11.3 percent, both exceed<br />
our targets.<br />
Staying on the Move<br />
This month’s feature is a trucking company that’s been<br />
named to Forbes Magazine’s Top 200 Best Small Com -<br />
Knight, a Small Transport Firm, Has Recently Added Rail Services<br />
% of % of Proj. Proj. Hist. return<br />
1/17/13 portfolio portfolio sales total relative to<br />
Stock value before KNX after KNX growth return market<br />
$ 796.23 2.5% 2.4% 12.0% 31.3% (46.7)%<br />
818.14 2.5 2.5 12.0 31.3 (31.8)<br />
NetEase.com, <strong>Inc</strong>. 840.73 2.6 2.5 13.0 (28.5) (24.7)<br />
Cognizant<br />
(purchased 6/31/2008)<br />
Cognizant<br />
(purchased 8/6/2012)<br />
2,165.47 6.7 6.5 20.0 25.4 96.9<br />
1,621.21 5.0 4.9 13.0 25.4 10.6<br />
Coach 1,273.58 3.9 3.8 13.0 24.4 12.9<br />
Aflac 1,424.96 4.4 4.3 9.0 22.7 18.7<br />
Bio-Reference<br />
(purchased 1/12/10)<br />
1,519.71 4.7 4.6 17.0 21.9 13.1<br />
Bio-Reference<br />
(purchased 2/1/11)<br />
Bio-Reference<br />
(purchased 12/28/11)<br />
1,277.91 4.0 3.8 17.0 21.9 11.4<br />
3,028.97 9.4 9.1 17.0 21.9 68.9<br />
Cisco Systems 1,963.43 6.1 5.9 8.0 19.6 (18.2)<br />
Landauer 1,027.11 3.2 3.1 8.0 19.4 1.3<br />
WellPoint 793.36 2.5 2.4 2.2 19.3 (41.3)<br />
Global Payments 1,190.11 3.7 3.6 11.0 19.0 (11.5)<br />
Techne 1,163.16 3.6 3.5 10.0 18.7 (21.2)<br />
ResMed 1,515.15 4.7 4.6 13.0 16.2 34.2<br />
Walgreen 966.21 3.0 2.9 7.0 13.8 (28.4)<br />
General Dynamics 1,934.20 6.0 5.8 5.0 13.1 (28.3)<br />
Stantec 1,681.04 5.2 5.1 12.0 11.2 28.3<br />
Johnson & Johnson 1,304.59 4.0 3.9 6.0 11.0 14.9<br />
Oracle 2,173.61 6.7 6.5 7.0 10.6 96.9<br />
Colgate-Palmolive 1,808.70 5.6 5.4 6.0 10.1 60.4<br />
Totals before Knight 32,287.57 11.3 19.1<br />
Knight Transportation 1,000.00 3.0 11.0 24.1<br />
Portfolio Totals 33,287.57 11.3 19.3