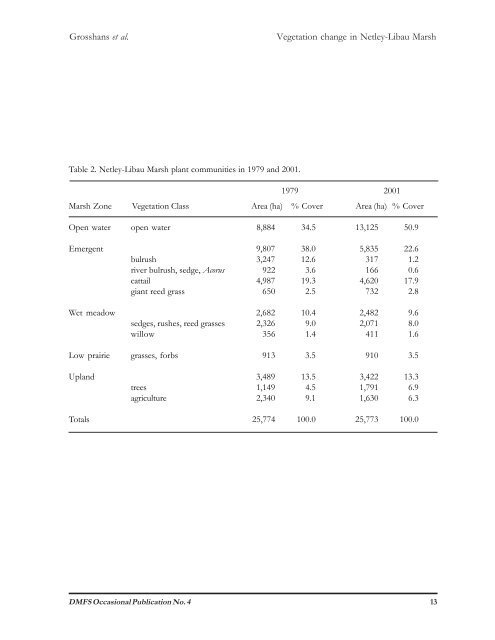
Vegetation change <strong>in</strong> <strong>Netley</strong>-<strong>Libau</strong> <strong>Marsh</strong> Grosshans et al. RESULTS <strong>Emergent</strong> Vegetation Zones <strong>of</strong> <strong>Netley</strong>-<strong>Libau</strong> <strong>Marsh</strong> - 2001 Dense communities <strong>of</strong> giant reed grass, willows, and mixed trees (Appendix 2) dom<strong>in</strong>ated <strong>the</strong> higher riverbanks or levees border<strong>in</strong>g <strong>the</strong> Red River and its major creeks and channels (Figure 5). Along <strong>the</strong> south shore <strong>of</strong> Lake W<strong>in</strong>nipeg, a heavily wooded beach ridge bordered by willows and giant reed grass formed <strong>the</strong> nor<strong>the</strong>rn boundary <strong>of</strong> <strong>Netley</strong>-<strong>Libau</strong> <strong>Marsh</strong> and separated <strong>the</strong> marsh from <strong>the</strong> lake. From <strong>the</strong>se mixed reed grass and willow communities <strong>of</strong> <strong>the</strong> river levees and beach ridge, <strong>the</strong> vegetation community progressed through sedge meadows to dense communities <strong>of</strong> cattail and bulrush toward open water. In <strong>the</strong> areas away from <strong>the</strong> lake and river, <strong>the</strong> typical vegetation sequence with<strong>in</strong> <strong>Netley</strong>- <strong>Libau</strong> <strong>Marsh</strong> followed a decreas<strong>in</strong>g moisture gradient. Vegetation began its progression from open water (<strong>of</strong>ten too deep for emergents) with submersed aquatics (e.g., sago pondweed, Stuckenia pect<strong>in</strong>atus). Border<strong>in</strong>g <strong>the</strong>se areas were <strong>the</strong> emergent macrophytes cattail, bulrush, and mixed patches <strong>of</strong> coarse emergents <strong>in</strong>clud<strong>in</strong>g hard- and s<strong>of</strong>t-stem bulrush, <strong>the</strong> three-sided river bulrush, sweet flag, and awned sedge, as well as cattail <strong>in</strong> lower abundances. Wet meadows, dom<strong>in</strong>ated primarily by awned sedge, reed canary grass and willows, fr<strong>in</strong>ged <strong>the</strong> emergent zones at seasonally flooded elevations where soils rema<strong>in</strong>ed waterlogged throughout <strong>the</strong> grow<strong>in</strong>g season. Low prairie grasses composed <strong>of</strong> mixed communities <strong>of</strong> low herbaceous grasses and forbs cont<strong>in</strong>ued <strong>the</strong> transition from wet meadows to uplands, with <strong>in</strong>creased proportions <strong>of</strong> upland forbs as moisture levels decreased up <strong>the</strong> elevation gradient. These meadows progressed from moist soil grasses and forb meadows (50% forb cover), treed prairies and trees at <strong>the</strong> fur<strong>the</strong>st edges <strong>of</strong> <strong>the</strong> marsh before reach<strong>in</strong>g cultivated fields. <strong>Community</strong> Composition and Abundance In 2001, half <strong>of</strong> <strong>the</strong> entire <strong>Netley</strong>-<strong>Libau</strong> <strong>Marsh</strong> (13,125 ha, 51%) was open water (Table 2), consist<strong>in</strong>g <strong>of</strong> <strong>in</strong>terconnected shallow bays and channels. Intermixed throughout this open water was a mosaic <strong>of</strong> emergent plant communities. The dom<strong>in</strong>ant emergent species with<strong>in</strong> <strong>Netley</strong>-<strong>Libau</strong> <strong>Marsh</strong> were cattail, giant reed grass, awned sedge, reed canary grass, willow, and bulrush, form<strong>in</strong>g large cont<strong>in</strong>uous monodom<strong>in</strong>ant vegetation zones and mixed vegetation patches. Of <strong>the</strong> total 25,773 ha <strong>of</strong> <strong>the</strong> marsh, cattail was by far <strong>the</strong> most abundant plant species at 4,620 ha, or 18% <strong>of</strong> <strong>the</strong> marsh area (Table 2). The next most abundant was <strong>the</strong> wet meadow community <strong>of</strong> sedges, rushes, and reeds, cover<strong>in</strong>g 2,071 ha or 8% <strong>of</strong> <strong>the</strong> marsh. Next were <strong>the</strong> treed areas, which covered 1,791 ha or 7% <strong>of</strong> <strong>the</strong> marsh area. Agricultural areas were next, cover<strong>in</strong>g 1,630 ha or 6% <strong>of</strong> <strong>the</strong> marsh (Table 2). 1979 vs. 2001 When compar<strong>in</strong>g <strong>the</strong> 2001 vegetation community (Figure 5) with that present <strong>in</strong> 1979 (Figure 4), it is apparent that a significant amount <strong>of</strong> emergent vegetation has been lost from <strong>Netley</strong>-<strong>Libau</strong> <strong>Marsh</strong>. The most noticeable physical change <strong>in</strong> <strong>the</strong> marsh has been <strong>the</strong> <strong>in</strong>crease <strong>in</strong> open water, from 35% (8,884 ha) <strong>in</strong> 1979 to 51% (13,125 ha) <strong>of</strong> <strong>the</strong> marsh <strong>in</strong> 2001 (Table 2). Ponds and bays throughout <strong>the</strong> marsh have <strong>in</strong>creased dramatically <strong>in</strong> size s<strong>in</strong>ce 1979. Erosion <strong>of</strong> separat<strong>in</strong>g uplands and loss <strong>of</strong> emergent vegetation between adjo<strong>in</strong><strong>in</strong>g water bodies s<strong>in</strong>ce 1979 has been extensive, result<strong>in</strong>g <strong>in</strong> <strong>the</strong> amalgamation <strong>of</strong> many marsh bays. This has been particularly apparent <strong>in</strong> <strong>the</strong> <strong>Netley</strong> Lake area (Figures 4, 5). Cattail accounted for almost 20% <strong>of</strong> <strong>the</strong> marsh area <strong>in</strong> 1979 (4,987 ha), and <strong>in</strong> 2001 cont<strong>in</strong>ued to be <strong>the</strong> dom<strong>in</strong>ant plant species with over 18% <strong>of</strong> <strong>the</strong> marsh area (4,620 ha) (Table 2). The plant species impacted <strong>the</strong> most s<strong>in</strong>ce 1979 have been hard- and s<strong>of</strong>t-stem bulrush, decreas<strong>in</strong>g ten-fold <strong>in</strong> abundance from 3,247 ha (13%) to 317 ha (1%). O<strong>the</strong>r plant communities that have changed over time <strong>in</strong>clude mixed river bulrush and sedge, and mixed wet meadow communities, decreas<strong>in</strong>g from 922 and 2,326 ha, to 166 and 2,071 ha, respectively. However, plant communities at drier sites, such as giant reed grass, low prairies, and uplands, have essentially rema<strong>in</strong>ed unchanged (Table 2). 12 DMFS Occasional Publication No. 4
Grosshans et al. Vegetation change <strong>in</strong> <strong>Netley</strong>-<strong>Libau</strong> <strong>Marsh</strong> Table 2. <strong>Netley</strong>-<strong>Libau</strong> <strong>Marsh</strong> plant communities <strong>in</strong> 1979 and 2001. 1979 2001 <strong>Marsh</strong> Zone Vegetation Class Area (ha) % Cover Area (ha) % Cover Open water open water 8,884 34.5 13,125 50.9 <strong>Emergent</strong> 9,807 38.0 5,835 22.6 bulrush 3,247 12.6 317 1.2 river bulrush, sedge, Acorus 922 3.6 166 0.6 cattail 4,987 19.3 4,620 17.9 giant reed grass 650 2.5 732 2.8 Wet meadow 2,682 10.4 2,482 9.6 sedges, rushes, reed grasses 2,326 9.0 2,071 8.0 willow 356 1.4 411 1.6 Low prairie grasses, forbs 913 3.5 910 3.5 Upland 3,489 13.5 3,422 13.3 trees 1,149 4.5 1,791 6.9 agriculture 2,340 9.1 1,630 6.3 Totals 25,774 100.0 25,773 100.0 DMFS Occasional Publication No. 4 13