Outlook for International Prices of Fertilizers, Raw Materials and ...
Outlook for International Prices of Fertilizers, Raw Materials and ...
Outlook for International Prices of Fertilizers, Raw Materials and ...

Create successful ePaper yourself
Turn your PDF publications into a flip-book with our unique Google optimized e-Paper software.
<strong>Outlook</strong> <strong>for</strong> <strong>International</strong><br />
<strong>Prices</strong> <strong>of</strong> <strong>Fertilizers</strong>, <strong>Raw</strong><br />
<strong>Materials</strong> <strong>and</strong> Intermediates<br />
Barrie Bain, Director<br />
FERTECONECON<br />
FAI, Hyderabad, 3 December 2009<br />
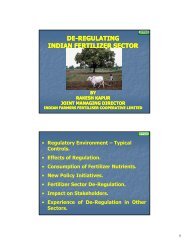
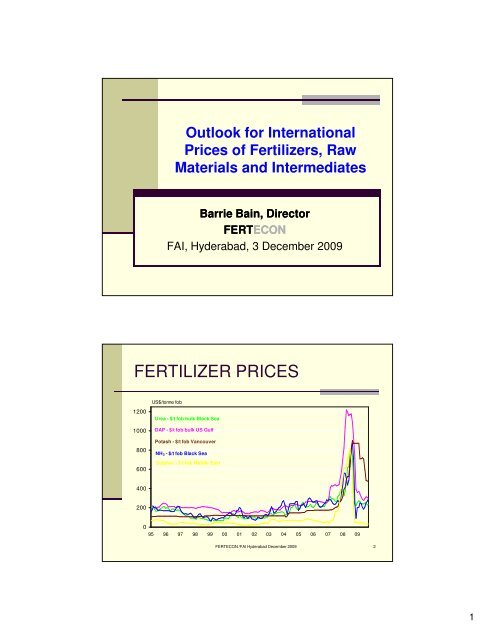
FERTILIZER PRICES<br />
US$/tonne fob<br />
1200<br />
1000<br />
800<br />
600<br />
Urea - $/t fob bulk Black Sea<br />
DAP - $/t fob bulk US Gulf<br />
Potash - $/t fob Vancouver<br />
NH 3 - $/t fob Black Sea<br />
Sulphur - $/t fob Middle East<br />
400<br />
200<br />
0<br />
95 96 97 98 99 00 01 02 03 04 05 06 07 08 09<br />
FERTECON /FAI Hyderabad December 2009 2<br />
1
WHAT HAPPENED IN 2008<br />
<br />
<br />
<br />
<br />
<br />
<br />
<br />
<br />
<br />
Fertilizer <strong>and</strong> intermediate prices reached all time highs <strong>for</strong> all products<br />
This was driven primarily by a surge in crop prices driven in turn by<br />
increased dem<strong>and</strong> <strong>and</strong> low stocks <strong>of</strong> key crops<br />
The drivers <strong>of</strong> dem<strong>and</strong> were economic growth in rapidly developing<br />
countries, particularly in Asia plus the surge <strong>of</strong> interest in bi<strong>of</strong>uels<br />
High energy prices stimulated bi<strong>of</strong>uels dem<strong>and</strong>, but also increased<br />
fertilizer production costs<br />
Supply proved inadequate to meet the surge in dem<strong>and</strong><br />
Rationalisation in the phosphate industry in 2005 <strong>and</strong> 2006 meant there<br />
was insufficient capacity to meet the unexpected surge <strong>of</strong> dem<strong>and</strong><br />
Overcapacity in potash since the 1970s meant there had been little ne<br />
investment. The loss <strong>of</strong> a mine in Russia to flooding tightened the<br />
market<br />
The application <strong>of</strong> high tariffs cut <strong>of</strong>f urea exports from China<br />
Strong dem<strong>and</strong> from the phosphate industry <strong>and</strong> delays to new supply<br />
led to a surge in sulphur prices<br />
FERTECON /FAI Hyderabad December 2009 3<br />
BACK TO REALITY<br />
Crop prices fell sharply in the second half <strong>of</strong> 2008 as the<br />
commodity bubble burst, but are now increasing<br />
Oil <strong>and</strong> natural gas fell sharply but have now increased<br />
Urea prices fell sharply to the cost <strong>of</strong> marginal export<br />
supply<br />
Ammonia prices fell to below FSU export costs but have<br />
partly recovered<br />
DAP prices fell $900 from their peak <strong>of</strong> $1200 in the early<br />
summer 2008<br />
Sulphur prices have corrected back to pre-boom lows<br />
Potash prices have fallen but remain above pre-boom<br />
levels<br />
FERTECON /FAI Hyderabad December 2009 4<br />
2
WHAT HAPPENED?<br />
The financial crisis <strong>and</strong> credit crunch had<br />
direct <strong>and</strong> indirect effects on the fertilizer<br />
industry – it burst the bubble<br />
Agricultural commodity prices fell<br />
Tightened credit lines slowed both agricultural<br />
<strong>and</strong> fertilizer markets<br />
Downside price risk discouraged buying<br />
Recession hit non-fertilizer dem<strong>and</strong> <strong>for</strong><br />
ammonia <strong>and</strong> sulphur<br />
FERTECON /FAI Hyderabad December 2009 5<br />
WHAT NOW?<br />
The period <strong>of</strong> global destocking <strong>of</strong> fertilizer is<br />
over<br />
Agricultural commodity prices are starting to<br />
improve<br />
Credit remains tight, encouraging “just-intime”<br />
buying through the supply chain – could<br />
lead to short term price increases<br />
Downside price risk gone, except <strong>for</strong> potash<br />
Non-fertilizer dem<strong>and</strong> <strong>for</strong> ammonia <strong>and</strong><br />
sulphur starting to recover - slowly<br />
FERTECON /FAI Hyderabad December 2009 6<br />
3
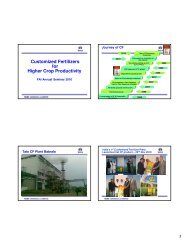
FERTILIZER PRICES<br />
1200<br />
1000<br />
800<br />
600<br />
US$/tonne fob<br />
Urea - $/t fob bulk Black Sea<br />
DAP - $/t fob bulk US Gulf<br />
Potash - $/t fob Vancouver<br />
NH 3 - $/t fob Black Sea<br />
Sulphur - $/t fob Middle East<br />
400<br />
200<br />
0<br />
95 96 97 98 99 00 01 02 03 04 05 06 07 08 09<br />
FERTECON /FAI Hyderabad December 2009 7<br />
UREA PRICES<br />
US$/tonne fob<br />
800<br />
Urea - $/t fob bulk Black Sea<br />
600<br />
400<br />
200<br />
0<br />
J<br />
07<br />
F M A M J<br />
J A S O N D J F M A M J<br />
08<br />
J A S O N D J F M A M J<br />
09<br />
J A S O<br />
FERTECON /FAI Hyderabad December 2009 8<br />
4
POTASH PRICES<br />
1000<br />
US$/tonne fob<br />
POTASH - $/t fob bulk Vancouver<br />
800<br />
600<br />
400<br />
200<br />
0<br />
J<br />
07<br />
F M A M J<br />
J A S O N D J F M A M J<br />
08<br />
J A S O N D J F M A M J<br />
09<br />
J A S O<br />
FERTECON /FAI Hyderabad December 2009 9<br />
SULPHUR PRICES<br />
US$/tonne fob<br />
800<br />
SULPHUR - $/t fob bulk Middle<br />
East<br />
600<br />
400<br />
200<br />
0<br />
J<br />
07<br />
F M A M J<br />
J A S O N D J F M A M J<br />
08<br />
J A S O N D J F M A M J<br />
09<br />
J A S O<br />
FERTECON /FAI Hyderabad December 2009 10<br />
5
AMMONIA PRICES<br />
US$/tonne fob<br />
800<br />
Ammonia - $/t fob Yuzhnyy<br />
600<br />
400<br />
200<br />
0<br />
J<br />
07<br />
F M A M J<br />
J A S O N D J F M A M J<br />
08<br />
J A S O N D J F M A M J<br />
09<br />
J A S O<br />
FERTECON /FAI Hyderabad December 2009 11<br />
PHOSPHATE PRICES<br />
1400<br />
1200<br />
US$/tonne fob<br />
DAP - $/t fob bulk US Gulf<br />
1000<br />
800<br />
600<br />
400<br />
200<br />
0<br />
J<br />
07<br />
F M A M J<br />
J A S O N D J F M A M J<br />
08<br />
J A S O N D J F M A M J<br />
09<br />
J A S O<br />
FERTECON /FAI Hyderabad December 2009 12<br />
6
LONG TERM PERSPECTIVE<br />
1000<br />
NH3 - US$/tonne fob US/Caribbean - quarterly high<br />
AMMONIA PRICE 1970-2009<br />
900<br />
800<br />
30 year average: $174<br />
700<br />
600<br />
500<br />
400<br />
300<br />
200<br />
100<br />
0<br />
70 75 80 85 90 95 00 05<br />
FERTECON /FAI Hyderabad December 2009 13<br />
POTASH PRICES – LONG TERM<br />
900<br />
800<br />
US$/t fob Vancouver<br />
FERTECON<br />
700<br />
600<br />
500<br />
400<br />
300<br />
200<br />
price converted to<br />
2008 dollars<br />
100<br />
actual price<br />
0<br />
81 82 83 84 85 86 87 88 89 90 91 92 93 94 95 96 97 98 99 00 01 02 03 04 05 06 07 08 09<br />
FERTECON /FAI Hyderabad December 2009 14<br />
7
PRICE DRIVERS<br />
Agricultural fundamentals<br />
WHAT DRIVES FERTILIZER<br />
PRICES?<br />
<strong>Fertilizers</strong> are a commodity<br />
The drivers are supply <strong>and</strong> dem<strong>and</strong><br />
Dem<strong>and</strong> is driven by the ag economy<br />
For nitrogen, short term supply/dem<strong>and</strong><br />
trends can have more influence on price than<br />
longer term trends<br />
This can also be the case in phosphates<br />
Marketing structure means potash prices tend<br />
to be influenced more by longer-term trends<br />
FERTECON /FAI Hyderabad December 2009 16<br />
8
DEMAND DRIVERS<br />
POPULATION - more mouths to feed<br />
BETTER NUTRITION – increased meat<br />
consumption in rapidly growing economies,<br />
more varied diets – more feed grains required<br />
ARABLE LAND AVAILABILITY – need to<br />
increase yields<br />
NUTRIENT BALANCES – under-application <strong>of</strong><br />
P <strong>and</strong> K in many areas – e.g. India <strong>and</strong> China<br />
COMMERCIAL CROPS – af<strong>for</strong>dability – if<br />
farmers are getting a good price <strong>for</strong> their crops<br />
they look to optimise fertilizer application<br />
BIOFUELS – new dem<strong>and</strong><br />
FERTECON /FAI Hyderabad December 2009 17<br />
DEMAND DRIVER CHANGES<br />
POPULATION - still more mouths to feed<br />
BETTER NUTRITION – meat <strong>and</strong> vegetable consumption<br />
- growth has continued in India, China etc despite the<br />
recession<br />
ARABLE LAND AVAILABILITY – need to increase yields –<br />
more ag l<strong>and</strong> in Latin America – but that needs fertilizer<br />
NUTRIENT BALANCES – under-application <strong>of</strong> P <strong>and</strong> K -<br />
but high prices lead to dem<strong>and</strong> destruction in P <strong>and</strong> K<br />
COMMERCIAL CROPS – af<strong>for</strong>dability – crop prices have<br />
come <strong>of</strong>f peaks <strong>and</strong> high fertilizer prices were<br />
unaf<strong>for</strong>dable <strong>for</strong> subsistence agriculture<br />
BIOFUELS – new dem<strong>and</strong> – some countries backing <strong>of</strong>f<br />
from bi<strong>of</strong>uels commitments – but massive expansion in<br />
Brazil <strong>and</strong> renewed commitment from President Obama<br />
FERTECON /FAI Hyderabad December 2009 18<br />
9
POPULATION<br />
9<br />
billions<br />
8<br />
Increase 2000 - 2030<br />
Low variant - 28%<br />
Medium variant - 36%<br />
High variant - 43%<br />
7<br />
6<br />
Source: UN 2008<br />
2000 2005 2010 2015 2020 2025 2030<br />
note: consumption data is<br />
FERTECON /FAI Hyderabad December 2009 19<br />
USDA GLOBAL MEAT PRODUCTION<br />
FERTECON /FAI Hyderabad December 2009 20<br />
10
NUTRIENT BALANCES<br />
N P K<br />
2020<br />
2015<br />
2010<br />
2005<br />
1995<br />
0% 25% 50% 75% 100%<br />
FERTECON /FAI Hyderabad December 2009 21<br />
CROP PRICES<br />
Crop prices are the key underlying driver <strong>of</strong><br />
fertilizer dem<strong>and</strong> in commercial agriculture<br />
At times <strong>of</strong> high crop prices farmers want to<br />
maximise yields to maximise revenue<br />
This supports high fertilizer prices as long as<br />
farmers see a positive margin<br />
There is a cumulative effect – good farmer<br />
income in the previous year makes farmers<br />
more willing (<strong>and</strong> able) to pay higher fertilizer<br />
prices.<br />
FERTECON /FAI Hyderabad December 2009 22<br />
11
FERTILIZER USE BY CROP<br />
15%<br />
4%<br />
4%<br />
5%<br />
15%<br />
2%<br />
4%<br />
5%<br />
16%<br />
15%<br />
15%<br />
Wheat<br />
Rice<br />
Corn<br />
Other coarse grain<br />
Soybean<br />
Oil palm<br />
Other oilseed<br />
Cotton<br />
Sugar<br />
Fruit + Veg<br />
Other<br />
Source: IFA<br />
FERTECON /FAI Hyderabad December 2009 23<br />
NITROGEN USE BY CROP<br />
15%<br />
3%<br />
4%<br />
15%<br />
5%<br />
1% 1% 5%<br />
16%<br />
19%<br />
16%<br />
Wheat<br />
Rice<br />
Corn<br />
Other coarse grain<br />
Soybean<br />
Oil palm<br />
Other oilseed<br />
Cotton<br />
Sugar<br />
Fruit + Veg<br />
Other<br />
Source: IFA<br />
FERTECON /FAI Hyderabad December 2009 24<br />
12
PHOSPHATE USE BY CROP<br />
16%<br />
3%<br />
4%<br />
5%<br />
15%<br />
1%<br />
8%<br />
5%<br />
17%<br />
13%<br />
13%<br />
Wheat<br />
Rice<br />
Corn<br />
Other coarse grain<br />
Soybean<br />
Oil palm<br />
Other oilseed<br />
Cotton<br />
Sugar<br />
Fruit + Veg<br />
Other<br />
Source: IFA<br />
FERTECON /FAI Hyderabad December 2009 25<br />
POTASH USE BY CROP<br />
18%<br />
8%<br />
15%<br />
3%<br />
4%<br />
5%<br />
8%<br />
8%<br />
13%<br />
4%<br />
14%<br />
Wheat<br />
Rice<br />
Corn<br />
Other coarse grain<br />
Soybean<br />
Oil palm<br />
Other oilseed<br />
Cotton<br />
Sugar<br />
Fruit + Veg<br />
Other<br />
Source: IFA<br />
FERTECON /FAI Hyderabad December 2009 26<br />
13
US CROP PRICES<br />
$/bushel<br />
15<br />
14<br />
Monthly average price received by farmers<br />
13<br />
12<br />
11<br />
10<br />
9<br />
8<br />
soybean<br />
7<br />
6<br />
5<br />
wheat<br />
4<br />
3<br />
2<br />
1<br />
corn<br />
0<br />
03 04 05 06 07 08 09<br />
Source: USDA<br />
FERTECON /FAI Hyderabad December 2009 27<br />
CORN PRICES<br />
US$/bushel received by farmers<br />
6<br />
5<br />
4<br />
3<br />
2<br />
1<br />
0<br />
81 82 83 84 85 86 87 88 89 90 91 92 93 94 95 96 97 98 99 00 01 02 03 04 05 06 07 08 09<br />
FERTECON /FAI Hyderabad December 2009 28<br />
14
CORN PRICES<br />
8<br />
7<br />
6<br />
US$/bushel received by farmers<br />
price converted to 2009 dollars<br />
28 year average<br />
$2.51 - dollars <strong>of</strong> the day<br />
$3.76 - 2009 dollars<br />
5<br />
4<br />
3<br />
2<br />
1<br />
actual<br />
0<br />
81 82 83 84 85 86 87 88 89 90 91 92 93 94 95 96 97 98 99 00 01 02 03 04 05 06 07 08 09<br />
FERTECON /FAI Hyderabad December 2009 29<br />
CORN NETBACKS v UREA<br />
$ s/ton NOLA<br />
800<br />
700<br />
600<br />
$/bushel<br />
8<br />
7<br />
6<br />
500<br />
400<br />
300<br />
corn netbacks to US farmers<br />
5<br />
4<br />
3<br />
200<br />
100<br />
urea price<br />
2<br />
1<br />
0<br />
J M M J<br />
06<br />
S N J M M J S N J M M J<br />
07<br />
08<br />
S N J M M J<br />
09<br />
S<br />
0<br />
FERTECON /FAI Hyderabad December 2009 30<br />
15
CORN NETBACKS v UREA<br />
$ s/ton NOLA<br />
600<br />
$/bushel<br />
6<br />
500<br />
5<br />
400<br />
300<br />
corn netbacks to US farmers<br />
4<br />
3<br />
200<br />
2<br />
100<br />
0<br />
urea price<br />
91 92 93 94 95 96 97 98 99 00 01 02 03 04 05 06 07 08 09 10<br />
1<br />
0<br />
FERTECON /FAI Hyderabad December 2009 31<br />
STRONG AG MARKETS<br />
FORECAST<br />
The USDA is <strong>for</strong>ecasting continued growth in<br />
ag export trade<br />
Forward crop prices are higher than current<br />
levels<br />
There has been a step change – recent very<br />
high crop prices were not sustainable – but<br />
nor were the low prices <strong>of</strong> the late 1990s<br />
FERTECON /FAI Hyderabad December 2009 32<br />
16
AGRICULTURE OUTLOOK<br />
Strong growth in trade in all key crops<br />
Exports are based on commercial farming that will<br />
want to maximise yields by optimising fertilizer<br />
application<br />
In addition countries with large populations such as<br />
India <strong>and</strong> China will look to maximise their domestic<br />
crop production to ensure food security – <strong>and</strong><br />
minimise imports <strong>of</strong> high-priced crops at a time <strong>of</strong><br />
tight global supply<br />
China <strong>and</strong> Middle East countries are now looking to<br />
develop contract agriculture in Central Asia, Africa<br />
<strong>and</strong> South America to produce food <strong>for</strong> China<br />
Brazil has planning a major increase in sugar cane<br />
plantings <strong>for</strong> ethanol production<br />
FERTECON /FAI Hyderabad December 2009 33<br />
US CORN USE<br />
FERTECON /FAI Hyderabad December 2009 34<br />
17
USDA GLOBAL CORN TRADE<br />
FERTECON /FAI Hyderabad December 2009 35<br />
US CORN PRICES AND STOCKS<br />
TO USE RATIOS<br />
FERTECON /FAI Hyderabad December 2009 36<br />
18
CROP PRICES AND FERTILIZER<br />
PRICES<br />
High commercial crop prices support high<br />
fertilizer prices by creating additional dem<strong>and</strong><br />
in markets such as the US <strong>and</strong> Brazil as<br />
farmers look to maximise yields<br />
High crop prices also enable farmers to pay<br />
higher prices <strong>for</strong> fertilizer<br />
High crop prices also provide a stimulus <strong>for</strong><br />
countries with large populations such as India<br />
<strong>and</strong> China to maximise crop production to<br />
ensure food security <strong>and</strong> minimise imports<br />
FERTECON /FAI Hyderabad December 2009 37<br />
PHOSPHATE AND POTASH<br />
HOLIDAYS<br />
Farmers throughout the world have taken<br />
phosphate <strong>and</strong> potash “holidays” – cutting<br />
application to save money<br />
Despite this, in many regions yields have<br />
been good “mining” the soil <strong>of</strong> P <strong>and</strong> K<br />
There could be a delayed impact on yields <strong>for</strong><br />
next year’s crops<br />
We could see a bounce-back in P <strong>and</strong> K<br />
consumption from 2010<br />
FERTECON /FAI Hyderabad December 2009 38<br />
19
SUBSISTENCE AGRICULTURE<br />
There is a different picture <strong>for</strong> subsistence<br />
agriculture, which has suffered badly from high<br />
fertilizer prices<br />
High fertilizer prices result in a sudden <strong>and</strong> sharp<br />
drop in dem<strong>and</strong> – unless subsidy systems are in<br />
place, as in India<br />
However the impact <strong>of</strong> this on the world fertilizer<br />
market is limited by the domination <strong>of</strong> dem<strong>and</strong> from<br />
the commercial agricultural sector<br />
Subsistence agriculture needs to be protected from<br />
fertilizer price fluctuations <strong>for</strong> social, humanitarian<br />
<strong>and</strong> economic reasons<br />
FERTECON /FAI Hyderabad December 2009 39<br />
DOMINATION OF ASIA<br />
MAJOR NITROGEN CONSUMERS<br />
Total 96.7 million tonnes N - 2008<br />
Brazil<br />
3%<br />
EU<br />
11%<br />
FSU<br />
4%<br />
Africa<br />
3%<br />
Others<br />
9%<br />
Other Asia<br />
12%<br />
India<br />
15%<br />
Canada<br />
2%<br />
US<br />
12%<br />
China<br />
29%<br />
FERTECON /FAI Hyderabad December 2009 40<br />
20
DOMINATION OF ASIA<br />
MAJOR PHOSPHATE FERTILIZER CONSUMERS<br />
Total 38.8 million tonnes P2O5 - 2008/9<br />
US<br />
8%<br />
Canada<br />
2%<br />
Latin America<br />
13%<br />
Oceania<br />
3%<br />
Africa<br />
3%<br />
FSU<br />
2%<br />
Europe<br />
6%<br />
Asia<br />
63%<br />
Source: IFA<br />
FERTECON /FAI Hyderabad December 2009 41<br />
DOMINATION OF ASIA<br />
MAJOR POTASH FERTILIZER CONSUMERS<br />
Total 26.5 million tonnes K 2O - 2008<br />
0thers<br />
27%<br />
Other Asia<br />
14%<br />
India<br />
11%<br />
Brazil<br />
14%<br />
Canada<br />
1%<br />
US<br />
12%<br />
China<br />
21%<br />
FERTECON /FAI Hyderabad December 2009 42<br />
21
DEMAND – SHORT TERM<br />
Fertilizer dem<strong>and</strong> has fallen in all three sectors –<br />
dem<strong>and</strong> was down in second half 2008 <strong>and</strong> so far in<br />
2009<br />
Nitrogen dem<strong>and</strong> is recovering first – dem<strong>and</strong> is<br />
starting to pick up<br />
Phosphate dem<strong>and</strong> is starting to pick up slightly, but<br />
major improvement not expected until 2010<br />
Potash dem<strong>and</strong> remains low in 2009 <strong>and</strong> recovery<br />
will be slower than <strong>for</strong> other nutrients due to<br />
comparatively high prices<br />
Recovery depends on key crop prices recovering <strong>and</strong><br />
credit being available throughout the supply chain<br />
FERTECON /FAI Hyderabad December 2009 43<br />
SHORT TERM DEMAND<br />
200<br />
Milllion tonnes<br />
175<br />
150<br />
K<br />
125<br />
P<br />
100<br />
75<br />
N<br />
50<br />
25<br />
0<br />
2007 2008 2009 2010<br />
FERTECON /FAI Hyderabad December 2009 44<br />
22
SHORT TERM DEMAND<br />
125<br />
Milllion tonnes<br />
100<br />
N<br />
75<br />
P<br />
50<br />
K<br />
25<br />
0<br />
2007 2008 2009 2010<br />
FERTECON /FAI Hyderabad December 2009 45<br />
DEMAND GROWTH - MEDIUM<br />
TERM<br />
Fertilizer dem<strong>and</strong> will to grow in all three sectors from<br />
2010<br />
Nitrogen dem<strong>and</strong> growth will be the strongest initially<br />
but the lowest longer term<br />
Phosphate dem<strong>and</strong> growth will be higher in the<br />
medium term as nutrient imbalances are addressed<br />
in key market areas<br />
Potash dem<strong>and</strong> will be slow to recover but eventually<br />
growth will be stronger than the other nutrients –<br />
nutrient imbalances are greater <strong>and</strong> some <strong>of</strong> the main<br />
growth crops are big potash users – soybean, palm<br />
oil, sugar cane<br />
FERTECON /FAI Hyderabad December 2009 46<br />
23
MEDIUM TERM DEMAND<br />
225<br />
Milllion tonnes<br />
200<br />
175<br />
150<br />
125<br />
100<br />
K<br />
P<br />
N<br />
75<br />
50<br />
25<br />
0<br />
2005 2010 2015 2020<br />
FERTECON /FAI Hyderabad December 2009 47<br />
MEDIUM TERM DEMAND<br />
125<br />
Milllion tonnes<br />
100<br />
N<br />
P<br />
75<br />
K<br />
50<br />
25<br />
0<br />
2005 2010 2015 2020<br />
FERTECON /FAI Hyderabad December 2009 48<br />
24
SUPPLY FACTORS<br />
Supply management key to price<br />
development<br />
FERTILIZER PRODUCTION<br />
120000<br />
'000 tonnes nutrient<br />
100000<br />
80000<br />
60000<br />
40000<br />
20000<br />
0<br />
2007 2008 2009 2007 2008 2009 2007 2008 2009<br />
N<br />
P2O5<br />
K2O<br />
Latin America<br />
North America<br />
Oceania<br />
Asia<br />
Middle east<br />
Africa<br />
FSU<br />
Central Europe<br />
West Europe<br />
FERTECON /FAI Hyderabad December 2009 50<br />
25
SUPPLY FACTORS<br />
NITROGEN – many producers with no one<br />
producer or group <strong>of</strong> producers able/willing to<br />
manage supply<br />
PHOSPHATE – Increased concentration in<br />
the US facilitating some supply management<br />
POTASH – Supply concentrated with major<br />
producers managing supply<br />
FERTECON /FAI Hyderabad December 2009 51<br />
SUPPLY MANAGEMENT<br />
Supply management protects prices in a<br />
downturn <strong>and</strong> sets the scene <strong>for</strong> big<br />
increases in prices when dem<strong>and</strong> moves<br />
upwards<br />
Surplus capacity is managed in both phases<br />
<strong>of</strong> the cycle<br />
Possible in potash <strong>and</strong> phosphates, but not<br />
nitrogen<br />
FERTECON /FAI Hyderabad December 2009 52<br />
26
NITROGEN SUPPLY<br />
Many suppliers – FSU, Middle East, North<br />
Africa, Asia<br />
Desire to utilize cheap gas feedstock<br />
encourages new investment<br />
Low cost producers do not manage supply –<br />
they keep producing whatever the price<br />
Relatively quick to build a new worldscale<br />
plant – less than 3 years<br />
Construction costs are increasing which may<br />
slow new capacity additions<br />
FERTECON /FAI Hyderabad December 2009 53<br />
NITROGEN FUNDAMENTALS<br />
Ammonia is the building block <strong>of</strong> the world<br />
nitrogen industry providing the feedstock <strong>for</strong><br />
urea, nitrates, the nitrogen content <strong>of</strong> DAP<br />
<strong>and</strong> a range <strong>of</strong> industrial uses<br />
To produce ammonia you need a<br />
hydrocarbon feedstock – usually natural gas,<br />
but coal is also important<br />
Urea is by far the most important nitrogen<br />
fertilizer accounting <strong>for</strong> 56% <strong>of</strong> nitrogen use<br />
FERTECON /FAI Hyderabad December 2009 54<br />
27
WORLD NITROGEN FERTILIZER<br />
USE BY TYPE 2007<br />
compounds<br />
other<br />
NH 3<br />
UAN<br />
AS<br />
CAN<br />
AN<br />
urea<br />
FERTECON /FAI Hyderabad December 2009 55<br />
NITROGEN PRODUCTION<br />
CO 2<br />
UREA NITRIC ACID<br />
AMMONIA<br />
NATURAL GAS/<br />
COAL<br />
UAN<br />
AMMONIUM<br />
NITRATES<br />
FERTECON /FAI Hyderabad December 2009 56<br />
28
WORLD DEMAND FOR AMMONIA<br />
BY END-USE 2007<br />
Total 157 million tonnes product<br />
Direct<br />
application<br />
Urea<br />
Fertilizer<br />
Nonfertilizer<br />
Other N<br />
Other<br />
Cx<br />
MAP/<br />
DAP<br />
AN/CAN/<br />
ASN<br />
FERTECON /FAI Hyderabad December 2009 57<br />
NEW AMMONIA PLANTS<br />
LOCATION OF AMMONIA EXPORT SUPPLY ADDITIONS - 2008-2013<br />
3<br />
million tonnes NH3<br />
2<br />
Others<br />
N. Africa<br />
Middle East<br />
1<br />
0<br />
2009 2010 2011 2012 2013<br />
FERTECON /FAI Hyderabad December 2009 58<br />
29
AMMONIA SUPPLY GROWTH<br />
million tonnes product<br />
5<br />
CUMULATIVE GROWTH IN LOW-COST NH 3 EXPORT SUPPLY v. IMPORT<br />
DEMAND (base year 2007)<br />
4<br />
3<br />
2<br />
1<br />
0<br />
-1<br />
2008 2009 2010 2011 2012 2013 2014 2015<br />
Cumulative growth in low-cost export supply<br />
Cumulative change in import dem<strong>and</strong><br />
-2<br />
FERTECON /FAI Hyderabad December 2009 59<br />
UREA FUNDAMENTALS<br />
Urea production is dominated by the large<br />
Asian producers – China <strong>and</strong> India<br />
Around one quarter <strong>of</strong> urea production enters<br />
international trade<br />
Exports are dominated by the CIS <strong>and</strong> Middle<br />
East<br />
Imports are dominated by Asia, North<br />
America <strong>and</strong> Latin America<br />
FERTECON /FAI Hyderabad December 2009 60<br />
30
WORLD: UREA PRODUCTION 2007<br />
Total 141 million tonnes<br />
China<br />
India<br />
Middle East<br />
N. Africa<br />
CIS<br />
Other Europe EU15<br />
Other Asia<br />
Oceania<br />
North America<br />
Latin America<br />
FERTECON /FAI Hyderabad December 2009 61<br />
UREA CONSUMPTION<br />
Total urea consumption - 141 million t - 2007<br />
Oceania<br />
Africa<br />
FSU<br />
M. East<br />
L. America<br />
Asia<br />
N. America<br />
Europe<br />
FERTECON /FAI Hyderabad December 2009 62<br />
31
NEW UREA PLANTS<br />
Increase from 169 million t in 2008 to 222<br />
million t in 2015 (FERTECON <strong>for</strong>ecasts)<br />
Increase in export capacity <strong>of</strong> 14.4 million t by<br />
2014<br />
Most new export capacity in Middle<br />
East/North Africa<br />
New export capacity all located in low gas<br />
cost areas<br />
Continued expansion <strong>for</strong> local consumption in<br />
Asia<br />
FERTECON /FAI Hyderabad December 2009 63<br />
UREA SUPPLY GROWTH<br />
milion tonnes<br />
50<br />
UREA EXPORTS 2005, 2008, 2013 AND 2020<br />
40<br />
30<br />
20<br />
10<br />
Other<br />
Marginal<br />
Other<br />
Dedicated<br />
CIS<br />
Middle East<br />
0<br />
2005 2008 2013 2020<br />
FERTECON /FAI Hyderabad December 2009 64<br />
32
NITROGEN FEEDSTOCK<br />
<br />
<br />
<br />
<br />
<br />
<br />
<br />
Outside <strong>of</strong> China, natural gas is the key feedstock <strong>for</strong> fertilizer<br />
production.<br />
Gas production is increasing – not only in low-cost areas like the<br />
Middle East but in major gas consuming areas like India, the US<br />
<strong>and</strong> Europe<br />
<strong>Prices</strong> have fallen in the US due to the surge <strong>of</strong> gas supply from<br />
shale gas deposits using new drilling techniques<br />
The same techniques are now starting to be used in Europe <strong>and</strong><br />
will be spread elsewhere – massively increasing potential gas<br />
supply<br />
This is likely to reduce the differential in gas prices between lowcost<br />
areas <strong>and</strong> major consuming areas<br />
LNG provides the balancing mechanism between different markets<br />
Lower gas costs in markets like the US, Europe <strong>and</strong> India will<br />
reduce their cost disadvantage over low cost producers –<br />
especially when transport <strong>and</strong> capital costs are taken into account.<br />
FERTECON /FAI Hyderabad December 2009 65<br />
PHOSPHATE SUPPLY<br />
Typified by over-supply in the US industry until<br />
2005/6 <strong>and</strong> the <strong>for</strong>mation <strong>of</strong> Mosaic<br />
Mosaic acted to rationalise capacity, closing plants to<br />
bring supply back into balance <strong>and</strong> to compensate <strong>for</strong><br />
the loss <strong>of</strong> the export market to China<br />
Phosphate became more like potash – with managed<br />
supply – but the dem<strong>and</strong> collapse in 2008 <strong>and</strong> 2009<br />
showed that suppliers would rather sell than cut<br />
production<br />
From 2011/12 the 3 million t/y Ma’aden plant in Saudi<br />
Arabia will significantly increase supply to the market<br />
OCP/Morocco <strong>and</strong> other phosphate-rich countries are<br />
focussing on joint-ventures <strong>for</strong> future development<br />
FERTECON /FAI Hyderabad December 2009 66<br />
33
PHOSPHATE PRODUCTION<br />
PHOSPHATE<br />
ROCK<br />
SSP<br />
SULPHURIC ACID<br />
SULPHUR<br />
PHOSPHORIC<br />
ACID<br />
TSP<br />
DAP/MAP<br />
AMMONIA<br />
FERTECON /FAI Hyderabad December 2009 67<br />
PHOSPHATE SUPPLY<br />
MAP/DAP EXPORTS 2008<br />
Total 7.9 million tonnes P2O5 / 14.5 million tonnes product<br />
Jordan<br />
4%<br />
China<br />
12%<br />
Australia<br />
2%<br />
Others<br />
5%<br />
Russia<br />
20%<br />
Tunisia<br />
6%<br />
Morocco<br />
7%<br />
Mexico<br />
2%<br />
Lithuania<br />
5%<br />
Source: IFA<br />
US<br />
37%<br />
FERTECON /FAI Hyderabad December 2009 68<br />
34
POTENTIAL PHOSPHATE<br />
PROJECTS – ROCK<br />
Increase from 189 million t in 2008 to 248 million t in<br />
2013 (IFA data)<br />
Europe – Yara (Finl<strong>and</strong>)<br />
Africa – Algeria, Morocco, Egypt, Tunisia, Senegal,<br />
Togo<br />
Middle East – Jordan, Israel<br />
Asia – China<br />
Oceania – Australia<br />
North America – Ontario, Canada<br />
Latin America – Brazil, Mexico, Peru<br />
FERTECON /FAI Hyderabad December 2009 69<br />
NEW PHOSPHATE PROJECTS –<br />
PHOSPHORIC ACID<br />
Increase from 43 million t P2O5 to 55 million t<br />
in 2013 (IFA data) – although most<br />
expansions <strong>for</strong> on-site downstream use<br />
Little new merchant grade acid capacity<br />
Africa – Algeria, Morocco, Egypt, Tunisia,<br />
Senegal, Togo<br />
Middle East – Saudi Arabia, Jordan<br />
Asia – China, India<br />
North America – Ontario, Canada<br />
Latin America – Brazil, Mexico<br />
FERTECON /FAI Hyderabad December 2009 70<br />
35
NEW PHOSPHATE PROJECTS –<br />
MAP/DAP/TSP<br />
Additional 9 million t by 2013 (IFA data)<br />
Africa – Algeria, Morocco, Egypt, Tunisia<br />
Middle East – Saudi Arabia, Jordan<br />
Asia – China, India, Pakistan, Vietnam<br />
Latin America – Brazil, Mexico, Venezuela<br />
FERTECON /FAI Hyderabad December 2009 71<br />
CHINA – THE WILD CARD<br />
Formerly world’s biggest importer <strong>of</strong> phosphates<br />
China’s policy to become self-sufficient in phosphates<br />
was achieved in 2006<br />
Uses domestic phosphate rock – but new plants<br />
mostly based on imported sulphur<br />
Supply grew faster than dem<strong>and</strong><br />
Became major exporter <strong>of</strong> phosphates<br />
Exports now restricted by export duties <strong>for</strong> part <strong>of</strong><br />
year<br />
China’s underlying policy is that phosphate exports<br />
should be restricted to ensure long-term secure<br />
supply <strong>for</strong> domestic requirements<br />
FERTECON /FAI Hyderabad December 2009 72<br />
36
POTASH SUPPLY<br />
Supply very concentrated<br />
Two major supply points – Canada <strong>and</strong> FSU<br />
– account <strong>for</strong> two thirds <strong>of</strong> world production<br />
This is represented by six producers <strong>and</strong><br />
three marketing organisations<br />
Three marketing organisations – Canpotex,<br />
BPC <strong>and</strong> K+S – account <strong>for</strong> 70% <strong>of</strong> sales<br />
Five marketing organisations control 85% <strong>of</strong><br />
sales.<br />
FERTECON /FAI Hyderabad December 2009 73<br />
POTASH PRODUCTION<br />
SULPHUR<br />
MOP<br />
SULPHURIC ACID<br />
SOP<br />
AMMONIA<br />
NOP<br />
FERTECON /FAI Hyderabad December 2009 74<br />
37
POTASH SUPPLY<br />
Total 33.6 million tonnes K 2 O - 2007 estimate<br />
FSU<br />
Germany<br />
Israel<br />
Jordan<br />
China<br />
US<br />
Others<br />
Canada<br />
FERTECON /FAI Hyderabad December 2009 75<br />
NEW POTASH SUPPLY<br />
60<br />
50<br />
Capacity - Milllion tonnes/year K2O<br />
FSU Canada Others<br />
40<br />
30<br />
20<br />
10<br />
0<br />
2008 2009 2010 2011 2012 2013 2014 2015<br />
FERTECON /FAI Hyderabad December 2009 76<br />
38
POTASH INVESTMENT<br />
<br />
<br />
<br />
Most <strong>of</strong> the new potash capacity is represented by expansions<br />
<strong>of</strong> existing facilities, primarily in Canada <strong>and</strong> Russia, although<br />
there is a greenfield project underway in Russia. Some <strong>of</strong> the<br />
expansions are virtually new mines. There is also a new mine in<br />
Brazil. There are also greenfield projects in Argentina <strong>and</strong><br />
Congo.<br />
There has not been a greenfield potash development <strong>for</strong> many<br />
years <strong>and</strong> capital costs are high <strong>and</strong> lead times are lengthy.<br />
Vale’s proposed potash mine in Brazil will have a capital cost <strong>of</strong><br />
over $4 billion <strong>for</strong> a 2.4 million t/y mine.<br />
The need <strong>for</strong> new mines, <strong>and</strong> the high capital cost involved, will<br />
mean that potash prices will not return to the low prices on the<br />
1980s, 1990s <strong>and</strong> early 2000s. Unlike new nitrogen plants in low<br />
cost gas areas which have lower costs than older plants in high<br />
gas cost areas, new potash mines will have total costs<br />
substantially higher than existing mines, which have low capital<br />
costs.<br />
FERTECON /FAI Hyderabad December 2009 77<br />
SULPHUR SUPPLY GROWTH<br />
Sulphur supply growth will exceed dem<strong>and</strong> growth <strong>for</strong><br />
<strong>for</strong>eseeable future<br />
New supply mostly in Middle East <strong>and</strong> Kazakhstan<br />
Supply also increasing in major sulphur consuming<br />
countries such as China <strong>and</strong> India<br />
Sulphur will again become a disposal problem <strong>for</strong><br />
suppliers with negative netbacks to supplies with high<br />
logistics costs<br />
Re-injection <strong>of</strong> sulphur at gas production sites<br />
developing <strong>and</strong> will eventually slow supply growth<br />
FERTECON /FAI Hyderabad December 2009 78<br />
39
SULPHUR SUPPLY<br />
70<br />
million tonnes<br />
60<br />
50<br />
40<br />
30<br />
20<br />
10<br />
0<br />
2008 2009 2010 2011 2012 2013<br />
FERTECON /FAI Hyderabad December 2009 79<br />
PRICE OUTLOOK<br />
Adequate supply will moderate price<br />
upside<br />
40
UREA PRICES – MEDIUM TERM<br />
600<br />
US$/tonne fob<br />
Urea - $/t fob bulk Black Sea<br />
400<br />
Increased supply leads to price moderation<br />
200<br />
0<br />
2007 2008 2009 2010 2011 2012 2013 2014 2015<br />
FERTECON /FAI Hyderabad December 2009 81<br />
PHOSPHATE PRICES<br />
1000<br />
US$/tonne fob<br />
800<br />
DAP - $/t fob bulk US Gulf<br />
600<br />
400<br />
200<br />
upside risk if Ma'aden delayed to<br />
2012-3<br />
Impact <strong>of</strong> Ma'aden keeps<br />
prices moderate<br />
0<br />
2006 2007 2008 2009 2010 2011 2012 2013 2014 2015<br />
FERTECON /FAI Hyderabad December 2009 82<br />
41
POTASH PRICES<br />
800<br />
US$/tonne fob<br />
POTASH - $/t fob bulk Vancouver<br />
600<br />
400<br />
Downside rish still exists in short term<br />
200<br />
0<br />
2007 2008 2009 2010 2011 2012 2013 2014 2015<br />
FERTECON /FAI Hyderabad December 2009 83<br />
SULPHUR PRICES – MEDIUM<br />
TERM<br />
600<br />
US$/t<br />
500<br />
400<br />
300<br />
200<br />
Middle East spot<br />
100<br />
0<br />
2006 2007 2008 2009 2010 2011 2012 2013 2014 2015<br />
FERTECON /FAI Hyderabad December 2009 84<br />
42
CONCLUSIONS<br />
Moderate prices expected in medium<br />
term. High price levels <strong>of</strong> 2008 unlikely to<br />
be repeated<br />
CONCLUSIONS - DEMAND<br />
Fertilizer dem<strong>and</strong> is now starting to recover, <strong>and</strong> this<br />
will gather pace in 2010<br />
Crop prices are improving<br />
Low fertilizer application - particularly <strong>of</strong> P <strong>and</strong> K –<br />
will need to be corrected in 2010 <strong>and</strong> 2011 if yields<br />
are not to fall<br />
Subsistence agriculture was severely challenged in<br />
2008 <strong>and</strong> will need subsidies <strong>and</strong>/or aid finance <strong>for</strong><br />
fertilizers to avoid a drop in yields<br />
Medium term, fundamentals <strong>of</strong> increasing population<br />
<strong>and</strong> improving diets, plus dem<strong>and</strong> <strong>for</strong> bi<strong>of</strong>uels, will<br />
mean a return to strong dem<strong>and</strong> growth<br />
FERTECON /FAI Hyderabad December 2009 86<br />
43
CONCLUSIONS - SUPPLY<br />
<br />
<br />
<br />
<br />
<br />
<br />
Higher costs <strong>of</strong> new plants <strong>for</strong> all products – a new 1 million<br />
tonne/year facility <strong>for</strong> ammonia/ urea, phosphate <strong>and</strong> potash all<br />
cost at least $1 billion<br />
This creates a higher base cost <strong>for</strong> new producers<br />
There have been fundamental changes in the cost <strong>of</strong> natural<br />
gas in the US which suggests the existing US industry will<br />
remain competitive going <strong>for</strong>ward<br />
European gas prices could go the same way – protecting the<br />
industry there.<br />
Gas pricing is becoming more global due to the influence <strong>of</strong><br />
LNG<br />
The cost differential between existing plants in high gas cost<br />
areas <strong>and</strong> new plants in low cost areas has reduced – <strong>and</strong> in<br />
some cases disappeared.<br />
FERTECON /FAI Hyderabad December 2009 87<br />
CONCLUSIONS - PRICE<br />
There has been some recovery <strong>for</strong> nitrogen –<br />
both ammonia <strong>and</strong> urea, but increased<br />
supply limits the upside on prices<br />
Phosphate prices could remain under<br />
downward pressure in the near term but<br />
market fundamentals could strengthen in<br />
2010 until supply increases 2011 onwards<br />
Potash supply/dem<strong>and</strong> balance will correct as<br />
dem<strong>and</strong> recovers, but increased supply will<br />
mean upside on prices is limited.<br />
FERTECON /FAI Hyderabad December 2009 88<br />
44
THE OUTLOOK FOR INDIA<br />
<br />
<br />
<br />
<br />
<br />
<br />
<br />
India has seen substantially lower prices <strong>for</strong> imported ammonia, urea <strong>and</strong><br />
phosphate since August 2008<br />
Ammonia prices have increased, but the upside is limited due to new<br />
supply<br />
Increased supply, particularly from the Middle East should keep urea prices<br />
moderate, <strong>and</strong> we could see some lower prices from 2011.<br />
Potash prices have ended up higher than be<strong>for</strong>e the boom, but additional<br />
supply should mean further increases unlikely in the medium term.<br />
However, the need <strong>for</strong> new investment will increase costs – <strong>and</strong> thus<br />
prices.<br />
India will benefit from low sulphur prices in medium term, although there<br />
could be some short term increases<br />
Phosphate rock <strong>and</strong> phosphoric acid prices have been brought back back<br />
into line with DAP prices. DAP looks weak once Ma’aden in Saudi Arabia<br />
comes in stream in 2011<br />
There is likely to be increased interest from countries with fertilizer raw<br />
material resources – natural gas, phosphate rock <strong>and</strong> potash – <strong>for</strong> joint<br />
ventures with major end users such as India – particularly in finance can be<br />
made available<br />
FERTECON /FAI Hyderabad December 2009 89<br />
A WINDOW OF OPPORTUNITY<br />
India is unlikely to face again the high prices seen in<br />
2008.<br />
These stretched the subsidy budget almost to breaking<br />
point <strong>and</strong> provided the initial stimulus <strong>for</strong> re<strong>for</strong>m.<br />
Although those pressures are now reduced, the<br />
momentum <strong>for</strong> subsidy re<strong>for</strong>m has become<br />
unstoppable.<br />
The more moderate prices expected in the near <strong>and</strong><br />
medium term provide a window <strong>of</strong> opportunity <strong>for</strong> the<br />
industry <strong>and</strong> government to move Indian fertilizers into a<br />
new era <strong>of</strong> sustainable pricing within a structure that<br />
encourages enterprise <strong>and</strong> development whilst<br />
protecting the interests <strong>of</strong> Indian farmers.<br />
FERTECON /FAI Hyderabad December 2009 90<br />
45