A review of the characteristics of nanoparticles in the urban ...
A review of the characteristics of nanoparticles in the urban ...
A review of the characteristics of nanoparticles in the urban ...

You also want an ePaper? Increase the reach of your titles
YUMPU automatically turns print PDFs into web optimized ePapers that Google loves.
2<br />
P. Kumar et al. / Atmospheric Environment xxx (2010) 1e18<br />
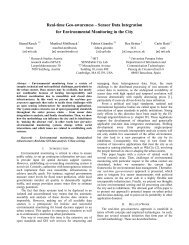
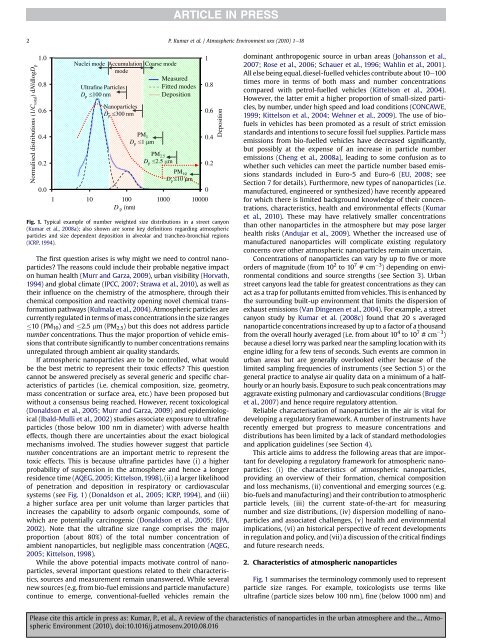
N ormalised distributions (1/ C t ota l ) d N / dlo g D p<br />
1.0<br />
0.8<br />
0.6<br />
0.4<br />
0.2<br />
0.0<br />
Nuclei mode Accumulation Coarse mode<br />
mode<br />
Ultraf<strong>in</strong>e Particles<br />
D p 100 nm<br />
Nanoparticles<br />
D p 300 nm<br />
PM 1<br />
D p 1 m<br />
Measured<br />
Fitted modes<br />
Deposition<br />
PM 2.5<br />
D p 2.5 m<br />
PM 10<br />
D p 10 m<br />
1 10 100 1000 10000<br />
D p (nm)<br />
Fig. 1. Typical example <strong>of</strong> number weighted size distributions <strong>in</strong> a street canyon<br />
(Kumar et al., 2008a); also shown are some key def<strong>in</strong>itions regard<strong>in</strong>g atmospheric<br />
particles and size dependent deposition <strong>in</strong> alveolar and trancheo-bronchial regions<br />
(ICRP, 1994).<br />
The first question arises is why might we need to control <strong>nanoparticles</strong>?<br />
The reasons could <strong>in</strong>clude <strong>the</strong>ir probable negative impact<br />
on human health (Murr and Garza, 2009), <strong>urban</strong> visibility (Horvath,<br />
1994) and global climate (IPCC, 2007; Strawa et al., 2010), as well as<br />
<strong>the</strong>ir <strong>in</strong>fluence on <strong>the</strong> chemistry <strong>of</strong> <strong>the</strong> atmosphere, through <strong>the</strong>ir<br />
chemical composition and reactivity open<strong>in</strong>g novel chemical transformation<br />
pathways (Kulmala et al., 2004). Atmospheric particles are<br />
currently regulated <strong>in</strong> terms <strong>of</strong> mass concentrations <strong>in</strong> <strong>the</strong> size ranges<br />
10 (PM 10 )and2.5 mm (PM 2.5 ) but this does not address particle<br />
number concentrations. Thus <strong>the</strong> major proportion <strong>of</strong> vehicle emissions<br />
that contribute significantly to number concentrations rema<strong>in</strong>s<br />
unregulated through ambient air quality standards.<br />
If atmospheric <strong>nanoparticles</strong> are to be controlled, what would<br />
be <strong>the</strong> best metric to represent <strong>the</strong>ir toxic effects? This question<br />
cannot be answered precisely as several generic and specific <strong>characteristics</strong><br />
<strong>of</strong> particles (i.e. chemical composition, size, geometry,<br />
mass concentration or surface area, etc.) have been proposed but<br />
without a consensus be<strong>in</strong>g reached. However, recent toxicological<br />
(Donaldson et al., 2005; Murr and Garza, 2009) and epidemiological<br />
(Ibald-Mulli et al., 2002) studies associate exposure to ultraf<strong>in</strong>e<br />
particles (those below 100 nm <strong>in</strong> diameter) with adverse health<br />
effects, though <strong>the</strong>re are uncerta<strong>in</strong>ties about <strong>the</strong> exact biological<br />
mechanisms <strong>in</strong>volved. The studies however suggest that particle<br />
number concentrations are an important metric to represent <strong>the</strong><br />
toxic effects. This is because ultraf<strong>in</strong>e particles have (i) a higher<br />
probability <strong>of</strong> suspension <strong>in</strong> <strong>the</strong> atmosphere and hence a longer<br />
residence time (AQEG, 2005; Kittelson, 1998), (ii) a larger likelihood<br />
<strong>of</strong> penetration and deposition <strong>in</strong> respiratory or cardiovascular<br />
systems (see Fig. 1) (Donaldson et al., 2005; ICRP, 1994), and (iii)<br />
a higher surface area per unit volume than larger particles that<br />
<strong>in</strong>creases <strong>the</strong> capability to adsorb organic compounds, some <strong>of</strong><br />
which are potentially carc<strong>in</strong>ogenic (Donaldson et al., 2005; EPA,<br />
2002). Note that <strong>the</strong> ultraf<strong>in</strong>e size range comprises <strong>the</strong> major<br />
proportion (about 80%) <strong>of</strong> <strong>the</strong> total number concentration <strong>of</strong><br />
ambient <strong>nanoparticles</strong>, but negligible mass concentration (AQEG,<br />
2005; Kittelson, 1998).<br />
While <strong>the</strong> above potential impacts motivate control <strong>of</strong> <strong>nanoparticles</strong>,<br />
several important questions related to <strong>the</strong>ir <strong>characteristics</strong>,<br />
sources and measurement rema<strong>in</strong> unanswered. While several<br />
new sources (e.g. from bio-fuel emissions and particle manufacture)<br />
cont<strong>in</strong>ue to emerge, conventional-fuelled vehicles rema<strong>in</strong> <strong>the</strong><br />
1<br />
0.8<br />
0.6<br />
0.4<br />
0.2<br />
0<br />
D epositio n<br />
dom<strong>in</strong>ant anthropogenic source <strong>in</strong> <strong>urban</strong> areas (Johansson et al.,<br />
2007; Rose et al., 2006; Schauer et al., 1996; Wahl<strong>in</strong> et al., 2001).<br />
All else be<strong>in</strong>g equal, diesel-fuelled vehicles contribute about 10e100<br />
times more <strong>in</strong> terms <strong>of</strong> both mass and number concentrations<br />
compared with petrol-fuelled vehicles (Kittelson et al., 2004).<br />
However, <strong>the</strong> latter emit a higher proportion <strong>of</strong> small-sized particles,<br />
by number, under high speed and load conditions (CONCAWE,<br />
1999; Kittelson et al., 2004; Wehner et al., 2009). The use <strong>of</strong> bi<strong>of</strong>uels<br />
<strong>in</strong> vehicles has been promoted as a result <strong>of</strong> strict emission<br />
standards and <strong>in</strong>tentions to secure fossil fuel supplies. Particle mass<br />
emissions from bio-fuelled vehicles have decreased significantly,<br />
but possibly at <strong>the</strong> expense <strong>of</strong> an <strong>in</strong>crease <strong>in</strong> particle number<br />
emissions (Cheng et al., 2008a), lead<strong>in</strong>g to some confusion as to<br />
whe<strong>the</strong>r such vehicles can meet <strong>the</strong> particle number based emissions<br />
standards <strong>in</strong>cluded <strong>in</strong> Euro-5 and Euro-6 (EU, 2008; see<br />
Section 7 for details). Fur<strong>the</strong>rmore, new types <strong>of</strong> <strong>nanoparticles</strong> (i.e.<br />
manufactured, eng<strong>in</strong>eered or syn<strong>the</strong>sized) have recently appeared<br />
for which <strong>the</strong>re is limited background knowledge <strong>of</strong> <strong>the</strong>ir concentrations,<br />
<strong>characteristics</strong>, health and environmental effects (Kumar<br />
et al., 2010). These may have relatively smaller concentrations<br />
than o<strong>the</strong>r <strong>nanoparticles</strong> <strong>in</strong> <strong>the</strong> atmosphere but may pose larger<br />
health risks (Andujar et al., 2009). Whe<strong>the</strong>r <strong>the</strong> <strong>in</strong>creased use <strong>of</strong><br />
manufactured <strong>nanoparticles</strong> will complicate exist<strong>in</strong>g regulatory<br />
concerns over o<strong>the</strong>r atmospheric <strong>nanoparticles</strong> rema<strong>in</strong> uncerta<strong>in</strong>.<br />
Concentrations <strong>of</strong> <strong>nanoparticles</strong> can vary by up to five or more<br />
orders <strong>of</strong> magnitude (from 10 2 to 10 7 #cm 3 ) depend<strong>in</strong>g on environmental<br />
conditions and source strengths (see Section 3). Urban<br />
street canyons lead <strong>the</strong> table for greatest concentrations as <strong>the</strong>y can<br />
act as a trap for pollutants emitted from vehicles. This is enhanced by<br />
<strong>the</strong> surround<strong>in</strong>g built-up environment that limits <strong>the</strong> dispersion <strong>of</strong><br />
exhaust emissions (Van D<strong>in</strong>genen et al., 2004). For example, a street<br />
canyon study by Kumar et al. (2008c) found that 20 s averaged<br />
nanoparticle concentrations <strong>in</strong>creased by up to a factor <strong>of</strong> a thousand<br />
from <strong>the</strong> overall hourly averaged (i.e. from about 10 4 to 10 7 #cm 3 )<br />
because a diesel lorry was parked near <strong>the</strong> sampl<strong>in</strong>g location with its<br />
eng<strong>in</strong>e idl<strong>in</strong>g for a few tens <strong>of</strong> seconds. Such events are common <strong>in</strong><br />
<strong>urban</strong> areas but are generally overlooked ei<strong>the</strong>r because <strong>of</strong> <strong>the</strong><br />
limited sampl<strong>in</strong>g frequencies <strong>of</strong> <strong>in</strong>struments (see Section 5) or<strong>the</strong><br />
general practice to analyse air quality data on a m<strong>in</strong>imum <strong>of</strong> a halfhourly<br />
or an hourly basis. Exposure to such peak concentrations may<br />
aggravate exist<strong>in</strong>g pulmonary and cardiovascular conditions (Brugge<br />
et al., 2007) and hence require regulatory attention.<br />
Reliable characterisation <strong>of</strong> <strong>nanoparticles</strong> <strong>in</strong> <strong>the</strong> air is vital for<br />
develop<strong>in</strong>g a regulatory framework. A number <strong>of</strong> <strong>in</strong>struments have<br />
recently emerged but progress to measure concentrations and<br />
distributions has been limited by a lack <strong>of</strong> standard methodologies<br />
and application guidel<strong>in</strong>es (see Section 4).<br />
This article aims to address <strong>the</strong> follow<strong>in</strong>g areas that are important<br />
for develop<strong>in</strong>g a regulatory framework for atmospheric <strong>nanoparticles</strong>:<br />
(i) <strong>the</strong> <strong>characteristics</strong> <strong>of</strong> atmospheric <strong>nanoparticles</strong>,<br />
provid<strong>in</strong>g an overview <strong>of</strong> <strong>the</strong>ir formation, chemical composition<br />
and loss mechanisms, (ii) conventional and emerg<strong>in</strong>g sources (e.g.<br />
bio-fuels and manufactur<strong>in</strong>g) and <strong>the</strong>ir contribution to atmospheric<br />
particle levels, (iii) <strong>the</strong> current state-<strong>of</strong>-<strong>the</strong>-art for measur<strong>in</strong>g<br />
number and size distributions, (iv) dispersion modell<strong>in</strong>g <strong>of</strong> <strong>nanoparticles</strong><br />
and associated challenges, (v) health and environmental<br />
implications, (vi) an historical perspective <strong>of</strong> recent developments<br />
<strong>in</strong> regulation and policy, and (vii) a discussion <strong>of</strong> <strong>the</strong> critical f<strong>in</strong>d<strong>in</strong>gs<br />
and future research needs.<br />
2. Characteristics <strong>of</strong> atmospheric <strong>nanoparticles</strong><br />
Fig. 1 summarises <strong>the</strong> term<strong>in</strong>ology commonly used to represent<br />
particle size ranges. For example, toxicologists use terms like<br />
ultraf<strong>in</strong>e (particle sizes below 100 nm), f<strong>in</strong>e (below 1000 nm) and<br />
Please cite this article <strong>in</strong> press as: Kumar, P., et al., A <strong>review</strong> <strong>of</strong> <strong>the</strong> <strong>characteristics</strong> <strong>of</strong> <strong>nanoparticles</strong> <strong>in</strong> <strong>the</strong> <strong>urban</strong> atmosphere and <strong>the</strong>..., Atmospheric<br />
Environment (2010), doi:10.1016/j.atmosenv.2010.08.016