Today - MIT SENSEable City Lab
Today - MIT SENSEable City Lab
Today - MIT SENSEable City Lab

You also want an ePaper? Increase the reach of your titles
YUMPU automatically turns print PDFs into web optimized ePapers that Google loves.
This paper might be a pre-copy-editing or a post-print author-produced .pdf of an article accepted for publication. For the<br />
definitive publisher-authenticated version, please refer directly to publishing house’s archive system.
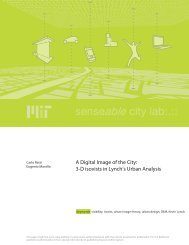
U s e r - G e n e r a t e d C o n t e n t<br />
Digital Footprinting:<br />
Uncovering Tourists<br />
with User-Generated Content<br />
Novel methods and tools are being developed to explore the significance<br />
of new types of user-related spatiotemporal data. The approach<br />
described here helps uncover the presence and movements of tourists<br />
from cell phone network data and the georeferenced photos they<br />
generate.<br />
Fabien Girardin and Josep Blat<br />
Universitat Pompeu Fabra<br />
Francesco Calabrese,<br />
Filippo Dal Fiore, and Carlo Ratti<br />
Massachusetts Institute<br />
of Technology<br />
<strong>Today</strong>, it’s possible to gather every<br />
click of every move of every user<br />
who interacts with any software<br />
in a database and submit<br />
it to a second-degree data mining<br />
operation. Along with the growing ubiquity<br />
of mobile technologies, the logs produced<br />
have helped researchers create and define new<br />
methods of observing, recording, and analyzing<br />
a city and its human<br />
dynamics. 1 In effect, these<br />
personal devices create a vast,<br />
geographically aware sensor<br />
web 2 that accumulates tracks<br />
to reveal both individual and<br />
social behaviors with unprecedented<br />
detail. 3 The low cost<br />
and high availability of these<br />
digital footprints will challenge<br />
the social sciences, which have never<br />
before had access to the volumes of data used<br />
in the natural sciences, 4 but the benefits to fields<br />
that require an in-depth understanding of large<br />
group behavior could be equally great.<br />
Accordingly, this article illustrates the potential<br />
of user-generated electronic trails to remotely<br />
reveal the presence and movement of a<br />
city’s visitors. (This research was led at the Massachusetts<br />
of Technology, in collaboration with<br />
Universitat Pompeu Fabra.) We anticipate that<br />
validating these trails with respect to existing<br />
surveys might lead to an improved understanding<br />
of several aspects of urban mobility and<br />
travel. We therefore present several novel datacollection<br />
techniques, analytical methods, and<br />
visualization tools that we’ve been developing to<br />
uncover urban dynamics. Although the nature<br />
of digital footprints renders the information derived<br />
both more credible and reliable, we must<br />
further consider how to validate this pervasively<br />
user-generated content.<br />
In a previous work, we showed that explicitly<br />
disclosed spatiotemporal data from open platforms<br />
provide novel insights on visitor dynamics<br />
in an urban space. 5 Understanding population<br />
dynamics by type, neighborhood, or region<br />
would enable customized services (and advertising)<br />
as well as the accurate timing of urban<br />
service provisions, such as scheduling monument<br />
opening times based on daily, weekly, or<br />
monthly tourist demand. In general, more synchronous<br />
management of service infrastructures<br />
clearly could play an important role in tourism<br />
management.<br />
Working with Digital Footprints<br />
A city’s visitors have many ways of leaving voluntary<br />
or involuntary electronic trails: prior to<br />
their visits, tourists generate server log entries<br />
when they consult digital maps 6 or travel Web<br />
sites; 7 during their visit, they leave traces on<br />
wireless networks whenever they use their mo-<br />
36 PERVASIVE computing Published by the IEEE CS n 1536-1268/08/$25.00 © 2008 IEEE<br />
Authorized licensed use limited to: IEEE Xplore. Downloaded on December 4, 2008 at 08:13 from IEEE Xplore. Restrictions apply.
ile phones; 8 and after their visit, they<br />
might add online reviews and photos.<br />
Broadly speaking then, there are two<br />
types of footprint: active and passive.<br />
Passive tracks are left through interaction<br />
with an infrastructure, such as a<br />
mobile phone network, that produces<br />
entries in locational logs; active prints<br />
come from the users themselves when<br />
they expose locational data in photos,<br />
messages, and sensor measurements.<br />
In this article, we consider two types<br />
of digital traces from Rome, Italy: georeferenced<br />
photos made publicly available<br />
on the photo-sharing Web site<br />
Flickr and aggregate records of wireless<br />
network events generated by mobile<br />
phone users making calls and sending<br />
text messages on the Telecom Italia<br />
Mobile (TIM) system.<br />
Explicit Footprints<br />
People using the Flickr service to share<br />
and organize photos also have the option<br />
to add geographical attributes. Each<br />
time a photo is anchored to a physical location,<br />
Flickr assigns longitude and latitude<br />
values together with an accuracy<br />
attribute derived from the zoom level of<br />
the map in use to position the photos.<br />
So photos positioned on a map when the<br />
user zooms in at the street level receive a<br />
higher accuracy estimate than ones positioned<br />
when the user pulls back in the<br />
online map view. The system also adds<br />
metadata embedded by the camera into<br />
the image using exchangeable image file<br />
(EXIF) format information, completing<br />
the spatiotemporal data.<br />
Flickr provides a public API that enables<br />
anyone to query its public data<br />
store for photos. We elected to analyze<br />
three years of data, from November<br />
2004 to November 2007, for Rome<br />
because it’s a popular and highly photographed<br />
tourist destination. For that<br />
three-year period, we were able to extract<br />
144,501 georeferenced photos that<br />
6,019 different users had uploaded. For<br />
each of these publicly available photos,<br />
we retrieved the geographical coordinates,<br />
time stamp, accuracy level, and<br />
the owner’s obfuscated identifier.<br />
Because we were particularly interested<br />
in the behavior of tourists in<br />
Rome, we separated the photographers<br />
into two groups based on their presence<br />
in the city over time. Discriminating<br />
between locals and visitors required<br />
dividing the study period into 30-day<br />
blocks. If the photographers took all<br />
their photos within a period of 30 days,<br />
the algorithm labeled them as visitors,<br />
but if they uploaded photographs at<br />
intervals of more than 30 days, then it<br />
categorized them as residents. From our<br />
population of 6,019 photographers, we<br />
classed 4,719 as one-time visitors.<br />
To find out more about the nature<br />
of our photographers, we took advantage<br />
of a social function in Flickr that<br />
invites users to voluntarily provide additional<br />
information about themselves<br />
such as their city and country of residence.<br />
In some cases, because of spelling<br />
errors or user idiosyncrasies (such<br />
as using “The Big Apple” to mean New<br />
York <strong>City</strong>), we were forced to manually<br />
process the city or country information.<br />
However, after cleaning, we<br />
found that 59 percent of the users had<br />
disclosed meaningful origin information,<br />
broken into several main populations:<br />
991 Italians, 1,171 other Europeans,<br />
807 North Americans, 104<br />
South Americans, 71 Asians, and 70<br />
Australians and New Zealanders.<br />
Implicit Footprints<br />
Previous research has shown that<br />
the diffusion of mobile phones and<br />
the widespread coverage of mobile<br />
phone wireless networks in urban areas<br />
make these technologies interesting<br />
means to identify and track both<br />
groups and individuals. 9,10 Our collaboration<br />
with TIM took advantage<br />
of new a system called Lochness (Localizing<br />
and Handling Network Event<br />
Systems), which is a software platform<br />
that localizes and stores usergenerated<br />
events as they occur on the<br />
mobile network. Calls in progress,<br />
short message service (SMS) transmissions,<br />
and call handovers are all captured<br />
through external probes that localize<br />
and collate incoming messages<br />
before transmitting the results to Lochness.<br />
The messages are then aggregated<br />
to produce raster-format maps of the<br />
users’ distribution. (A detailed introduction<br />
to the platform is available<br />
elsewhere. 11 )<br />
TIM installed the Lochness platform<br />
and related probes on a set of<br />
base station controllers (BSCs) located<br />
in the city’s northeast quadrant,<br />
covering an area of approximately<br />
100 km 2 . The system can reliably localize<br />
users to within an area of 250<br />
by 250 m 2 before assigning them to<br />
the corresponding grid reference.<br />
Lochness divided the users into two<br />
Mapping and visualization<br />
are critical first steps to interpreting<br />
and explaining digital footprints.<br />
groups (Italians and foreigners) based<br />
on the country code information embedded<br />
in their international mobile<br />
subscriber identity (IMSI) number.<br />
Over a period of three months, timed<br />
to coincide with the Venice Biennale<br />
from September to November 2006,<br />
the system calculated these attributes<br />
every five minutes and transmitted the<br />
results to servers at the Massachusetts<br />
Institute of Technology (<strong>MIT</strong>).<br />
Processing and Visualization<br />
Jo Woo and his colleagues suggest that<br />
the large volumes of data coming from<br />
these types of sources can only be interpreted<br />
through geovisualization, 12<br />
which is to say that after collection,<br />
mapping and visualization are critical<br />
to interpreting and explaining user<br />
October–December 2008 PERVASIVE computing 37<br />
Authorized licensed use limited to: IEEE Xplore. Downloaded on December 4, 2008 at 08:13 from IEEE Xplore. Restrictions apply.
User-Generated Content<br />
Figure 1. Geovisualizations of<br />
the presence of (a) 932 tourist<br />
photographers and (b) 520,000 phone<br />
calls from foreign mobile phones in the<br />
Colosseum and Piazza della Repubblica<br />
area from September to November<br />
2006. Both types of data cover the train<br />
station area in the proximity of the<br />
Piazza della Republica. The values<br />
in each cell are normalized.<br />
(a)<br />
behaviors. We elected to use Google<br />
Earth to support visual synthesis and<br />
our preliminary investigation of digital<br />
traces. Accordingly, we stored data<br />
collected by the Lochness platform and<br />
the Flickr service on a MySQL server,<br />
enabling us to flexibly query and aggregate<br />
the data further as required.<br />
Using software developed in house, we<br />
then exported the aggregate results in a<br />
format compatible with Google Earth<br />
for interactive visual exploration. Precise<br />
digital satellite imagery from Telespazio,<br />
which is a company providing<br />
satellite services, was added as image<br />
overlay. Applying these techniques and<br />
tools to process digital footprints lets us<br />
uncover the presence of crowds and the<br />
patterns of movement over time as well<br />
as compare user behaviors to generate<br />
new hypotheses.<br />
Analyzing Digital Footprints<br />
We used user-originated digital footprints<br />
to uncover some new aspects of<br />
the presence and movement of tourists<br />
during their visit to Rome. Specifically,<br />
we used spatial and temporal presence<br />
data to visualize user-generated<br />
information.<br />
Spatial Presence<br />
To map users’ spatial distribution, we<br />
store data in a matrix covering the entire<br />
study area. Each cell in the matrix<br />
includes data about the number of photos<br />
taken, the number of photographers<br />
(b)<br />
present, and the number of phone calls<br />
made by foreigners over a given period<br />
of time. The geovisualization in Figure<br />
1 reveals the main areas of tourist activity<br />
in part of central Rome over the<br />
three-month period of September to<br />
November 2006.<br />
Figure 1a shows the presence of photographers,<br />
and Figure 1b depicts the<br />
areas of heavy mobile phone usage by<br />
foreigners. The union between visiting<br />
photographers and foreign mobile phone<br />
customers quickly uncovers the area’s<br />
major visitor attractions such as the Colosseum<br />
and the main train station next<br />
to Piazza della Repubblica. It appears<br />
that the Colosseum attracts sightseeing<br />
photographers whereas foreign mobile<br />
phone users, typically on the move, tend<br />
to be active around the train station.<br />
Temporal Presence<br />
Turning to the temporal patterns obtained<br />
from the digital traces, we compared<br />
the number of photographers<br />
and the volume of phone activity for<br />
each day over the three-month study<br />
period. Figure 2 shows the difference<br />
between the average weekly distribution<br />
of phone calls made by visitors and<br />
the presence of visiting photographers<br />
in the areas around the Colosseum and<br />
Piazza della Repubblica. The histograms<br />
show the normalized variation<br />
between the average number of calls<br />
and photographs for each day and the<br />
average amount for the whole week.<br />
The resulting temporal signatures<br />
for the Colosseum area show related<br />
trends for both data sets, with higher<br />
activity over the weekend than on<br />
weekdays. However, the Piazza della<br />
Repubblica area reveals a markedly<br />
different pattern: photographers,<br />
though fewer in number than at the<br />
Colosseum, also tend to be active on<br />
the weekend, whereas the foreign mobile<br />
phone users are much more active<br />
during the weekdays.<br />
These temporal signatures provide<br />
further evidence to the different types<br />
of presence that occur at the tourist<br />
points of interest. We can further hypothesize<br />
that the Colosseum attracts<br />
sightseeing activities (photographers)<br />
over the weekend and the train station<br />
neighborhood provides facilities for<br />
visitors on the move (such as people on<br />
business trips) during the weekdays.<br />
Desire Lines from Digital Traces<br />
The study of digital footprints also<br />
lets us uncover the digital desire lines,<br />
which embody people’s paths through<br />
the city. Based on the time stamp and<br />
location of photos, our software organizes<br />
the images chronologically to<br />
reconstruct the photographers’ movement.<br />
More precisely, we start by revealing<br />
the most active areas obtained<br />
by spatial data clustering. Next, we<br />
aggregate these individual paths to<br />
generate desire lines that capture the<br />
sequential preferences of visitors. We<br />
check the location of each user activity<br />
(photo) to see if it’s contained in a<br />
cluster and, in the case of a match, add<br />
the point to the trace generated by the<br />
38 PERVASIVE computing www.computer.org/pervasive<br />
Authorized licensed use limited to: IEEE Xplore. Downloaded on December 4, 2008 at 08:13 from IEEE Xplore. Restrictions apply.
1.0<br />
0.5<br />
0<br />
(a)<br />
Colosseum<br />
–0.5<br />
Call<br />
Photographers<br />
–1.0<br />
Monday Tuesday Wednesday Thursday Friday Saturday Sunday<br />
Average photographers per day: 331. Standard deviation: 49.5<br />
Average phone call per day: 620.47. Standard deviation: 99.65<br />
1.0<br />
0.5<br />
0<br />
–0.5<br />
Call<br />
Photographers<br />
(b)<br />
Train station<br />
–1.0 Monday Tuesday Wednesday Thursday Friday Saturday Sunday<br />
Average photographers per day: 10.85. Standard deviation: 3.43<br />
Average phone call per day: 1,165.35. Standard deviation: 198.43<br />
Figure 2. Comparison of the temporal signature of foreigners’ phone activity and number of tourist photographers. It reveals<br />
patterns of below-average activity on weekdays and a rise of presence over the weekend at (a) the Colosseum. In contrast, (b)<br />
the train station’s temporal signature shows a higher presence of foreigners calling from their mobile phones during the week,<br />
whereas photographers indicate a reverse pattern and increased presence over the weekend.<br />
photo’s owner. This process produces<br />
multiple directed graphs that support<br />
better quantitative analysis, which<br />
gives us the number of sites visited by<br />
season, the most visited and photographed<br />
points of interests, and data<br />
on where photographers start and end<br />
their journeys.<br />
Formatting this data according to<br />
the open Keyhole Markup Language<br />
standard lets us import it into Google<br />
Earth to explore the traveling behaviors<br />
of specific types of visitors. The resulting<br />
visualization in Figure 3 suggests<br />
the main points of interest in the city as<br />
a whole. Building asymmetric matrices<br />
of the number of photographers who<br />
moved from point of interest x to point<br />
of interest y reveals the predominant sequence<br />
of site visits. We can also base<br />
queries on the users’ nationalities, the<br />
number of days of activity in the city,<br />
the number of photos taken, and areas<br />
visited during a trip.<br />
Semantic Description<br />
Previous work has demonstrated that<br />
we can use spatially and temporally annotated<br />
material available on the Web<br />
to extract place- and event-related semantic<br />
information. 13 In a similar vein,<br />
we analyzed the tags associated with the<br />
user-originating photos to reveal clues<br />
of people’s perception of their environment<br />
and the semantics of their perspective<br />
of urban space. For instance,<br />
the word “ruins” is one of the mostused<br />
tags to describe photos in Rome.<br />
Mapping the distribution of this tag for<br />
2,866 photos uncovers the most ancient<br />
and “decayed” part of the city: the Colosseum<br />
and the Forum (Figure 4).<br />
October–December 2008 PERVASIVE computing 39<br />
Authorized licensed use limited to: IEEE Xplore. Downloaded on December 4, 2008 at 08:13 from IEEE Xplore. Restrictions apply.
User-Generated Content<br />
Figure 3. Geovisualiation of the main<br />
paths taken by photographers between<br />
points of interests in Rome. Significantly,<br />
(a) the 753 visiting Italian photographers<br />
are active across many areas of the city,<br />
whereas (b) the 675 American visitors stay<br />
on a narrow path between the Vatican,<br />
Forum, and Colosseum. (Different scales<br />
apply to each geovisualization.)<br />
(a)<br />
(b)<br />
Figure 4. Geovisualization of the areas defined by the position of the 2,886 photos<br />
with the tag “ruins” as uploaded by 260 photographers. It reveals the Colosseum<br />
and Forum areas known for their multitude of ancient ruins.<br />
footprints to reveal patterns of mobility<br />
and preference among different visitor<br />
groups. However, in the context of our<br />
study, traditional methods would help<br />
us better define the usefulness of pervasive<br />
user-generated content. For example,<br />
hotel occupancy and museum surveys<br />
would let us observe and quantify<br />
visitors’ presence and movement. Along<br />
this vein, the Rome tourism office supplied<br />
us with monthly ticket receipts for<br />
the Colosseum in 2006.<br />
Figure 5 compares sales figures with<br />
mobile usage and photographic activity.<br />
Ticket receipts show that there are<br />
slightly more Colosseum visitors in<br />
October than September, with a major<br />
drop in attendance in November.<br />
This pattern matches the activity of<br />
foreign-registered mobile phones in<br />
the area, but it doesn’t coincide with<br />
photographer activity. These discrepancies<br />
likely exist because the data sets<br />
are capturing the activity of different<br />
sets of visitors. For example, correlation<br />
with ticket sales from the Colosseum<br />
fails to account for the fact that<br />
users can easily photograph the arena<br />
or make a call from the vicinity of the<br />
monument without bothering to pay<br />
the entry fee. Due to the large difference<br />
in the nature of the activity producing<br />
the data, it might be that correlating<br />
it with user-generated content<br />
doesn’t reinforce existing tourism and<br />
travel knowledge but does reveal new<br />
dimensions of behavior.<br />
Significance<br />
of User-Generated Data<br />
These aggregate spatiotemporal records<br />
seem to lead to an improved understanding<br />
of different aspects of mobility<br />
and travel. Although the results are still<br />
fairly coarse, we’ve shown the potential<br />
for geographically referenced digital<br />
Challenges<br />
of User-Generated Data Sets<br />
Our data-processing techniques have<br />
tried to account for the fluctuating<br />
40 PERVASIVE computing www.computer.org/pervasive<br />
Authorized licensed use limited to: IEEE Xplore. Downloaded on December 4, 2008 at 08:13 from IEEE Xplore. Restrictions apply.
2.0<br />
1.5<br />
1.0<br />
0.5<br />
0<br />
–0.5<br />
–1.0<br />
–1.5<br />
–2.0<br />
January<br />
Photographers<br />
Tickets sold<br />
Calls<br />
February March April May June July August September October November<br />
Average photographers per month: 95.27. Standard deviation: 24.48<br />
Average phone call per day: 351,499. Standard deviation: 107,734<br />
Average phone calls per month (September–November): 17,074. Standard deviation: 5,793<br />
Figure 5. Comparison of visitors to the Colosseum area between January and November 2006 using the number of tickets sold,<br />
number of calls made, and number of photographers active in the zone. The values represent the variations from the monthly<br />
average, scaled by the standard deviation.<br />
quality of user-generated data, which<br />
can substantially impede our ability to<br />
generate accurate information. For instance,<br />
the time stamps extracted from<br />
the camera-generated EXIF metadata<br />
don’t necessarily match the real time<br />
at which a photo was taken; the user<br />
must take the time to set the camera’s<br />
clock and then adjust it to the local<br />
time. User-generated data points can<br />
also be idiosyncratic and, for instance,<br />
indicate not the point where the photo<br />
was taken but the location of the photographed<br />
object.<br />
Including mobile phone data introduces<br />
challenging scale issues because<br />
cell phone and photo data sets resolutions<br />
vary substantially. Challenges<br />
also arise from the fact that only phone<br />
activity handled by a subset of BSCs in<br />
Rome were monitored, leading to the<br />
risk of border effects, where calls near<br />
the border of a monitored area might<br />
be handled by other BSCs and thus not<br />
counted by the Lochness platform. This<br />
last consideration applies in particular<br />
to areas to the southwest of the Colosseum<br />
(see Figure 1).<br />
We can also expect the use of photograph<br />
and mobile data to raise privacy<br />
and ethical concerns related to collecting<br />
data without the individual’s consent.<br />
However, our approach addresses<br />
these concerns on two levels. First, our<br />
photography data set includes only information<br />
that users explicitly disclose<br />
on an open platform. Second, we aggregate<br />
the cell phone data in a way that<br />
removes all traces of the individual.<br />
On the Flickr service, users have direct<br />
control over who can access their locational<br />
data, but we supplemented this<br />
by applying an obfuscation algorithm<br />
to erase the relationship with individuals’<br />
Web identity and their digital trails.<br />
Thus, we could only analyze anonymous<br />
records of information they already<br />
publicly disclosed.<br />
Collecting and analyzing aggregate<br />
network usage data fully complies with<br />
the 2002 Directive of the European<br />
Parliament and Council on privacy.<br />
Data was only reported to us in aggregate,<br />
so we received no data about an<br />
individual’s identity or trajectory. In<br />
effect, we could only count the total<br />
number of people—either Italian or<br />
October–December 2008 PERVASIVE computing 41<br />
Authorized licensed use limited to: IEEE Xplore. Downloaded on December 4, 2008 at 08:13 from IEEE Xplore. Restrictions apply.
User-Generated Content<br />
foreign—who used a mobile phone at<br />
a given point in the city and at a given<br />
moment. We couldn’t identify individual<br />
users in any way based on the data<br />
that we collected and analyzed, and,<br />
consequently, we avoided the significant<br />
privacy issues that other methodologies<br />
have raised. 10<br />
From a methodological perspective,<br />
the data we analyzed<br />
in this article has a clear advantage<br />
over more traditional<br />
location data obtained through controlled<br />
studies in which subjects carried<br />
sensors and were thus aware of<br />
being tracked. Although we couldn’t<br />
determine the sample used, our mobile<br />
phone data covers the usage habits of<br />
more than 1 million people and thus<br />
represents a step-change in the scale of<br />
localizable data-collection efforts.<br />
These collection methods also contain<br />
several important potential advantages<br />
over other pervasive tracking<br />
systems. Solutions that require people<br />
to carry a separate GPS-enabled device<br />
not only remind users that their<br />
movements are being followed—which<br />
might encourage them to pursue highbrow<br />
activities during their visit—but<br />
also generate fatigue effects and don’t<br />
always function well in urban areas<br />
because of signal multipath and urban<br />
canyon obstructions. The alternative<br />
of a distributed, but fixed, web of sensors<br />
entails onerous maintenance and<br />
data-transmission costs. These issues<br />
strongly suggest that the research community<br />
should investigate and evaluate<br />
the use of these new data types as well<br />
as consider approaches that don’t rely<br />
on the deployment of ad hoc and costly<br />
infrastructures.<br />
Our results demonstrate that further<br />
development is required to validate<br />
our observations and gain new<br />
insights into factors such as a space’s<br />
temporal usage-signature, its attractiveness<br />
to different groups of people,<br />
and the degree of similarity to usage of<br />
other spaces.<br />
The explicit character of photo geotagging<br />
and manual disclosure provides<br />
additional dimensions of interest; positioning<br />
a photo on a map isn’t simply<br />
adding information about its location,<br />
it’s an act of communication that embodies<br />
locations, times, and experiences<br />
that individuals consider to be relevant<br />
to themselves and others. There is a real<br />
richness to the intentional weight that<br />
people attach to disclosing their photos,<br />
and the results clearly show that Flickr<br />
users have a tendency to point out the<br />
highlights of their visit while skipping<br />
over their trip’s lowlights.<br />
Still, our analysis and visualization<br />
are meant to complement, not replace,<br />
traditional surveys and other means of<br />
data collection. In the predigital age,<br />
tourism officials could know how many<br />
visitors spent a night in a hotel, but now<br />
we can also use feedback mechanisms<br />
on public Web sites to estimate how<br />
Our analysis and visualization<br />
are meant to complement, not replace,<br />
traditional surveys and data collection.<br />
much they enjoyed their stay. Similarly,<br />
we could know how many tourists visited<br />
a given attraction, but now we can<br />
also infer their experiences by their uploaded<br />
pictures and semantic descriptions.<br />
Direct observation lets us know<br />
the number of tourists in an area, but<br />
through the mobile phone network, we<br />
can know their nationalities.<br />
The shortcomings of single-site ticket<br />
sales as a correlating data set requires us<br />
to pursue alternate strategies for relating<br />
our mobile and photographic data<br />
to real-world activity with traditional<br />
surveys. An additional research avenue<br />
is understanding the circumstances under<br />
which users tag their content at a<br />
street level or when they’re tagged to<br />
a larger region. An initial analysis of<br />
our Flickr data set suggests that the 123<br />
German users tended to provide more<br />
accurate locational information than<br />
their 175 Spanish counterparts.<br />
The results of further analysis might<br />
reveal distinct profiles of georeferencing<br />
and geotagging photos. These profiles<br />
might be based on culture or nationality,<br />
the type of tourist in terms of<br />
their length of stay or familiarity with<br />
the city, their level of technical expertise<br />
or spatial orientation ability, and<br />
the type of task or environment visited.<br />
Other questions we need to consider<br />
relate to the types of situations during<br />
which users are more or less likely<br />
to use their mobile devices for data<br />
generation. Answers to these types of<br />
questions should help us better define<br />
the meaning of the data and further<br />
explore their potential usage in social<br />
sciences and urban studies.<br />
Acknowledgments<br />
We thank Barcelona Media and Telecom Italia for<br />
their support and Telespazio for satellite digital<br />
imagery. Also, we’re indebted to many people at<br />
the Massachusetts Institute of Technology and<br />
the Universitat Pompeu Fabra for providing extremely<br />
stimulating research environments and<br />
for their generous feedback. In particular, thanks<br />
to Assaf Biderman, Liang Liu, Nicolas Nova, Jon<br />
Reades, and Andrea Vaccari for letting us pick<br />
their brains. Of course, any shortcomings are our<br />
sole responsibility.<br />
References<br />
1. E. O’Neill et al., “Instrumenting the <strong>City</strong>:<br />
Developing Methods for Observing and<br />
Understanding the Digital <strong>City</strong>scape,”<br />
Proc. 8th Int’l Conf. Ubiquitous Computing<br />
(Ubicomp 2006), LNCS 4206,<br />
Springer, 2006, pp. 315–332.<br />
2. M.F. Goodchild, “Citizens as Voluntary<br />
Sensors: Spatial Data Infrastructure in the<br />
World of Web 2.0,” Int’l J. Spatial Data<br />
Infrastructures Research, vol. 2, 2007,<br />
pp. 24–32.<br />
42 PERVASIVE computing www.computer.org/pervasive<br />
Authorized licensed use limited to: IEEE Xplore. Downloaded on December 4, 2008 at 08:13 from IEEE Xplore. Restrictions apply.
3. N. Eagle and A.S. Pentland, “Reality<br />
Mining: Sensing Complex Social Systems,”<br />
Personal Ubiquitous Computing,<br />
vol. 10, no. 4, 2006, pp. 255–268.<br />
4. B. Latour, “Beware, Your Imagination<br />
Leaves Digital Traces,” Times Higher Education<br />
Supplement, 6 Apr. 2007; www.<br />
bruno-latour.fr/poparticles/poparticle/<br />
P-129-THES-GB.doc.<br />
5. F. Girardin et al., “Leveraging Explicitly<br />
Disclosed Location Information to Understand<br />
Tourist Dynamics: A Case Study,”<br />
J. Location-Based Services, vol. 2, Mar.<br />
2008, pp. 41–54.<br />
6. D. Fisher, “Hotmap: Looking at Geographic<br />
Attention,” IEEE Trans. Visualization<br />
and Computer Graphics, vol. 13,<br />
no. 6, 2007, pp. 1184–1191.<br />
7. K. Wöber, “Similarities in Information<br />
Search of <strong>City</strong> Break Travelers — A Web<br />
Usage Mining Exercise,” Information and<br />
Communication Technologies in Tourism<br />
2007, Springer Vienna, 2007, pp. 77–86.<br />
8. R. Ahas et al., “Mobile Positioning Data<br />
in Tourism Studies and Monitoring: Case<br />
Study in Tartu, Estonia,” Information<br />
and Communication Technologies in<br />
Tourism 2007, Springer Vienna, 2007.<br />
9. C. Ratti et al., “Mobile Landscapes:<br />
Using Location Data from Cell-Phones for<br />
Urban Analysis,” Environment and Planning<br />
B: Planning and Design, vol. 33, no.<br />
5, 2006, pp. 727–748.<br />
10. M. González, C. Hidalgo, and A Barabási,<br />
“Understanding Individual Human<br />
Mobility Patterns,” Nature, vol. 453,<br />
2008, pp.779–782<br />
11. F. Calabrese and C. Ratti, “Real Time<br />
Rome,” Networks and Communication<br />
Studies, vol. 20, nos. 3–4, 2006, pp.<br />
247–258.<br />
12. J. Woo et al., “Interactive Visual Exploration<br />
of a Large Spatio-Temporal Dataset:<br />
Reflections on a Geovisualization<br />
Mashup,” IEEE Trans. Visualization and<br />
Computer Graphics, vol. 13, no. 6, 2007,<br />
pp. 1176–1183.<br />
13. T. Rattenbury, N. Good, and M. Naaman,<br />
“Towards Automatic Extraction of Event<br />
and Place Semantics from Flickr Tags,”<br />
Proc. 30th Ann. Int’l ACM SIGIR Conf.<br />
Research and Development in Information<br />
Retrieval (SIGIR 07), ACM Press,<br />
2007, pp. 103–110.<br />
the AUTHoRS<br />
Fabien Girardin is a PhD student in computer sciences and digital communication<br />
at the Universitat Pompeu Fabra, Spain, and a visiting PhD student at<br />
the massachusetts Institute of technology’s <strong>SENSEable</strong> city <strong>Lab</strong>oratory. He is<br />
also a cofounding partner of Simpliquity, a user experience consultancy in the<br />
domain of emerging technologies. His research interests include integrating<br />
ubiquitous technologies in the everyday urban environments. Girardin has a<br />
mPhil in computer science and digital communication from the Universitat<br />
Pompeu Fabra. contact him at fabien.girardin@upf.edu<br />
Francesco Calabrese is a postdoctoral associate at the massachusetts Institute<br />
of technology’s <strong>SENSEable</strong> city <strong>Lab</strong>oratory. His research interests include<br />
ubiquitous computing; analysis of urban dynamics through sensor networks;<br />
analysis and design of distributed, hybrid, embedded control systems; and<br />
cNc machines. calabrese has a PhD in computer engineering from the University<br />
of Naples Federico II, Italy. He is a member of the IEEE and the IEEE<br />
control Systems Society. contact him at fcalabre@mit.edu.<br />
Filippo Dal Fiore is a researcher affiliated with the massachusetts Institute<br />
of technology’s <strong>SENSEable</strong> city <strong>Lab</strong>oratory and the Austrian Academy of<br />
Science, and a PhD candidate in applied economics at the Vrije Universiteit<br />
Amsterdam. His research interests include the behavioral implications of information<br />
and mobile technologies, encompassing topics in different disciplines,<br />
from mobility and transportation to education and innovation. contact him at<br />
dalfiore@mit.edu.<br />
Carlo Ratti is an associate professor of the practice of urban technologies at<br />
the massachusetts Institute of technology, where he directs the <strong>SENSEable</strong><br />
city <strong>Lab</strong>oratory. He’s also founding partner and director of carlorattiassociati,<br />
an architectural firm. ratti has a PhD in architecture from the University of<br />
cambridge. He’s a member of the Ordine degli Ingegneri di torino and the Association<br />
des Anciens Elèves de l’École Nationale des Ponts et chaussées, and<br />
is a UK registered Architect. contact him at the ratti@media.mit.edu.<br />
Josep Blat is a professor of computer science and director of the Department<br />
of Information and communication technologies at Universitat Pompeu<br />
Fabra, Spain. His research interests include cooperative environments, educational<br />
telematics, multimedia, and GIS. blat has a PhD in mathematics from<br />
the Heriot-Watt University (Edinburgh). contact him at josep.blat@upf.edu<br />
Questions<br />
Comments<br />
For more information on this or any other computing<br />
topic, please visit our Digital Library at<br />
www.computer.org/csdl.<br />
Email<br />
pervasive@computer.org<br />
OctObEr–DEcEmbEr 2008 PERVASIVE computing 43<br />
Authorized licensed use limited to: IEEE Xplore. Downloaded on December 4, 2008 at 08:13 from IEEE Xplore. Restrictions apply.