A review of the characteristics of nanoparticles in the urban ...
A review of the characteristics of nanoparticles in the urban ...
A review of the characteristics of nanoparticles in the urban ...

Create successful ePaper yourself
Turn your PDF publications into a flip-book with our unique Google optimized e-Paper software.
Atmospheric Environment xxx (2010) 1e18<br />
Contents lists available at ScienceDirect<br />
Atmospheric Environment<br />
journal homepage: www.elsevier.com/locate/atmosenv<br />
Review<br />
A <strong>review</strong> <strong>of</strong> <strong>the</strong> <strong>characteristics</strong> <strong>of</strong> <strong>nanoparticles</strong> <strong>in</strong> <strong>the</strong> <strong>urban</strong> atmosphere<br />
and <strong>the</strong> prospects for develop<strong>in</strong>g regulatory controls<br />
Prashant Kumar a, *, Alan Rob<strong>in</strong>s a , Sotiris Vardoulakis b , Rex Britter c<br />
a Faculty <strong>of</strong> Eng<strong>in</strong>eer<strong>in</strong>g and Physical Sciences, University <strong>of</strong> Surrey, Guildford GU2 7XH, UK<br />
b Public & Environmental Health Research Unit, London School <strong>of</strong> Hygiene & Tropical Medic<strong>in</strong>e, London WC1E 7HT, UK<br />
c Senseable City Laboratory, Massachusetts Institute <strong>of</strong> Technology, Boston, MA 02139, USA<br />
article<br />
<strong>in</strong>fo<br />
abstract<br />
Article history:<br />
Received 30 November 2009<br />
Received <strong>in</strong> revised form<br />
4 August 2010<br />
Accepted 5 August 2010<br />
Keywords:<br />
Airborne <strong>nanoparticles</strong><br />
Bio-fuel<br />
Manufactured nanomaterials<br />
Number and size distributions<br />
Street canyons<br />
Ultraf<strong>in</strong>e particles<br />
The likely health and environmental implications associated with atmospheric <strong>nanoparticles</strong> have<br />
prompted considerable recent research activity. Knowledge <strong>of</strong> <strong>the</strong> <strong>characteristics</strong> <strong>of</strong> <strong>the</strong>se particles has<br />
improved considerably due to an ever grow<strong>in</strong>g <strong>in</strong>terest <strong>in</strong> <strong>the</strong> scientific community, though not yet<br />
sufficient to enable regulatory decision mak<strong>in</strong>g on a particle number basis. This <strong>review</strong> syn<strong>the</strong>sizes <strong>the</strong><br />
exist<strong>in</strong>g knowledge <strong>of</strong> <strong>nanoparticles</strong> <strong>in</strong> <strong>the</strong> <strong>urban</strong> atmosphere, highlights recent advances <strong>in</strong> our<br />
understand<strong>in</strong>g and discusses research priorities and emerg<strong>in</strong>g aspects <strong>of</strong> <strong>the</strong> subject. The article beg<strong>in</strong>s<br />
by describ<strong>in</strong>g <strong>the</strong> <strong>characteristics</strong> <strong>of</strong> <strong>the</strong> particles and <strong>in</strong> do<strong>in</strong>g so treats <strong>the</strong>ir formation, chemical<br />
composition and number concentrations, as well as <strong>the</strong> role <strong>of</strong> removal mechanisms <strong>of</strong> various k<strong>in</strong>ds.<br />
This is followed by an overview <strong>of</strong> emerg<strong>in</strong>g classes <strong>of</strong> <strong>nanoparticles</strong> (i.e. manufactured and bio-fuel<br />
derived), toge<strong>the</strong>r with a brief discussion <strong>of</strong> o<strong>the</strong>r sources. The subsequent section provides a comprehensive<br />
<strong>review</strong> <strong>of</strong> <strong>the</strong> work<strong>in</strong>g pr<strong>in</strong>ciples, capabilities and limitations <strong>of</strong> <strong>the</strong> ma<strong>in</strong> classes <strong>of</strong> advanced<br />
<strong>in</strong>strumentation that are currently deployed to measure number and size distributions <strong>of</strong> <strong>nanoparticles</strong><br />
<strong>in</strong> <strong>the</strong> atmosphere. A fur<strong>the</strong>r section focuses on <strong>the</strong> dispersion modell<strong>in</strong>g <strong>of</strong> <strong>nanoparticles</strong> and associated<br />
challenges. Recent toxicological and epidemiological studies are <strong>review</strong>ed so as to highlight both current<br />
trends and <strong>the</strong> research needs relat<strong>in</strong>g to exposure to particles and <strong>the</strong> associated health implications.<br />
The <strong>review</strong> <strong>the</strong>n addresses regulatory concerns by provid<strong>in</strong>g an historical perspective <strong>of</strong> recent developments<br />
toge<strong>the</strong>r with <strong>the</strong> associated challenges <strong>in</strong>volved <strong>in</strong> <strong>the</strong> control <strong>of</strong> airborne nanoparticle<br />
concentrations. The article concludes with a critical discussion <strong>of</strong> <strong>the</strong> topic areas covered.<br />
Ó 2010 Elsevier Ltd. All rights reserved.<br />
1. Introduction<br />
This <strong>review</strong> addresses <strong>the</strong> <strong>characteristics</strong> <strong>of</strong> airborne <strong>nanoparticles</strong><br />
and <strong>the</strong> prospects for develop<strong>in</strong>g appropriate regulatory<br />
controls, subjects that have recently attracted substantial attention<br />
from <strong>the</strong> air quality management and scientific communities. Here,<br />
we focus ma<strong>in</strong>ly on man-made <strong>nanoparticles</strong> <strong>in</strong> <strong>urban</strong> atmospheres,<br />
as this is where nearly all exposure to particle pollution<br />
occurs and is consequently <strong>the</strong> target for regulatory action. We<br />
refer to natural sources <strong>of</strong> <strong>nanoparticles</strong> (e.g. <strong>in</strong> mar<strong>in</strong>e or forest<br />
environments) only where necessary to set <strong>urban</strong> conditions <strong>in</strong><br />
context. The focus implies that <strong>the</strong> dom<strong>in</strong>ant source is road transport.<br />
There are, <strong>of</strong> course, likely to be specific <strong>urban</strong> locations,<br />
* Correspond<strong>in</strong>g author. Division <strong>of</strong> Civil, Chemical and Environmental Eng<strong>in</strong>eer<strong>in</strong>g,<br />
University <strong>of</strong> Surrey, Guildford GU2 7XH, UK. Tel.: þ44 1483 682762; fax:<br />
þ44 1483 682135.<br />
E-mail addresses: P.Kumar@surrey.ac.uk, Prashant.Kumar@cantab.net (P. Kumar).<br />
perhaps near demolition or build<strong>in</strong>g sites (Hansen et al., 2008),<br />
airports (Hu et al., 2009) or ports and harbours (Isakson et al., 2001;<br />
Saxe and Larsen, 2004), where o<strong>the</strong>r sources are important.<br />
Specifically <strong>in</strong>clud<strong>in</strong>g <strong>the</strong>se <strong>in</strong> <strong>the</strong> <strong>review</strong> is not feasible as <strong>the</strong>ir<br />
<strong>in</strong>fluence is localised (becom<strong>in</strong>g a site-specific issue) whereas road<br />
traffic is widespread.<br />
Nanoparticles are basically particles <strong>in</strong> <strong>the</strong> nanometre size range<br />
(i.e.
2<br />
P. Kumar et al. / Atmospheric Environment xxx (2010) 1e18<br />
N ormalised distributions (1/ C t ota l ) d N / dlo g D p<br />
1.0<br />
0.8<br />
0.6<br />
0.4<br />
0.2<br />
0.0<br />
Nuclei mode Accumulation Coarse mode<br />
mode<br />
Ultraf<strong>in</strong>e Particles<br />
D p 100 nm<br />
Nanoparticles<br />
D p 300 nm<br />
PM 1<br />
D p 1 m<br />
Measured<br />
Fitted modes<br />
Deposition<br />
PM 2.5<br />
D p 2.5 m<br />
PM 10<br />
D p 10 m<br />
1 10 100 1000 10000<br />
D p (nm)<br />
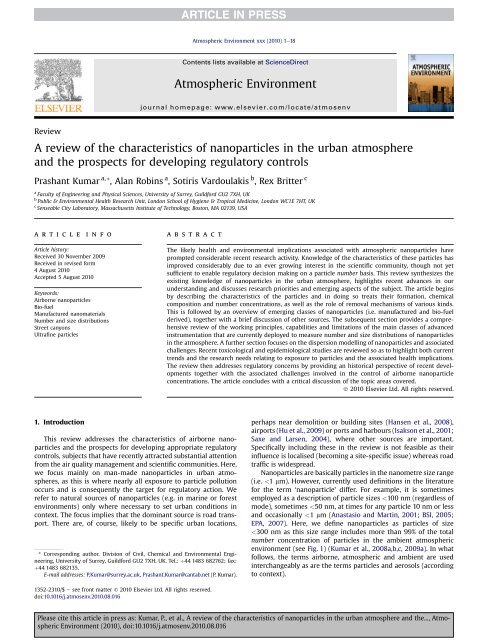
Fig. 1. Typical example <strong>of</strong> number weighted size distributions <strong>in</strong> a street canyon<br />
(Kumar et al., 2008a); also shown are some key def<strong>in</strong>itions regard<strong>in</strong>g atmospheric<br />
particles and size dependent deposition <strong>in</strong> alveolar and trancheo-bronchial regions<br />
(ICRP, 1994).<br />
The first question arises is why might we need to control <strong>nanoparticles</strong>?<br />
The reasons could <strong>in</strong>clude <strong>the</strong>ir probable negative impact<br />
on human health (Murr and Garza, 2009), <strong>urban</strong> visibility (Horvath,<br />
1994) and global climate (IPCC, 2007; Strawa et al., 2010), as well as<br />
<strong>the</strong>ir <strong>in</strong>fluence on <strong>the</strong> chemistry <strong>of</strong> <strong>the</strong> atmosphere, through <strong>the</strong>ir<br />
chemical composition and reactivity open<strong>in</strong>g novel chemical transformation<br />
pathways (Kulmala et al., 2004). Atmospheric particles are<br />
currently regulated <strong>in</strong> terms <strong>of</strong> mass concentrations <strong>in</strong> <strong>the</strong> size ranges<br />
10 (PM 10 )and2.5 mm (PM 2.5 ) but this does not address particle<br />
number concentrations. Thus <strong>the</strong> major proportion <strong>of</strong> vehicle emissions<br />
that contribute significantly to number concentrations rema<strong>in</strong>s<br />
unregulated through ambient air quality standards.<br />
If atmospheric <strong>nanoparticles</strong> are to be controlled, what would<br />
be <strong>the</strong> best metric to represent <strong>the</strong>ir toxic effects? This question<br />
cannot be answered precisely as several generic and specific <strong>characteristics</strong><br />
<strong>of</strong> particles (i.e. chemical composition, size, geometry,<br />
mass concentration or surface area, etc.) have been proposed but<br />
without a consensus be<strong>in</strong>g reached. However, recent toxicological<br />
(Donaldson et al., 2005; Murr and Garza, 2009) and epidemiological<br />
(Ibald-Mulli et al., 2002) studies associate exposure to ultraf<strong>in</strong>e<br />
particles (those below 100 nm <strong>in</strong> diameter) with adverse health<br />
effects, though <strong>the</strong>re are uncerta<strong>in</strong>ties about <strong>the</strong> exact biological<br />
mechanisms <strong>in</strong>volved. The studies however suggest that particle<br />
number concentrations are an important metric to represent <strong>the</strong><br />
toxic effects. This is because ultraf<strong>in</strong>e particles have (i) a higher<br />
probability <strong>of</strong> suspension <strong>in</strong> <strong>the</strong> atmosphere and hence a longer<br />
residence time (AQEG, 2005; Kittelson, 1998), (ii) a larger likelihood<br />
<strong>of</strong> penetration and deposition <strong>in</strong> respiratory or cardiovascular<br />
systems (see Fig. 1) (Donaldson et al., 2005; ICRP, 1994), and (iii)<br />
a higher surface area per unit volume than larger particles that<br />
<strong>in</strong>creases <strong>the</strong> capability to adsorb organic compounds, some <strong>of</strong><br />
which are potentially carc<strong>in</strong>ogenic (Donaldson et al., 2005; EPA,<br />
2002). Note that <strong>the</strong> ultraf<strong>in</strong>e size range comprises <strong>the</strong> major<br />
proportion (about 80%) <strong>of</strong> <strong>the</strong> total number concentration <strong>of</strong><br />
ambient <strong>nanoparticles</strong>, but negligible mass concentration (AQEG,<br />
2005; Kittelson, 1998).<br />
While <strong>the</strong> above potential impacts motivate control <strong>of</strong> <strong>nanoparticles</strong>,<br />
several important questions related to <strong>the</strong>ir <strong>characteristics</strong>,<br />
sources and measurement rema<strong>in</strong> unanswered. While several<br />
new sources (e.g. from bio-fuel emissions and particle manufacture)<br />
cont<strong>in</strong>ue to emerge, conventional-fuelled vehicles rema<strong>in</strong> <strong>the</strong><br />
1<br />
0.8<br />
0.6<br />
0.4<br />
0.2<br />
0<br />
D epositio n<br />
dom<strong>in</strong>ant anthropogenic source <strong>in</strong> <strong>urban</strong> areas (Johansson et al.,<br />
2007; Rose et al., 2006; Schauer et al., 1996; Wahl<strong>in</strong> et al., 2001).<br />
All else be<strong>in</strong>g equal, diesel-fuelled vehicles contribute about 10e100<br />
times more <strong>in</strong> terms <strong>of</strong> both mass and number concentrations<br />
compared with petrol-fuelled vehicles (Kittelson et al., 2004).<br />
However, <strong>the</strong> latter emit a higher proportion <strong>of</strong> small-sized particles,<br />
by number, under high speed and load conditions (CONCAWE,<br />
1999; Kittelson et al., 2004; Wehner et al., 2009). The use <strong>of</strong> bi<strong>of</strong>uels<br />
<strong>in</strong> vehicles has been promoted as a result <strong>of</strong> strict emission<br />
standards and <strong>in</strong>tentions to secure fossil fuel supplies. Particle mass<br />
emissions from bio-fuelled vehicles have decreased significantly,<br />
but possibly at <strong>the</strong> expense <strong>of</strong> an <strong>in</strong>crease <strong>in</strong> particle number<br />
emissions (Cheng et al., 2008a), lead<strong>in</strong>g to some confusion as to<br />
whe<strong>the</strong>r such vehicles can meet <strong>the</strong> particle number based emissions<br />
standards <strong>in</strong>cluded <strong>in</strong> Euro-5 and Euro-6 (EU, 2008; see<br />
Section 7 for details). Fur<strong>the</strong>rmore, new types <strong>of</strong> <strong>nanoparticles</strong> (i.e.<br />
manufactured, eng<strong>in</strong>eered or syn<strong>the</strong>sized) have recently appeared<br />
for which <strong>the</strong>re is limited background knowledge <strong>of</strong> <strong>the</strong>ir concentrations,<br />
<strong>characteristics</strong>, health and environmental effects (Kumar<br />
et al., 2010). These may have relatively smaller concentrations<br />
than o<strong>the</strong>r <strong>nanoparticles</strong> <strong>in</strong> <strong>the</strong> atmosphere but may pose larger<br />
health risks (Andujar et al., 2009). Whe<strong>the</strong>r <strong>the</strong> <strong>in</strong>creased use <strong>of</strong><br />
manufactured <strong>nanoparticles</strong> will complicate exist<strong>in</strong>g regulatory<br />
concerns over o<strong>the</strong>r atmospheric <strong>nanoparticles</strong> rema<strong>in</strong> uncerta<strong>in</strong>.<br />
Concentrations <strong>of</strong> <strong>nanoparticles</strong> can vary by up to five or more<br />
orders <strong>of</strong> magnitude (from 10 2 to 10 7 #cm 3 ) depend<strong>in</strong>g on environmental<br />
conditions and source strengths (see Section 3). Urban<br />
street canyons lead <strong>the</strong> table for greatest concentrations as <strong>the</strong>y can<br />
act as a trap for pollutants emitted from vehicles. This is enhanced by<br />
<strong>the</strong> surround<strong>in</strong>g built-up environment that limits <strong>the</strong> dispersion <strong>of</strong><br />
exhaust emissions (Van D<strong>in</strong>genen et al., 2004). For example, a street<br />
canyon study by Kumar et al. (2008c) found that 20 s averaged<br />
nanoparticle concentrations <strong>in</strong>creased by up to a factor <strong>of</strong> a thousand<br />
from <strong>the</strong> overall hourly averaged (i.e. from about 10 4 to 10 7 #cm 3 )<br />
because a diesel lorry was parked near <strong>the</strong> sampl<strong>in</strong>g location with its<br />
eng<strong>in</strong>e idl<strong>in</strong>g for a few tens <strong>of</strong> seconds. Such events are common <strong>in</strong><br />
<strong>urban</strong> areas but are generally overlooked ei<strong>the</strong>r because <strong>of</strong> <strong>the</strong><br />
limited sampl<strong>in</strong>g frequencies <strong>of</strong> <strong>in</strong>struments (see Section 5) or<strong>the</strong><br />
general practice to analyse air quality data on a m<strong>in</strong>imum <strong>of</strong> a halfhourly<br />
or an hourly basis. Exposure to such peak concentrations may<br />
aggravate exist<strong>in</strong>g pulmonary and cardiovascular conditions (Brugge<br />
et al., 2007) and hence require regulatory attention.<br />
Reliable characterisation <strong>of</strong> <strong>nanoparticles</strong> <strong>in</strong> <strong>the</strong> air is vital for<br />
develop<strong>in</strong>g a regulatory framework. A number <strong>of</strong> <strong>in</strong>struments have<br />
recently emerged but progress to measure concentrations and<br />
distributions has been limited by a lack <strong>of</strong> standard methodologies<br />
and application guidel<strong>in</strong>es (see Section 4).<br />
This article aims to address <strong>the</strong> follow<strong>in</strong>g areas that are important<br />
for develop<strong>in</strong>g a regulatory framework for atmospheric <strong>nanoparticles</strong>:<br />
(i) <strong>the</strong> <strong>characteristics</strong> <strong>of</strong> atmospheric <strong>nanoparticles</strong>,<br />
provid<strong>in</strong>g an overview <strong>of</strong> <strong>the</strong>ir formation, chemical composition<br />
and loss mechanisms, (ii) conventional and emerg<strong>in</strong>g sources (e.g.<br />
bio-fuels and manufactur<strong>in</strong>g) and <strong>the</strong>ir contribution to atmospheric<br />
particle levels, (iii) <strong>the</strong> current state-<strong>of</strong>-<strong>the</strong>-art for measur<strong>in</strong>g<br />
number and size distributions, (iv) dispersion modell<strong>in</strong>g <strong>of</strong> <strong>nanoparticles</strong><br />
and associated challenges, (v) health and environmental<br />
implications, (vi) an historical perspective <strong>of</strong> recent developments<br />
<strong>in</strong> regulation and policy, and (vii) a discussion <strong>of</strong> <strong>the</strong> critical f<strong>in</strong>d<strong>in</strong>gs<br />
and future research needs.<br />
2. Characteristics <strong>of</strong> atmospheric <strong>nanoparticles</strong><br />
Fig. 1 summarises <strong>the</strong> term<strong>in</strong>ology commonly used to represent<br />
particle size ranges. For example, toxicologists use terms like<br />
ultraf<strong>in</strong>e (particle sizes below 100 nm), f<strong>in</strong>e (below 1000 nm) and<br />
Please cite this article <strong>in</strong> press as: Kumar, P., et al., A <strong>review</strong> <strong>of</strong> <strong>the</strong> <strong>characteristics</strong> <strong>of</strong> <strong>nanoparticles</strong> <strong>in</strong> <strong>the</strong> <strong>urban</strong> atmosphere and <strong>the</strong>..., Atmospheric<br />
Environment (2010), doi:10.1016/j.atmosenv.2010.08.016
P. Kumar et al. / Atmospheric Environment xxx (2010) 1e18 3<br />
coarse particles (above 1000 nm) (Oberdörster et al., 2005a). On <strong>the</strong><br />
o<strong>the</strong>r hand, regulatory agencies use terms such as PM 10 ,PM 2.5 and<br />
PM 1 (PM is referred to particulate matter and <strong>the</strong> subscripts show<br />
cut-<strong>of</strong>f sizes <strong>in</strong> mm).<br />
In aerosol science, atmospheric particles are discussed <strong>in</strong> terms<br />
<strong>of</strong> modes (i.e. nucleation, Aitken, accumulation and coarse). Each<br />
has dist<strong>in</strong>ctive sources, size range, formation mechanisms, chemical<br />
composition and deposition pathways (H<strong>in</strong>ds, 1999). It is<br />
important to def<strong>in</strong>e <strong>the</strong> particle size range for each mode as def<strong>in</strong>itions<br />
currently used differ, as summarised <strong>in</strong> Table 1. Each mode<br />
is described below <strong>in</strong> <strong>the</strong> context <strong>of</strong> <strong>the</strong> polluted <strong>urban</strong> atmosphere.<br />
2.1. Nucleation mode<br />
Nucleation (or nuclei) mode particles (typically def<strong>in</strong>ed as <strong>the</strong><br />
1e30 nm range) are predom<strong>in</strong>antly a mixture <strong>of</strong> two or more<br />
mutually exclusive aerosol populations (L<strong>in</strong>gard et al., 2006). These<br />
are not present <strong>in</strong> primary exhaust emissions, but are thought to be<br />
formed through nucleation (gas-to-particle conversion) <strong>in</strong> <strong>the</strong><br />
atmosphere after rapid cool<strong>in</strong>g and dilution <strong>of</strong> emissions when <strong>the</strong><br />
saturation ratio <strong>of</strong> gaseous compounds <strong>of</strong> low volatility (i.e. sulphuric<br />
acid) reaches a maximum (Charron and Harrison, 2003;<br />
Kittelson et al., 2006a). Most <strong>of</strong> <strong>the</strong>se particles comprise<br />
sulphates, nitrates and organic compounds (Se<strong>in</strong>feld and Pandis,<br />
2006). These particles are typically liquid droplets primarily<br />
composed <strong>of</strong> readily volatile components derived from unburned<br />
fuel and lubricant oil (i.e. <strong>the</strong> solvent organic fraction: n-alkanes,<br />
alkenes, alkyl-substituted cycloalkanes, and low molecular weight<br />
poly-aromatic hydrocarbon compounds) (L<strong>in</strong>gard et al., 2006;<br />
Sakurai et al., 2003; Wehner et al., 2004).<br />
Nucleation mode particles are found <strong>in</strong> high number concentrations<br />
near sources. Collisions with each o<strong>the</strong>r and with particles<br />
<strong>in</strong> <strong>the</strong> accumulation mode are largely responsible for <strong>the</strong>ir relatively<br />
short atmospheric life time. Dry deposition, ra<strong>in</strong>out or<br />
growth through condensation are <strong>the</strong> o<strong>the</strong>r dom<strong>in</strong>ant removal<br />
mechanisms (H<strong>in</strong>ds, 1999).<br />
2.2. Aitken and accumulation modes<br />
The Aitken mode is an overlapp<strong>in</strong>g fraction (typically def<strong>in</strong>ed as<br />
<strong>the</strong> 20e100 nm range) <strong>of</strong> <strong>the</strong> nucleation and accumulation mode<br />
Table 1<br />
Examples show<strong>in</strong>g def<strong>in</strong>itions used to classify particles accord<strong>in</strong>g to mode.<br />
Particle modes<br />
Size range<br />
(nm)<br />
Source<br />
Nucleation mode
4<br />
P. Kumar et al. / Atmospheric Environment xxx (2010) 1e18<br />
3.1.1. Manufactured <strong>nanoparticles</strong><br />
These differ from o<strong>the</strong>r airborne <strong>nanoparticles</strong> <strong>in</strong> numerous<br />
aspects, such as <strong>the</strong>ir sources, composition, homogeneity or<br />
heterogeneity, size distribution, oxidant potential and potential<br />
routes <strong>of</strong> exposure and emissions (Xia et al., 2009; Kumar et al.,<br />
2010). Small size and relatively large reactive surface areas are<br />
<strong>the</strong> novel properties <strong>of</strong> manufactured <strong>nanoparticles</strong> that encourage<br />
<strong>the</strong>ir <strong>in</strong>creased production and use <strong>in</strong> various technologic applications<br />
(e.g. <strong>in</strong> electronics, biomedic<strong>in</strong>e, pharmaceutics, cosmetics,<br />
energy and materials) (Helland et al., 2007). For <strong>in</strong>stance, Maynard<br />
(2006) projected that <strong>the</strong> worldwide production <strong>of</strong> nanomaterials<br />
will rise from an estimated 2000 tons <strong>in</strong> 2004 to 58,000 tons by<br />
2020. Dawson (2008) reported that by 2014 more than 15% <strong>of</strong> all<br />
products <strong>in</strong> <strong>the</strong> global market will have some sort <strong>of</strong> nanotechnology<br />
<strong>in</strong>corporated <strong>in</strong> <strong>the</strong>ir manufactur<strong>in</strong>g process. The major<br />
class <strong>of</strong> <strong>the</strong>se particles falls <strong>in</strong> <strong>the</strong> categories <strong>of</strong> fullerenes, carbon<br />
nanotubes, metal oxides (e.g. oxides <strong>of</strong> iron and z<strong>in</strong>c, titania, ceria)<br />
and metal <strong>nanoparticles</strong> (Ju-Nam and Lead, 2008). Silver <strong>nanoparticles</strong>,<br />
carbon nanotubes and fullerenes are <strong>the</strong> most popular<br />
classes <strong>of</strong> nanomaterials currently <strong>in</strong> use (HSE, 2007). This benefits<br />
<strong>in</strong>dustry and <strong>the</strong> economy but is likely to <strong>in</strong>crease population<br />
exposure and may affect human health (Xia et al., 2009).<br />
Manufactured <strong>nanoparticles</strong> are not <strong>in</strong>tentionally released <strong>in</strong>to<br />
<strong>the</strong> environment, though a release may occur <strong>in</strong> <strong>the</strong> production, use<br />
and disposal phases <strong>of</strong> nanomaterial-<strong>in</strong>tegrated products<br />
(Bystrzejewska-Piotrowska et al., 2009). Unexpected sources are<br />
also emerg<strong>in</strong>g; e.g. Evelyn et al. (2002) reported carbon nanotubelike<br />
structures <strong>in</strong> diesel-eng<strong>in</strong>e emissions, lead<strong>in</strong>g to concern about<br />
<strong>the</strong>ir potential impact if widely emitted <strong>in</strong>to <strong>the</strong> atmosphere.<br />
Fur<strong>the</strong>rmore, carbon nanotubes are widely used <strong>in</strong> mass consumer<br />
products such as batteries and textiles (Köhler et al., 2008). Life<br />
cycle studies <strong>in</strong>dicate that <strong>the</strong>se particles can enter <strong>the</strong> environment<br />
by wear and tear <strong>of</strong> products or through <strong>the</strong> municipal solid<br />
waste stream where only <strong>in</strong>c<strong>in</strong>eration above 850 C is thought to<br />
elim<strong>in</strong>ate <strong>the</strong>m (Köhler et al., 2008). Similarly, fullerenes and<br />
carbon black can enter <strong>the</strong> environment dur<strong>in</strong>g stor<strong>in</strong>g, fill<strong>in</strong>g and<br />
weigh<strong>in</strong>g operations <strong>in</strong> factories (Fujitani et al., 2008; Kuhlbusch<br />
et al., 2004). Because <strong>of</strong> <strong>the</strong>ir size, effects <strong>of</strong> gravitational settl<strong>in</strong>g<br />
are small and a long life time <strong>in</strong> air is expected. Muller and Nowack<br />
(2008) report rare data on mass concentrations <strong>of</strong> manufactured<br />
<strong>nanoparticles</strong> (about 10 3 mg m 3 ) <strong>in</strong> <strong>the</strong> atmosphere <strong>in</strong><br />
Switzerland. However, knowledge <strong>of</strong> <strong>the</strong> current background<br />
concentrations and distributions (on a number basis) <strong>of</strong> airdispersed<br />
manufactured <strong>nanoparticles</strong> is very limited. Despite this,<br />
a substantial forecast production and <strong>the</strong>ir supposed persistence<br />
aga<strong>in</strong>st degradation imply <strong>in</strong>creas<strong>in</strong>g human and environmental<br />
exposure (Donaldson and Tran, 2004; Helland et al., 2007).<br />
Unquestionably, understand<strong>in</strong>g <strong>of</strong> <strong>the</strong> nature and behaviour <strong>of</strong> this<br />
class <strong>of</strong> particles has improved <strong>in</strong> recent years (Nowack, 2009) but<br />
a number <strong>of</strong> unanswered questions rema<strong>in</strong>, related to emission<br />
routes, atmospheric life time, dispersion behaviour and background<br />
concentrations.<br />
To generalise <strong>the</strong> toxicity <strong>of</strong> <strong>the</strong>se particles is difficult because <strong>of</strong><br />
<strong>the</strong> great variability <strong>in</strong> <strong>the</strong> materials used (e.g. titanium dioxide,<br />
silver, carbon, gold, cadmium and heavy metals among o<strong>the</strong>rs)<br />
(Donaldson et al., 2006; Duff<strong>in</strong> et al., 2007). O<strong>the</strong>r factors such as<br />
size, shape, surface <strong>characteristics</strong>, <strong>in</strong>ner structure and chemical<br />
composition also play an important role <strong>in</strong> determ<strong>in</strong><strong>in</strong>g toxicity and<br />
reactivity (Maynard and Aitken, 2007). For <strong>in</strong>stance, some manufactured<br />
<strong>nanoparticles</strong> (e.g. carbon nanotubes, nanowires, nanowhiskers<br />
and nan<strong>of</strong>ibres, etc.) have large aspect ratios (i.e. length to<br />
diameter) compared to most o<strong>the</strong>rs (e.g. nanosphere, nanocubes,<br />
nanopyramids, etc.), <strong>in</strong>troduc<strong>in</strong>g uncerta<strong>in</strong>ties <strong>in</strong> <strong>the</strong>ir measurement<br />
once <strong>the</strong>y are mixed with ambient <strong>nanoparticles</strong>. Carbon<br />
nanotubes show <strong>the</strong> most variability <strong>in</strong> aspect ratio because <strong>of</strong> <strong>the</strong>ir<br />
extended diameter (2.2e10’s nm) and length ranges (up to 100’s<br />
nm) (Iijima, 1991). Occupational exposure to manufactured <strong>nanoparticles</strong><br />
is possible dur<strong>in</strong>g recycl<strong>in</strong>g processes and <strong>in</strong> factory<br />
environments (Andujar et al., 2009). Chemical <strong>characteristics</strong><br />
suggest a possible accumulation along <strong>the</strong> food cha<strong>in</strong> and high<br />
persistence (Donaldson et al., 2006). Many questions rema<strong>in</strong> largely<br />
unanswered, e.g. <strong>the</strong> best metric to evaluate toxicity, <strong>the</strong> precise<br />
biological mechanisms affect<strong>in</strong>g human health, <strong>the</strong> potential for<br />
accumulation <strong>in</strong> <strong>the</strong> environment and organisms, biodegradability,<br />
long-term effects, exposure pathways, measurement methods and<br />
associated environmental risks.<br />
Fur<strong>the</strong>r <strong>in</strong>formation on manufactured <strong>nanoparticles</strong> can be<br />
found <strong>in</strong> Handy et al. (2008a, 2008b), Valant et al. (2009),<br />
Bystrzejewska-Piotrowska et al. (2009) and Kumar et al. (2010).<br />
3.1.2. Nanoparticle emissions from conventional-fuelled vehicles<br />
In <strong>the</strong> UK, <strong>the</strong> average traffic fleet share <strong>of</strong> diesel-fuelled vehicles<br />
over <strong>the</strong> period between 1999 and 2008 was about 26% (DfT, 2008,<br />
2009). This figure is lower <strong>in</strong> London but, despite this, Colvile et al.<br />
(2001) found that PM 10 emissions from diesel-eng<strong>in</strong>e vehicles were<br />
far greater (about 67% <strong>of</strong> total) than from petrol-fuelled vehicles<br />
(about 11%). More generally, many mass-unit based studies show that<br />
vehicular sources can comprise up to 77% <strong>of</strong> total PM 10 <strong>in</strong> <strong>urban</strong><br />
environments (AQEG, 1999), although some recent studies have<br />
reported smaller contributions (Vardoulakis and Kassomenos, 2008).<br />
The situation with particle number emissions from road vehicles<br />
is not much different. Numerous studies conclude that road vehicles<br />
are a major source <strong>of</strong> <strong>nanoparticles</strong> <strong>in</strong> <strong>urban</strong> areas (Johansson<br />
et al., 2007; Keogh et al., 2009; Shi et al., 2001). Their contribution<br />
can be up to 86% <strong>of</strong> total particle number concentrations (Pey<br />
et al., 2009). This arises because <strong>the</strong> majority <strong>of</strong> particles emitted<br />
from diesel- and petrol-fuelled vehicles are <strong>of</strong> sizes below 130 nm<br />
and 60 nm, respectively (Harris and Maricq, 2001; Kittelson, 1998).<br />
Diesel-fuelled vehicles, though fewer <strong>in</strong> number, make by far <strong>the</strong><br />
greatest contributions to total number concentrations. However,<br />
emissions from petrol-fuelled vehicles are more uncerta<strong>in</strong> as <strong>the</strong>y<br />
are highly dependent on driv<strong>in</strong>g conditions (Graskow et al., 1998).<br />
Typical driv<strong>in</strong>g <strong>in</strong> unsteady and stopestart conditions <strong>in</strong> <strong>urban</strong><br />
areas leads to storage and release <strong>of</strong> volatile hydrocarbons dur<strong>in</strong>g<br />
acceleration (Kittelson et al., 2001) and petrol-fuelled vehicles <strong>the</strong>n<br />
emit at rates similar to modern heavy duty diesel-fuelled vehicles<br />
(CONCAWE, 1999; Graskow et al., 1998).<br />
3.1.3. Nanoparticle emissions from bio-fuelled vehicles<br />
As illustrated <strong>in</strong> Fig. 2, bio-fuels are liquid or gaseous fuels that<br />
are produced from organic material through <strong>the</strong>rmochemical or<br />
biochemical conversion processes (Hart et al., 2003). They are seen<br />
as one <strong>of</strong> <strong>the</strong> means by which targets with<strong>in</strong> <strong>the</strong> Kyoto Protocol<br />
could be met by reduc<strong>in</strong>g <strong>the</strong> transport sector’s 98% reliance on<br />
fossil fuels (EEA Brief<strong>in</strong>g, 2004). Among those shown <strong>in</strong> Fig. 2, biodiesel<br />
and bio-ethanol are largely <strong>the</strong> preferred alternative fuel for<br />
road vehicles (Agarwal, 2007; Demirbas, 2009). Their use has<br />
significantly decreased particle mass and gaseous (e.g. CO, CO 2 and<br />
HC) emissions but has <strong>in</strong>creased <strong>the</strong> particle number emissions<br />
(see Table 2). The ma<strong>in</strong> reasons for this <strong>in</strong>clude (i) a shift <strong>in</strong> size<br />
distributions towards smaller particle sizes, (ii) <strong>the</strong> reduced available<br />
surface area <strong>of</strong> pre-exist<strong>in</strong>g particles <strong>in</strong> emissions that favours<br />
nucleation over adsorption (Kittelson, 1998), (iii) <strong>the</strong> lower calorific<br />
values <strong>of</strong> bio-fuels (typically 37 MJ kg 1 for rapeseed methyl ester<br />
bio-diesel (RME) compared with 42.6 MJ kg 1 for ultra-low sulphur<br />
diesel, ULSD), result<strong>in</strong>g <strong>in</strong> <strong>in</strong>creased fuel flow rates, and (iv)<br />
a higher density <strong>of</strong> bio-diesel (typically 883.7 kg m 3 for RME<br />
compared with 827.1 kg m 3 for ULSD), result<strong>in</strong>g <strong>in</strong> <strong>in</strong>creased rate<br />
<strong>of</strong> fuel mass used (Lapuerta et al., 2008; Mathis et al., 2005;<br />
Tsolakis, 2006).<br />
Please cite this article <strong>in</strong> press as: Kumar, P., et al., A <strong>review</strong> <strong>of</strong> <strong>the</strong> <strong>characteristics</strong> <strong>of</strong> <strong>nanoparticles</strong> <strong>in</strong> <strong>the</strong> <strong>urban</strong> atmosphere and <strong>the</strong>..., Atmospheric<br />
Environment (2010), doi:10.1016/j.atmosenv.2010.08.016
P. Kumar et al. / Atmospheric Environment xxx (2010) 1e18 5<br />
Fig. 2. Description <strong>of</strong> resources and conversion technology used to produce bio-fuels; adapted from Hart et al. (2003).<br />
Irrespective <strong>of</strong> <strong>the</strong> type <strong>of</strong> bio-fuel (pure or blended) and eng<strong>in</strong>e<br />
used, most studies <strong>in</strong>dicate relatively higher particle number<br />
emissions for bio-fuels than for diesel or petrol fuels (see Table 2).<br />
Some <strong>of</strong> <strong>the</strong> observations (e.g. by Fontaras et al. (2009) for<br />
passenger cars and by Lee et al. (2009) for non-DPF (diesel particulate<br />
filter) cars) <strong>in</strong>dicate problems <strong>in</strong> meet<strong>in</strong>g <strong>the</strong> particle number<br />
emission regulations enacted by Euro-5 and Euro-6 emission<br />
standards, which limit number emissions to 6.0 10 11 #km 1 .<br />
Fontaras et al. (2009) found that particle number emissions can<br />
<strong>in</strong>crease up to tw<strong>of</strong>old under certa<strong>in</strong> driv<strong>in</strong>g cycles when <strong>the</strong> blend<br />
<strong>of</strong> bio-diesel <strong>in</strong> petroleum-diesel is <strong>in</strong>creased from 50 to 100%.<br />
Munack et al. (2001) found an <strong>in</strong>crease <strong>in</strong> particle number emissions<br />
<strong>in</strong> <strong>the</strong> 10e120 nm size range from rapeseed oil bio-diesel<br />
compared with emissions from diesel fuel. Similarly, Krahl et al.<br />
(2003, 2005) observed an <strong>in</strong>crease <strong>in</strong> number concentrations<br />
below 40 nm for bio-diesel fuels relative to those for low and ultralow<br />
sulphur diesel fuels. The <strong>in</strong>creased nanoparticle emission rates<br />
arise ma<strong>in</strong>ly from a shift <strong>in</strong> <strong>the</strong> overall particle number distributions<br />
towards smaller size ranges (see Table 3). The magnitude <strong>of</strong><br />
<strong>the</strong> change depends on a number <strong>of</strong> factors such as driv<strong>in</strong>g<br />
conditions, type <strong>of</strong> bio-fuel and eng<strong>in</strong>e. A few studies have found<br />
large decreases (up to 10efold) <strong>in</strong> mean particle diameter when<br />
bio-diesels were compared with standard diesel (Hansen and<br />
Jensen, 1997). The reasons for <strong>the</strong>se variations are not well understood<br />
but need to be resolved.<br />
In contrast, some studies f<strong>in</strong>d similar total particle number<br />
concentration emissions from both <strong>the</strong> bio- and diesel-fuelled<br />
vehicles (see Bagley et al. (1998) for <strong>the</strong> ‘rated power’ case <strong>in</strong><br />
Table 2). O<strong>the</strong>rs actually record a decrease <strong>in</strong> particle number<br />
emissions when bio-fuels were replaced with petrol or diesel fuels<br />
(e.g. Cheng et al., 2008a for low and medium eng<strong>in</strong>e loads; Bunger<br />
et al., 2000 for idl<strong>in</strong>g conditions; Bagley et al., 1998 with an<br />
oxidation catalytic converter; see Table 2). In l<strong>in</strong>e with this, Jung<br />
et al. (2006) observed about a 38% decrease <strong>in</strong> number concentrations<br />
for soy-based bio-diesel as compared with emissions from<br />
standard diesel, attribut<strong>in</strong>g <strong>the</strong>se decreases partly due to easy<br />
oxidation <strong>of</strong> bio-fuel derived particles. Very low or nil sulphur<br />
contents <strong>in</strong> bio-diesel could be ano<strong>the</strong>r reason for <strong>the</strong> decrease, as<br />
sulphur has <strong>of</strong>ten been found to be associated with <strong>the</strong> formation <strong>of</strong><br />
nucleation mode particles (Kittelson, 1998).<br />
Most studies agree on <strong>the</strong> overall reduction <strong>in</strong> particulate mass<br />
emissions from combustion <strong>of</strong> bio-fuels, ma<strong>in</strong>ly due to reduced<br />
emissions <strong>of</strong> solid carbonaceous particles and <strong>the</strong> lower sulphur<br />
content (Lapuerta et al., 2008). For example, Aakko et al. (2002)<br />
tested bio-fuels <strong>in</strong> a Euro 2 Volvo bus eng<strong>in</strong>e equipped with an<br />
oxidation catalytic converter and a cont<strong>in</strong>uously regenerat<strong>in</strong>g<br />
particulate trap. They observed that rapeseed oil derived bio-diesel<br />
(blended 30% <strong>in</strong>to reformulated diesel fuel) emissions conta<strong>in</strong>ed<br />
a lower mass <strong>of</strong> particulates <strong>in</strong> <strong>the</strong> ma<strong>in</strong> peak area (around 100 nm)<br />
than EN590 (European diesel with sulphur content below<br />
500 ppm) or RFD (Swedish Environmental Class 1 reformulated<br />
diesel) fuels. Similar results were found by Bunger et al. (2000) and<br />
Lapuerta et al. (2002) for rapeseed oil based bio-diesels and by Jung<br />
et al. (2006) for soy-based bio-diesel.<br />
The above observations suggest that use <strong>of</strong> bio-fuels <strong>in</strong> road<br />
vehicles considerably reduces emissions <strong>of</strong> total particle mass.<br />
However, this does not seem to be <strong>the</strong> case with number concentrations,<br />
which lead to difficulties <strong>in</strong> meet<strong>in</strong>g <strong>the</strong> recently <strong>in</strong>troduced<br />
number based limits <strong>of</strong> <strong>the</strong> European vehicle emission<br />
standards. Better understand<strong>in</strong>g <strong>of</strong> <strong>the</strong> performance <strong>of</strong> <strong>the</strong>se fuels<br />
is needed so that appropriate considerations can be made <strong>in</strong><br />
develop<strong>in</strong>g a regulatory framework for atmospheric <strong>nanoparticles</strong>.<br />
Fur<strong>the</strong>r <strong>in</strong>formation on bio-fuels can be found <strong>in</strong> Agarwal (2007),<br />
Hammond et al. (2008), Basha et al. (2009), Balat and Balat<br />
(2009) and Kumar et al. (<strong>in</strong> press).<br />
3.1.4. Tyre and road surface <strong>in</strong>teraction<br />
It is generally believed that tyre and road surface <strong>in</strong>teractions<br />
generate about 70% <strong>of</strong> particles by mass ma<strong>in</strong>ly <strong>in</strong> <strong>the</strong> 2.5e10 mm<br />
size range (AQEG, 1999). A number <strong>of</strong> studies have focused on this<br />
source to analyse its contribution towards PM 2.5 and PM 10 mass<br />
concentrations (Aatmeeyta et al., 2009; Gustafsson et al., 2008;<br />
Husse<strong>in</strong> et al., 2008; Kreider et al., 2010), but less attention has<br />
been paid to particle number emissions. Studies <strong>in</strong>dicate considerable<br />
nanoparticle emissions, depend<strong>in</strong>g on surface, vehicle and<br />
driv<strong>in</strong>g conditions. For example, Gustafsson et al. (2008) found <strong>the</strong><br />
generation <strong>of</strong> 1.81e2.65 10 4 # cm 3 (aga<strong>in</strong>st background <strong>of</strong><br />
0.13e0.17 10 4 #cm 3 ) particles <strong>in</strong> <strong>the</strong> 15e700 nm range at<br />
a vehicle speed <strong>of</strong> 70 km h 1 . Similarly, Dahl et al. (2006) found<br />
generation <strong>of</strong> particle number concentrations between 0.37 and<br />
Please cite this article <strong>in</strong> press as: Kumar, P., et al., A <strong>review</strong> <strong>of</strong> <strong>the</strong> <strong>characteristics</strong> <strong>of</strong> <strong>nanoparticles</strong> <strong>in</strong> <strong>the</strong> <strong>urban</strong> atmosphere and <strong>the</strong>..., Atmospheric<br />
Environment (2010), doi:10.1016/j.atmosenv.2010.08.016
6<br />
P. Kumar et al. / Atmospheric Environment xxx (2010) 1e18<br />
Table 2<br />
Studies compar<strong>in</strong>g emissions <strong>of</strong> particle number concentrations from both bio- and conventional-fuelled vehicles. The terms DPF, ULSD, OCC and RME stands for diesel<br />
particulate filter, ultra low sulphur diesel, oxidation catalytic converter and rapeseed oil methyl ester, respectively.<br />
Source Bio-fuel Bio-fuels emissions e number concentrations Conventional fuel e<br />
number concentrations<br />
Fontaras et al. (2009)<br />
Lee et al. (2009)<br />
Neat soybean-oil derived<br />
bio-diesel<br />
50% v/v blend with<br />
petroleumediesel<br />
Ethanol-blended petrol fuel<br />
(0, 15 and 85% by volume)<br />
Cheng et al. (2008a) Methanol (fumigation 10,<br />
20 and 30%)<br />
1.2e4.5 10 14 #km 1 0.4e2.1 10 14 #km 1<br />
0.6e3 10 14 #km 1<br />
1.35e2.14 10 11 #km 1<br />
1.15 10 7 #cm 3 (10% fumigation;<br />
low load)<br />
0.97 10 7 #cm 3 (20% fumigation;<br />
low load)<br />
0.83 10 7 #cm 3 (30% fumigation;<br />
low load)<br />
1.09 10 7 #cm 3 (10% fumigation;<br />
medium load)<br />
0.90 10 7 #cm 3 (20% fumigation;<br />
medium load)<br />
0.71 10 7 #cm 3 (30% fumigation;<br />
medium load)<br />
2.05 10 7 #cm 3 (10% fumigation;<br />
high load)<br />
1.94 10 7 #cm 3 (20% fumigation;<br />
high load)<br />
1.72 10 7 #cm 3 (30% fumigation;<br />
high load)<br />
(Diesel)<br />
1.09 10 11 #km 1 (Petrol;<br />
eng<strong>in</strong>e with DPF)<br />
4.17 10 13 #km 1 (Petrol;<br />
eng<strong>in</strong>e with non-DPF)<br />
1.42 10 7 #cm 3<br />
(Diesel; low load)<br />
1.22 10 7 #cm 3 (Diesel;<br />
medium load)<br />
1.89 10 7 #cm 3 (Diesel;<br />
high load)<br />
Remarks<br />
Euro 2 diesel passenger<br />
car. Note that <strong>the</strong>se are<br />
approximate values<br />
Petrol eng<strong>in</strong>e<br />
Four-cyl<strong>in</strong>der direct<br />
<strong>in</strong>jection diesel eng<strong>in</strong>e<br />
operat<strong>in</strong>g at low<br />
(0.19 Mpa), medium<br />
(0.38) and high<br />
(0.56 MPa) eng<strong>in</strong>e loads<br />
Cheng et al. (2008b)<br />
Cook<strong>in</strong>g oil derived bio-diesel<br />
tested at low, medium and high<br />
eng<strong>in</strong>e loads<br />
4.92 10 7 #cm 3 (low load) 3.90 10 7 #cm 3 (ULSD;<br />
low load)<br />
5.30 10 7 #cm 3 (medium load) 4.67 10 7 #cm 3 (ULSD;<br />
medium load)<br />
7.23 10 7 #cm 3 (high load) 6.46 10 7 #cm 3 (ULSD;<br />
high load)<br />
Direct <strong>in</strong>jection diesel<br />
eng<strong>in</strong>e at low (0.19<br />
MPa), medium<br />
(0.38 MPa) and high<br />
(0.56 MPa) loads<br />
Tsolakis (2006) RME bio-diesel 1e2.5 10 7 #cm 3 0.5e1.75 10 7 #cm 3 (ULSD) Tested at three steady<br />
operations modes <strong>in</strong> a<br />
s<strong>in</strong>gle cyl<strong>in</strong>der<br />
dieselefuelled eng<strong>in</strong>e<br />
Bunger et al. (2000) RME bio-diesel 1.89 10 5 #cm 3 at 88 nm<br />
(rated power)<br />
1.26 10 5 #cm 3 at 105 nm<br />
(Diesel; rated power)<br />
6.94 10 5 #cm 3 at 79 nm (idl<strong>in</strong>g) 2.56 10 6 #cm 3 at 40 nm<br />
(Diesel; idl<strong>in</strong>g)<br />
Bagley et al. (1998) Soyabean and fatty-acid<br />
8.73e11.2 10 7 #cm 3 (without OCC) 3.48e11.3 10 7 #cm 3<br />
mono-ester derived<br />
(Diesel; eng<strong>in</strong>e without OCC)<br />
bio-diesels (given range<br />
0.85e1.01 10 8 #cm 3 (with OCC) 1.19e5.64 10 8 #cm 3<br />
is for various comb<strong>in</strong>ations<br />
(Diesel; eng<strong>in</strong>e with OCC)<br />
<strong>of</strong> RPM and % eng<strong>in</strong>e loads)<br />
Four-stroke direct<br />
<strong>in</strong>jection diesel eng<strong>in</strong>e<br />
<strong>in</strong> a European test cycle<br />
(ECE R49)<br />
Indirect <strong>in</strong>jection eng<strong>in</strong>e<br />
that was equipped with<br />
and without an OCC<br />
3.2 10 12 # veh 1 km 1 <strong>in</strong> <strong>the</strong> 15e50 nm range. They found that<br />
<strong>the</strong> emission factors for particles (on a number basis) orig<strong>in</strong>at<strong>in</strong>g<br />
from <strong>the</strong> roadetyre <strong>in</strong>teraction were similar <strong>in</strong> magnitude to those<br />
for some classes <strong>of</strong> vehicles us<strong>in</strong>g liquefied petroleum gas fuel. Thus<br />
this source may be a significant contributor to particle number<br />
emissions from both conventionally fuelled and ultra-clean vehicles<br />
(see Section 3.1.3), though <strong>the</strong>re is <strong>in</strong>sufficient <strong>in</strong>formation to<br />
quantify this <strong>in</strong> general.<br />
3.2. Natural sources<br />
The ma<strong>in</strong> natural sources <strong>of</strong> <strong>nanoparticles</strong> <strong>in</strong> many regions <strong>of</strong><br />
<strong>the</strong> world (e.g. Nor<strong>the</strong>rn Europe) are forests, oceans and atmospheric<br />
formation. Particle number concentrations <strong>in</strong> mar<strong>in</strong>e and<br />
forest environments are typically 2e3 orders <strong>of</strong> magnitude smaller<br />
than those <strong>in</strong> <strong>urban</strong> areas. However, given <strong>the</strong> total area covered by<br />
such environments <strong>the</strong>ir contribution towards <strong>the</strong> global nanosized<br />
particle load is never<strong>the</strong>less substantial (O’Dowd et al., 1997).<br />
New particles are formed <strong>in</strong> <strong>the</strong> atmosphere through condensation<br />
<strong>of</strong> semi-volatile organic aerosols (O’Dowd et al., 2002), photochemically<br />
<strong>in</strong>duced nucleation and/or nucleation through gas-toparticle<br />
conversion (Holmes, 2007; Kumar et al., 2009a; Vakeva<br />
et al., 1999). The rates <strong>of</strong> formation and <strong>the</strong> concentrations<br />
atta<strong>in</strong>ed vary, as shown <strong>in</strong> Table 4. The great variability <strong>in</strong> particle<br />
formation and growth rates <strong>in</strong> different environments leads to<br />
significant differences <strong>in</strong> number concentrations and consequent<br />
challenges for <strong>the</strong>ir modell<strong>in</strong>g (Section 5). Episodic contributions<br />
from a number <strong>of</strong> events such as forest fires (Makkonen et al.,<br />
2010), dust storms (Schwikowski et al., 1995) and volcanic eruptions<br />
(Ammann and Burtscher, 1990) may well be very large but<br />
generally are shortelived. These are briefly mentioned here<br />
because <strong>of</strong> <strong>the</strong>ir general relevance and to set <strong>the</strong> discussion <strong>of</strong> <strong>the</strong><br />
<strong>urban</strong> atmosphere <strong>in</strong> context. A full <strong>review</strong> <strong>of</strong> such sources is<br />
however beyond <strong>the</strong> scope <strong>of</strong> this article. Fur<strong>the</strong>r details can be<br />
found <strong>in</strong> Kulmala et al. (2004) and Holmes (2007) and references<br />
<strong>the</strong>re<strong>in</strong>.<br />
Please cite this article <strong>in</strong> press as: Kumar, P., et al., A <strong>review</strong> <strong>of</strong> <strong>the</strong> <strong>characteristics</strong> <strong>of</strong> <strong>nanoparticles</strong> <strong>in</strong> <strong>the</strong> <strong>urban</strong> atmosphere and <strong>the</strong>..., Atmospheric<br />
Environment (2010), doi:10.1016/j.atmosenv.2010.08.016
P. Kumar et al. / Atmospheric Environment xxx (2010) 1e18 7<br />
Table 3<br />
Studies show<strong>in</strong>g shift <strong>in</strong> particle number distributions towards smaller size range when bio-fuels are used.<br />
Source Bio-diesel e mean particle diameters Conventional fuels e mean particle diameters Remarks<br />
Cheng et al. (2008a) 78e87 nm (methanol) 93 nm (diesel) Range <strong>of</strong> mean diameters represent<br />
various tests conducted on low, medium<br />
and high eng<strong>in</strong>e loads<br />
Cheng et al. (2008b) 47e58 nm (cook<strong>in</strong>g-oil<br />
derived bio-diesel)<br />
62e78 nm (ULSD)<br />
Range <strong>of</strong> mean diameters represent various<br />
tests conducted on low, medium and high<br />
eng<strong>in</strong>e loads<br />
Jung et al. (2006)<br />
62 nm (Soymethylester<br />
bio-diesel)<br />
80 nm (diesel) A medium-duty direct <strong>in</strong>jection, 4-cyl<strong>in</strong>der,<br />
turbocharged diesel eng<strong>in</strong>e.<br />
Bunger et al. (2000) 88 nm (RME bio-diesel) 105 nm (diesel) At ‘rated power’ <strong>in</strong> an 4-stroke direct <strong>in</strong>jection<br />
diesel eng<strong>in</strong>e <strong>in</strong> a European test cycle (ECE R49)<br />
40 nm (RME bio-diesel) 79 nm (diesel) At ‘idl<strong>in</strong>g’ <strong>in</strong> an 4-stroke direct <strong>in</strong>jection diesel<br />
eng<strong>in</strong>e <strong>in</strong> a European test cycle (ECE R49)<br />
Bagley et al. (1998)<br />
34e64 (soyabean derived<br />
bio-diesel)<br />
34e50 (soyabean derived<br />
bio-diesel)<br />
57e83 (diesel)<br />
41e94 (diesel)<br />
Tested without an OCC <strong>in</strong> an <strong>in</strong>direct eng<strong>in</strong>e;<br />
range <strong>of</strong> mean diameters represent various<br />
tests conducted on different speed and loads<br />
Tested with an OCC <strong>in</strong> an <strong>in</strong>direct eng<strong>in</strong>e;<br />
range <strong>of</strong> mean diameters represent various<br />
tests conducted on different speed and loads<br />
4. Current state <strong>of</strong> <strong>the</strong> art for nanoparticle number<br />
measurements<br />
Atmospheric <strong>nanoparticles</strong> display a variety <strong>of</strong> shapes (e.g.<br />
tabular, irregular, aggregated or agglomerates), ra<strong>the</strong>r than an ideal<br />
sphere, and this causes difficulty <strong>in</strong> <strong>the</strong>ir measurement. Aerodynamic<br />
equivalent (D a ), Stokes (D s ) or electrical mobility equivalent<br />
(D p ) diameters are used to classify particles when <strong>the</strong> focus is<br />
on <strong>the</strong> behaviour <strong>of</strong> particles <strong>in</strong> mov<strong>in</strong>g air. D a is currently used<br />
with<strong>in</strong> regulatory limits; it is def<strong>in</strong>ed as <strong>the</strong> diameter <strong>of</strong> a spherical<br />
particle <strong>of</strong> unit density (1000 kg m 3 ) and settles <strong>in</strong> <strong>the</strong> air with<br />
a velocity equal to that <strong>of</strong> <strong>the</strong> particle <strong>in</strong> question. D s has a similar<br />
def<strong>in</strong>ition but uses <strong>the</strong> true density <strong>of</strong> <strong>the</strong> particle (H<strong>in</strong>ds, 1999).<br />
The ma<strong>in</strong> concern with us<strong>in</strong>g D s is keep<strong>in</strong>g account <strong>of</strong> <strong>the</strong> density <strong>of</strong><br />
each particle as it moves through <strong>the</strong> atmosphere. D p is widely used<br />
<strong>in</strong> <strong>in</strong>struments and is def<strong>in</strong>ed as <strong>the</strong> diameter <strong>of</strong> a spherical particle<br />
that has <strong>the</strong> same electrical mobility (i.e. a measure <strong>of</strong> <strong>the</strong> ease <strong>in</strong><br />
which a charged particle will be deflected by an electric field) as <strong>the</strong><br />
irregular particle <strong>in</strong> question. It implicitly takes <strong>in</strong>to account <strong>the</strong><br />
particle <strong>characteristics</strong> such as shape, size and density.<br />
A <strong>review</strong> <strong>of</strong> <strong>the</strong> capabilities and limitations <strong>of</strong> most advanced<br />
commercially available <strong>in</strong>struments that are currently used for<br />
nanoparticle monitor<strong>in</strong>g is given below, with Table 5 provid<strong>in</strong>g<br />
a summary <strong>of</strong> <strong>the</strong>ir <strong>characteristics</strong>. The operat<strong>in</strong>g pr<strong>in</strong>ciples <strong>of</strong><br />
Table 4<br />
Typical range <strong>of</strong> particle number concentrations accord<strong>in</strong>g to environment<br />
(exclud<strong>in</strong>g episodic contributions).<br />
Environment Typical number Sources<br />
concentration<br />
range (# cm 3 )<br />
Vehicle wake/exhaust<br />
plumes<br />
10 4 e10 7 Kumar et al. (2009c); Wehner et al.<br />
(2009); M<strong>in</strong>oura et al. (2009)<br />
Urban Street canyons 10 4 e10 6 Wehner et al. (2002); Wahl<strong>in</strong> et al.<br />
(2001); Longley et al. (2004); Kumar<br />
et al. (2008a,b,c, 2009a,c)<br />
Forest regions, remote<br />
cont<strong>in</strong>ental, desert<br />
and rural (or city<br />
background)<br />
Mar<strong>in</strong>e, polar and<br />
free troposphere<br />
10 3 e10 4 Se<strong>in</strong>feld and Pandis (2006); Birmili<br />
et al. (2000); Riip<strong>in</strong>en et al. (2007);<br />
O’Dowd et al. (2002); Kulmala et al.<br />
(2003); Riip<strong>in</strong>en et al. (2007);<br />
Tunved et al. (2006); Pey et al. (2009);<br />
Charron et al. (2008)<br />
10 2 e10 3 Se<strong>in</strong>feld and Pandis (2006); O’Dowd<br />
et al. (2004)<br />
optical, aerodynamic and electrical mobility analysers can be found<br />
<strong>in</strong> Flagan (1998), McMurry (2000a,b) and Simonet and Valcárcel<br />
(2009).<br />
4.1. Scann<strong>in</strong>g mobility particle sizer (SMPS)<br />
The SMPSÔ (TSI Inc. www.tsi.com) system uses an electrical<br />
mobility detection technique to measure number and size distributions.<br />
It consists <strong>of</strong> three components, (i) a bipolar radioactive<br />
charger for charg<strong>in</strong>g <strong>the</strong> particles, (ii) a differential mobility analyser<br />
(DMA) for classify<strong>in</strong>g particles by electrical mobility, and (iii)<br />
a condensation particle counter (CPC) for detect<strong>in</strong>g particles<br />
(Stolzenburg and McMurry, 1991; Wang and Flagan, 1989;<br />
Wiedensohler et al., 1986).<br />
The SMPS (3034 TSI Inc.) measures D p between 10 and 487 nm<br />
us<strong>in</strong>g 54 size channels (32 channels per decade) for number<br />
concentrations <strong>in</strong> <strong>the</strong> range from 10 2 to 10 7 #cm 3 . This model<br />
takes 180 s to analyse a s<strong>in</strong>gle scan. The later SMPS model (3934 TSI<br />
Inc.) uses up to 167 size channels (up to 64 channels per decade) to<br />
measure particle diameters between 2.5 and 1000 nm at<br />
a m<strong>in</strong>imum sampl<strong>in</strong>g time <strong>of</strong> 30 s. Adjust<strong>in</strong>g <strong>of</strong> <strong>the</strong> sampl<strong>in</strong>g flow<br />
rate from 0.2 to 2 l m<strong>in</strong> 1 allows it to measure <strong>the</strong> number<br />
concentrations <strong>in</strong> <strong>the</strong> 1e10 8 #cm 3 range (TSI, 2008). The SMPS is<br />
regarded as a standard <strong>in</strong>strument by which o<strong>the</strong>r ultraf<strong>in</strong>e particle<br />
sizers are compared; though it has its own limitations (see Table 5).<br />
4.2. Electrical low pressure impactor (ELPI)<br />
The ELPIÔ (Dekati Ltd. www.dekati.com) is a real-time particle<br />
size spectrometer with a sampl<strong>in</strong>g time <strong>of</strong> 1 s; <strong>the</strong> <strong>in</strong>strument time<br />
constants be<strong>in</strong>g 2e3 s. It measures number and size distributions <strong>of</strong><br />
particles <strong>in</strong> <strong>the</strong> 0.03e10 mm range, which can be extended down to<br />
7 nm by a backup filter accessory (Kesk<strong>in</strong>en et al., 1992). The ELPI<br />
comb<strong>in</strong>es aerodynamic size classification with particle charg<strong>in</strong>g<br />
and electrical detection <strong>of</strong> charged particles. It operates on three<br />
ma<strong>in</strong> pr<strong>in</strong>ciples: (i) charg<strong>in</strong>g by a corona charger, (ii) <strong>in</strong>ertial classification<br />
us<strong>in</strong>g a low pressure cascade impactor, and (iii) electrical<br />
detection <strong>of</strong> <strong>the</strong> aerosol particles by a multi-channel electrometer<br />
(ELPI, 2009). The impactor collection pr<strong>in</strong>ciple also allows sizedependent<br />
particle analysis us<strong>in</strong>g chemical, scann<strong>in</strong>g electron<br />
microscopy (SEM) or transmission electron microscopy (TEM)<br />
methods. Fur<strong>the</strong>r details <strong>of</strong> <strong>the</strong> ELPI can be found <strong>in</strong> Kesk<strong>in</strong>en et al.<br />
(1992) and Marjamäki et al. (2000).<br />
Please cite this article <strong>in</strong> press as: Kumar, P., et al., A <strong>review</strong> <strong>of</strong> <strong>the</strong> <strong>characteristics</strong> <strong>of</strong> <strong>nanoparticles</strong> <strong>in</strong> <strong>the</strong> <strong>urban</strong> atmosphere and <strong>the</strong>..., Atmospheric<br />
Environment (2010), doi:10.1016/j.atmosenv.2010.08.016
8<br />
P. Kumar et al. / Atmospheric Environment xxx (2010) 1e18<br />
Table 5<br />
Selected features <strong>of</strong> <strong>in</strong>struments for measur<strong>in</strong>g particle number concentrations and distributions (range <strong>of</strong> detectable concentrations and sampl<strong>in</strong>g rates are obta<strong>in</strong>ed through<br />
personal communication between May and July 2009). Note that D a and D p denote aerodynamic equivalent and electrical mobility equivalent diameters, respectively, <strong>in</strong>dicat<strong>in</strong>g<br />
an aerodynamic or electrical mobility type <strong>of</strong> size classification by <strong>the</strong> <strong>in</strong>struments.<br />
Instruments Size range (nm) Sampl<strong>in</strong>g rate (s) Detected diameter Detectable (m<strong>in</strong>emax) concentrations (# cm 3 )<br />
SMPS (model 3034) 10e487 (fixed) 180 (fixed) D p 10 2 e10 7<br />
SMPS (3936 series) 2.5e1000 (variable<br />
and dependent on<br />
configuration)<br />
30 (upwards rate variable) D p 1e10 8<br />
ELPI (with filter) 7e10,000 1 D a 50e1.4 10 7 at 14 nm<br />
0.1e2 10 4 at 8400 nm<br />
ELPI (Standard) 30e10,000 1 D a 250e6.97 10 7 at 42 nm<br />
0.1e2 10 4 at 8400 nm<br />
APS (model 3321) 500e20,000<br />
(aerodynamic siz<strong>in</strong>g)<br />
370e20,000<br />
(optical detection)<br />
1e64,800 (<strong>in</strong> summed mode) D a M<strong>in</strong>imum count e 1<br />
1e300 (<strong>in</strong> average mode) D a Maximum count (without addition <strong>of</strong><br />
diluter model 3302): 10 3 at 0.5 mm with<br />
less than 2% co<strong>in</strong>cidence<br />
20 (default) 10 3 at 10 mm with less than 6% co<strong>in</strong>cidence<br />
DMS500 5e1000 0.1 D p 6671e2.26 10 12 at 5 nm<br />
73e2.71 10 10 at 1000 nm<br />
5e1000 1 D p 1840e2.26 10 12 at 5 nm<br />
20e2.71 10 10 at 1000 nm<br />
5e1000 10 D p 680e2.26 10 12 at 5 nm<br />
9e2.71 10 10 at 1000 nm<br />
5e2500 0.1 D p 7599e2.14 10 12 at 5 nm<br />
47e2.33 10 10 at 2500 nm<br />
5e2500 1 D p 1640e2.14 10 12 at 5 nm<br />
18e2.33 10 10 at 2500 nm<br />
DMS50 a 5e2500 10 D p 588e2.14 10 12 at 5 nm<br />
9e2.33 10 10 at 2500 nm<br />
5e560 0.1 D p 8233e4.97 10 12 at 5 nm<br />
240e1.15 10 11 at 560 nm<br />
5e560 1 D p 4209e4.97 10 12 at 5 nm<br />
140e1.15 10 11 at 560 nm<br />
5e560 10 D p 2628e4.97 10 12 at 5 nm<br />
72e1.15 10 11 at 560 nm<br />
FMPS (model 3091) 5.6e560 1 D p 10 3 e10 8 at 5.6 nm<br />
10 1 e10 6 at 560 nm<br />
UFP Monitor<br />
(model 3031)<br />
20e1000 (upper<br />
limit set by sampl<strong>in</strong>g<br />
<strong>in</strong>let. Size classes pre set)<br />
600 þ 60<br />
(zero<strong>in</strong>g time)<br />
D p<br />
500e10 6 at 20 nm<br />
50e10 6 at 200 nm<br />
LAS (model 3340) 90e7500 1 Wide angle<br />
light scatter<strong>in</strong>g<br />
us<strong>in</strong>g a <strong>in</strong>tracavity laser<br />
GRIMM SMPS þ C 5e1110 1 D p 1e10 7<br />
GRIMM WRAS 5e32,000 1 (CPC); 110 (DMA);<br />
6 (Aerosol Spectrometer)<br />
D p and D a 1e10 7<br />
GRIMM SMPS þ E 0.8e1110 0.2 (T90) D p 100e10 8<br />
a Maximum concentration range assumes maximum dilution used with <strong>the</strong> DMS50.<br />
M<strong>in</strong>imum count zero (as
P. Kumar et al. / Atmospheric Environment xxx (2010) 1e18 9<br />
voltage and pressure. The <strong>in</strong>strument uses primary and secondary<br />
dilution stages. The primary stage is used to dilute <strong>the</strong> sample flow<br />
with compressed air at <strong>the</strong> po<strong>in</strong>t <strong>of</strong> sampl<strong>in</strong>g; this is generally<br />
suitable for ambient measurements. The secondary dilution is used<br />
for <strong>the</strong> sampl<strong>in</strong>g <strong>of</strong> concentrated aerosols (e.g. eng<strong>in</strong>e emissions) to<br />
br<strong>in</strong>g concentrations with<strong>in</strong> <strong>the</strong> dynamic range <strong>of</strong> <strong>the</strong> <strong>in</strong>strument<br />
(Cambustion, 2003-9). A sample flow rate <strong>of</strong> 8 l m<strong>in</strong> 1 is used when<br />
work<strong>in</strong>g <strong>in</strong> <strong>the</strong> 5e1000 nm size range, decreas<strong>in</strong>g to 2.5 l m<strong>in</strong> 1 for<br />
<strong>the</strong> 5e2500 nm size range. Fur<strong>the</strong>r details <strong>of</strong> <strong>the</strong> DM5500 and<br />
comparison <strong>of</strong> its results with o<strong>the</strong>r <strong>in</strong>struments (SMPS and ELPI)<br />
can be found <strong>in</strong> Biskos et al. (2005), Cambustion (2008), Coll<strong>in</strong>gs<br />
et al. (2003) and Symonds et al. (2007).<br />
Cambustion Instruments has recently produced a mobile version<br />
<strong>of</strong> this <strong>in</strong>strument, <strong>the</strong> DMS50, based on <strong>the</strong> same work<strong>in</strong>g pr<strong>in</strong>ciple<br />
as <strong>the</strong> DMS500. The DMS50 can measure D p <strong>in</strong> <strong>the</strong> 5e560 nm range<br />
at a sampl<strong>in</strong>g frequency up to 10 Hz but is considerably smaller and<br />
can be battery operated (Cambustion, 2009).<br />
4.5. Fast mobility particle sizer (FMPS)<br />
The FMPSÔ (model 3091, TSI Inc. www.tsi.com) provides<br />
particle number distribution measurements based on D p up to<br />
a sampl<strong>in</strong>g frequency <strong>of</strong> 1 Hz. It can measure particles <strong>in</strong> <strong>the</strong><br />
5.6e560 nm range us<strong>in</strong>g 32 channels (16 channels per decade <strong>of</strong><br />
size) (see Table 5). A high sample flow rate (10 l m<strong>in</strong> 1 ) helps to<br />
m<strong>in</strong>imise particle sampl<strong>in</strong>g losses due to diffusion (Kumar et al.,<br />
2008d) and operation at ambient pressure prevents evaporation<br />
<strong>of</strong> volatile and semi-volatile particles (TSI, 2009d). It uses an electrical<br />
mobility detection technique similar to that <strong>in</strong> <strong>the</strong> SMPS (see<br />
Section 4.1). As opposed to <strong>the</strong> SMPS, which uses CPC, <strong>the</strong> FMPS<br />
uses multiple, low-noise electrometers for particle detection.<br />
4.6. Ultraf<strong>in</strong>e particle (UFP) monitor<br />
The UFP monitor (model 3031, TSI Inc. www.tsi.com) measures<br />
particle number distributions based on D p at a time resolution <strong>of</strong><br />
10 m<strong>in</strong> with 1 m<strong>in</strong> additional zero<strong>in</strong>g time. It can measure particles<br />
<strong>in</strong> <strong>the</strong> 20e1000 nm range us<strong>in</strong>g 6 size channels at a 5 l m<strong>in</strong> 1<br />
sample flow rate (TSI, 2009d). It is designed for operation <strong>in</strong> a range<br />
<strong>of</strong> meteorological conditions (e.g. temperature 10e40 C, humidity<br />
0e90%, ambient pressures 90e100 kPa) and for unattended long<br />
duration use. It can measure concentrations <strong>in</strong> <strong>the</strong> 500e10 6 #cm 3<br />
range at 20 nm and 50e10 6 #cm 3 range at 200 nm. Fur<strong>the</strong>r details<br />
<strong>of</strong> <strong>the</strong> UFP monitor and comparisons <strong>of</strong> its results with o<strong>the</strong>r<br />
<strong>in</strong>struments can be seen <strong>in</strong> Medved et al. (2000) and TSI (2009b).<br />
4.7. Laser aerosol spectrometer (LAS)<br />
The LAS (model 3340, TSI Inc. www.tsi.com) is a recently commercialised<br />
particle spectrometer. It operates on an optical detection<br />
system us<strong>in</strong>g wide angle optics and an <strong>in</strong>tracavity laser<br />
(McMurry, 2000b) and can measure particles <strong>in</strong> <strong>the</strong> 0.09e7.5 mm<br />
range and concentrations up to 1.8 10 4 #cm 3 at a sample flow<br />
rate 0.1 l m<strong>in</strong> 1 . Size distributions <strong>of</strong> particles can be measured at<br />
a sampl<strong>in</strong>g time <strong>of</strong> about 1 s, with up to 100 user configurable size<br />
range channels (TSI, 2009c).<br />
4.8. GRIMM nanoparticle measur<strong>in</strong>g systems<br />
GRIMM Aerosol Technik (www.grimm-aerosol.com) produces<br />
a number <strong>of</strong> <strong>in</strong>struments that measure particle number concentrations<br />
and distributions us<strong>in</strong>g comb<strong>in</strong>ations <strong>of</strong> SMPS, DMA and CPC<br />
systems. The model SMPC þ C <strong>in</strong>cludes DMA with a CPC to measure<br />
particles <strong>in</strong> <strong>the</strong> 5e1110 nm size range <strong>in</strong> 44 channels. The model<br />
WRAS (wide range aerosol spectrometer) <strong>in</strong>corporates an additional<br />
GRIMM aerosol spectrometer and can measure particles up to 32 mm<br />
with 72 channels. The model GRIMM SMPS þ E is an <strong>in</strong>tegration <strong>of</strong><br />
a DMA and a Faraday Cup Electrometer. It can measure particles <strong>in</strong> <strong>the</strong><br />
0.8e1100 nm <strong>in</strong> 44, 88 or 176 size channels with a very fast sampl<strong>in</strong>g<br />
frequency (T90 response: 0.2 s; T90 is <strong>the</strong> time taken for <strong>the</strong> output to<br />
reach 90% <strong>of</strong> its f<strong>in</strong>al value). The time response and measur<strong>in</strong>g<br />
capacity <strong>of</strong> <strong>the</strong>se <strong>in</strong>struments are summarised <strong>in</strong> Table 5. Detailed<br />
<strong>in</strong>formation can be found <strong>in</strong> GRIMM (2009).<br />
4.9. Analysis <strong>of</strong> <strong>the</strong> capabilities <strong>of</strong> <strong>the</strong> <strong>in</strong>struments and future needs<br />
Table 5 summarises <strong>the</strong> capabilities <strong>of</strong> <strong>the</strong> <strong>in</strong>struments<br />
described above; see also Keogh et al. (2010) for <strong>the</strong> application <strong>of</strong><br />
<strong>the</strong>se <strong>in</strong>struments. Issues that need to be considered <strong>in</strong> us<strong>in</strong>g such<br />
<strong>in</strong>struments <strong>in</strong> any regulatory framework <strong>in</strong>clude <strong>the</strong>ir portability,<br />
time response, detection limits, robustness for unattended operation<br />
over long durations, cost, calibration and ma<strong>in</strong>tenance<br />
requirements. Although most <strong>in</strong>struments claim to overcome many<br />
<strong>of</strong> <strong>the</strong>se issues, reproducibility <strong>of</strong> data still rema<strong>in</strong>s a major issue;<br />
see Asbach et al. (2009) for a comparison <strong>of</strong> a number <strong>of</strong> mobility<br />
analysers. An <strong>in</strong>itiative is needed for evaluat<strong>in</strong>g <strong>the</strong> performance <strong>of</strong><br />
nanoparticle monitor<strong>in</strong>g <strong>in</strong>struments, similar to <strong>the</strong> UN-ECE<br />
Particle Measurement Programme that aims to establish new<br />
systems and protocols for assess<strong>in</strong>g nanoparticle emissions from<br />
vehicles (EU, 2008).<br />
Noise level <strong>of</strong> an <strong>in</strong>strument generally <strong>in</strong>creases with <strong>the</strong><br />
<strong>in</strong>crease <strong>in</strong> sampl<strong>in</strong>g rate. Therefore, selection <strong>of</strong> an appropriate<br />
<strong>in</strong>strument and sampl<strong>in</strong>g frequency critically depends on <strong>the</strong><br />
objectives <strong>of</strong> an <strong>in</strong>dividual study and noise level <strong>of</strong> an <strong>in</strong>strument. A<br />
recent study by Kumar et al. (2009c) concluded that a relatively low<br />
sampl<strong>in</strong>g frequency (i.e. 1 Hz or lower), which can be achieved by<br />
almost all <strong>the</strong> <strong>in</strong>struments mentioned <strong>in</strong> Table 5, would be appropriate<br />
for <strong>urban</strong> measurements unless <strong>the</strong> study rely critically on<br />
fast response data. It will not only improve <strong>the</strong> performance <strong>of</strong> an<br />
<strong>in</strong>strument by reduc<strong>in</strong>g <strong>the</strong> effects <strong>of</strong> it’s noise but will also help to<br />
keep <strong>the</strong> data files <strong>in</strong> more manageable sizes.<br />
Most <strong>in</strong>struments are not capable <strong>of</strong> detect<strong>in</strong>g particles below<br />
3 nm, a size range that is important for secondary particle formation.<br />
Fur<strong>the</strong>r advances <strong>in</strong> performance are needed to address this<br />
deficiency and enable real-time determ<strong>in</strong>ation <strong>of</strong> nanoparticle<br />
physico-chemical properties and related gas phase species <strong>in</strong>volved<br />
<strong>in</strong> nucleation and growth (Kulmala et al., 2004). Development <strong>of</strong><br />
robust and cost-effective <strong>in</strong>struments that have high sampl<strong>in</strong>g<br />
frequencies and cover a wide range <strong>of</strong> particle sizes (from nanoparticle<br />
to PM 10 ) is needed so that <strong>in</strong>dividual and population<br />
exposure to particulate pollution <strong>in</strong> <strong>urban</strong> environments may be<br />
characterised. These capabilities are not currently met by a s<strong>in</strong>gle<br />
particle monitor<strong>in</strong>g <strong>in</strong>strument and use <strong>of</strong> more than one <strong>in</strong>strument<br />
is required to obta<strong>in</strong> such <strong>in</strong>formation.<br />
5. Dispersion modell<strong>in</strong>g <strong>of</strong> <strong>nanoparticles</strong> and associated<br />
challenges<br />
The full range <strong>of</strong> dispersion model types (e.g. Box, Computational<br />
Fluid Dynamics (CFD), Gaussian, Lagrangian, Eulerian) is<br />
available for particulate and gaseous pollutants but only a few are<br />
appropriate for <strong>the</strong> prediction <strong>of</strong> particle number concentrations. A<br />
<strong>review</strong> <strong>of</strong> <strong>the</strong>se models can be found <strong>in</strong> Holmes and Morawska<br />
(2006) and Vardoulakis et al. (2003, 2007). The <strong>in</strong>tention here is<br />
not to describe <strong>the</strong>m <strong>in</strong> any detail but briefly to address <strong>the</strong> challenges<br />
associated with <strong>the</strong>m.<br />
The challenges <strong>in</strong> modell<strong>in</strong>g nanoparticle number concentrations<br />
grow with <strong>the</strong> <strong>in</strong>clusion <strong>of</strong> <strong>the</strong> complex dilution and transformation<br />
processes that occur after <strong>the</strong>ir release <strong>in</strong>to <strong>the</strong><br />
atmosphere (Holmes, 2007; Ketzel and Berkowicz, 2004). Model<br />
Please cite this article <strong>in</strong> press as: Kumar, P., et al., A <strong>review</strong> <strong>of</strong> <strong>the</strong> <strong>characteristics</strong> <strong>of</strong> <strong>nanoparticles</strong> <strong>in</strong> <strong>the</strong> <strong>urban</strong> atmosphere and <strong>the</strong>..., Atmospheric<br />
Environment (2010), doi:10.1016/j.atmosenv.2010.08.016
10<br />
P. Kumar et al. / Atmospheric Environment xxx (2010) 1e18<br />
development and evaluation has been limited by <strong>in</strong>sufficient<br />
measurements <strong>of</strong> number and size distributions (see Section 4) and<br />
lack <strong>of</strong> detailed <strong>in</strong>formation on emission factors. Information on<br />
particle number emission factors (as dist<strong>in</strong>ct from mass) for <strong>in</strong>dividual<br />
types <strong>of</strong> vehicles under a range <strong>of</strong> driv<strong>in</strong>g conditions is not<br />
abundantly available for rout<strong>in</strong>e applications. Studies <strong>of</strong> particle<br />
number emission factors show up to an order <strong>of</strong> magnitude<br />
difference for a given vehicle type under near-identical conditions<br />
(Jones and Harrison, 2006; Keogh et al., 2010; Kumar et al., 2008b).<br />
Such uncerta<strong>in</strong>ty will generally affect <strong>the</strong> predictions <strong>of</strong> any model<br />
to a similar degree. Model <strong>in</strong>ter-comparison studies have been<br />
carried out for ‘conventional’ vehicle emissions (e.g. see Lohmeyer<br />
et al., 2002) but not for particle number concentration prediction.<br />
Currently, <strong>the</strong>re are several particle dispersion models available<br />
that <strong>in</strong>clude particle dynamics e.g. MAT (Ketzel and Berkowicz,<br />
2005) which uses a multi-plume scheme for vertical dispersion<br />
and rout<strong>in</strong>es <strong>of</strong> <strong>the</strong> aerodynamics model AERO3 (Vignati, 1999),<br />
MATCH (Gidhagen et al., 2005) which is an Eulerian grid-po<strong>in</strong>t<br />
model and <strong>in</strong>cludes aerosol dynamics, MONO32 (Pohjola et al.,<br />
2003) and AEROFOR2 (Pirjola and Kulmala, 2001) e both <strong>in</strong>clude<br />
gas-phase chemistry and aerosol dynamical processes. Some<br />
operational models disregard particle dynamics e.g. OSPM<br />
(Berkowicz, 2000) which uses a comb<strong>in</strong>ation <strong>of</strong> a plume model for<br />
<strong>the</strong> direct contribution and a box model for <strong>the</strong> re-circulat<strong>in</strong>g<br />
pollution part <strong>in</strong> <strong>the</strong> street canyon; several o<strong>the</strong>rs are described <strong>in</strong><br />
Holmes and Morawska (2006). Performance evaluation <strong>of</strong> such<br />
particle number concentration models aga<strong>in</strong>st validation data is<br />
essential if <strong>the</strong>y are to be used for develop<strong>in</strong>g mitigation policies.<br />
5.1. Importance <strong>of</strong> transformation and loss processes<br />
<strong>in</strong> dispersion models<br />
Table 6 summarises <strong>the</strong> effect <strong>of</strong> transformation and loss<br />
processes on particle number concentrations. A simple qualitative<br />
description <strong>of</strong> <strong>the</strong> nature <strong>of</strong> any change is <strong>in</strong>cluded. Coagulation acts<br />
to reduce <strong>the</strong> number <strong>of</strong> particles <strong>in</strong> <strong>the</strong> atmosphere (H<strong>in</strong>ds, 1999).<br />
Gidhagen et al. (2005) used a three dimensional Eulerian grid-po<strong>in</strong>t<br />
model for calculat<strong>in</strong>g distributions <strong>of</strong> particle number concentrations<br />
over Stockholm. They found <strong>the</strong> overall loss to be up to 10%<br />
due to coagulation when compared with <strong>in</strong>ert particles. Ketzel and<br />
Berkowicz (2005) observed a similar effect (up to 10% loss) by<br />
coagulation <strong>in</strong> Copenhagen. However, o<strong>the</strong>r studies found <strong>the</strong><br />
effect <strong>of</strong> coagulation too slow to affect number concentrations <strong>in</strong><br />
ei<strong>the</strong>r a car exhaust plume or under typical <strong>urban</strong> conditions<br />
(Pohjola et al., 2003; Zhang and Wexler, 2002).<br />
Nucleation and dilution promote <strong>the</strong> formation <strong>of</strong> new<br />
particles that may <strong>of</strong>fset <strong>the</strong> loss mechanisms. For <strong>in</strong>stance,<br />
Table 6<br />
Transformation and loss processes that modify particle number concentrations <strong>in</strong><br />
<strong>the</strong> atmosphere (Ketzel and Berkowicz, 2004).<br />
Process Sources/S<strong>in</strong>ks Change <strong>in</strong> number<br />
concentrations<br />
Coagulation Collision <strong>of</strong> particles with each o<strong>the</strong>r loss<br />
Condensation Aggregation <strong>of</strong> gaseous phase<br />
none<br />
species onto particle surfaces<br />
Dilution and/or Depend<strong>in</strong>g on <strong>the</strong> concentration <strong>in</strong> ga<strong>in</strong> or loss<br />
mix<strong>in</strong>g <strong>the</strong> dilut<strong>in</strong>g air mass<br />
Dry deposition Removal <strong>of</strong> particles through<br />
loss<br />
surface contact<br />
Evaporation Initially reduction <strong>in</strong> particle size none or loss<br />
that leads to complete loss or a<br />
residual solid core<br />
Nucleation Formation <strong>of</strong> new particles through<br />
gas-to-particle conversion or<br />
photochemical nucleation<br />
ga<strong>in</strong><br />
pseudo-simultaneous measurements <strong>in</strong> a Cambridge street canyon<br />
<strong>in</strong>dicated about a five times greater formation rate <strong>of</strong> new particles<br />
at ro<strong>of</strong>top level than at street level (Kumar et al., 2009a), attributed<br />
to less efficient scaveng<strong>in</strong>g mechanisms (Kerm<strong>in</strong>en et al., 2001) and<br />
favourable conditions for gas-to-particle conversion (Kulmala et al.,<br />
2000) at ro<strong>of</strong>top. O<strong>the</strong>r processes such as condensation and evaporation<br />
have negligible effects (Zhang et al., 2004).<br />
Dry deposition occurs when a particle is removed at an aire<br />
surface <strong>in</strong>terface as a result <strong>of</strong> particle Brownian diffusion. This can<br />
remove <strong>the</strong> smaller particles (i.e. nucleation mode) more efficiently<br />
due to <strong>the</strong>ir higher diffusion coefficient compared with that for<br />
large particles (i.e. accumulation mode). The deposition velocity<br />
will be relatively high for small particles and for high friction<br />
velocities (H<strong>in</strong>ds, 1999). For example, Kumar et al. (2008c) estimated<br />
dry deposition losses <strong>of</strong> vehicle emitted particles onto a road<br />
surface <strong>in</strong> a Cambridge street canyon. The relative removal <strong>of</strong> total<br />
particle number concentrations <strong>in</strong> <strong>the</strong> 10e30 nm range was estimated<br />
to be about 19% larger than <strong>the</strong> particles <strong>in</strong> <strong>the</strong> 30e300 nm<br />
range at <strong>the</strong> road surface compared to concentrations at 1 m above<br />
<strong>the</strong> road level. Likewise, city scale model calculations <strong>in</strong> Stockholm<br />
by Gidhagen et al. (2005) found up to 25% loss <strong>of</strong> total particle<br />
number concentrations <strong>in</strong> about 3e400 nm size range at certa<strong>in</strong><br />
locations, and up to 50% <strong>in</strong> episodic conditions. Dry deposition is<br />
<strong>the</strong>refore an important loss process that can reduce total particle<br />
number concentrations considerably. The effect <strong>of</strong> dry deposition at<br />
various spatial scales should be treated appropriately <strong>in</strong> particle<br />
dispersion models.<br />
Current knowledge is <strong>in</strong>sufficient to describe behaviour <strong>of</strong> transformation<br />
processes at different spatial scales <strong>in</strong> any detail. Therefore<br />
<strong>the</strong> above figures may vary <strong>in</strong> different sett<strong>in</strong>gs; e.g. <strong>in</strong> vehicle-wakes<br />
(Kumar et al., 2009c; M<strong>in</strong>oura et al., 2009), street canyons (Kumar<br />
et al., 2009a; Pohjola et al., 2003), <strong>urban</strong> areas (Wehner et al.,<br />
2002) or globally (Raes et al., 2000). The comb<strong>in</strong>ed effect <strong>of</strong> particle<br />
transformation processes may also vary with sett<strong>in</strong>g and scale<br />
depend<strong>in</strong>g on meteorological conditions, source terms and <strong>the</strong><br />
background concentrations <strong>of</strong> particles and gas phase species.<br />
Does performance <strong>of</strong> dispersion models suffer if particle dynamics<br />
are disregarded? Particle dynamics can probably be neglected for<br />
street scale modell<strong>in</strong>g (Ketzel and Berkowicz, 2004; Kumar et al.,<br />
2008c); e.g. as <strong>in</strong> exist<strong>in</strong>g dispersion models such as OSPM. Recent<br />
work by Kumar et al. (2009b) supports this conclusion. Particle<br />
dynamics were disregarded and particle number concentrations<br />
predicted by us<strong>in</strong>g a modified Box model (Kumar et al., 2009b), OSPM<br />
(Berkowicz, 2000), and <strong>the</strong> CFD code FLUENT (Solazzo et al., 2008).<br />
Particle number concentrations predicted by all three models were<br />
with<strong>in</strong> a factor <strong>of</strong> three <strong>of</strong> <strong>the</strong> measured values. However, a number <strong>of</strong><br />
studies <strong>in</strong>dicate that particle dynamics should be <strong>in</strong>cluded <strong>in</strong> city<br />
scale models where <strong>the</strong>y may affect <strong>the</strong> total number concentrations<br />
considerably (Gidhagen et al., 2005; Ketzel and Berkowicz, 2004;<br />
Ketzel et al., 2003; Kumar et al., 2009a). Changes <strong>in</strong> total particle<br />
number concentrations due to <strong>the</strong> comb<strong>in</strong>ed effects <strong>of</strong> transformation<br />
and loss processes can lie between a loss <strong>of</strong> 13 and 23%<br />
compared to an <strong>in</strong>ert treatment (Ketzel and Berkowicz, 2005).<br />
The above observations highlight a number <strong>of</strong> challenges associated<br />
with dispersion modell<strong>in</strong>g <strong>of</strong> particle number concentrations<br />
and <strong>the</strong> role <strong>of</strong> particle dynamics at various spatial scales. Extensive<br />
measurements <strong>of</strong> nanoparticle concentrations would be helpful <strong>in</strong><br />
evaluat<strong>in</strong>g dispersion model performance and hence support<strong>in</strong>g <strong>the</strong><br />
modell<strong>in</strong>g that is required for <strong>the</strong> evaluation <strong>of</strong> mitigation policies.<br />
6. Effect <strong>of</strong> <strong>nanoparticles</strong> on health and <strong>the</strong> environment<br />
This section summarises recent advances concern<strong>in</strong>g <strong>the</strong> impact<br />
<strong>of</strong> atmospheric <strong>nanoparticles</strong> on human health and <strong>urban</strong> visibility<br />
and highlights some rema<strong>in</strong><strong>in</strong>g research requirements.<br />
Please cite this article <strong>in</strong> press as: Kumar, P., et al., A <strong>review</strong> <strong>of</strong> <strong>the</strong> <strong>characteristics</strong> <strong>of</strong> <strong>nanoparticles</strong> <strong>in</strong> <strong>the</strong> <strong>urban</strong> atmosphere and <strong>the</strong>..., Atmospheric<br />
Environment (2010), doi:10.1016/j.atmosenv.2010.08.016
P. Kumar et al. / Atmospheric Environment xxx (2010) 1e18 11<br />
6.1. Health effects<br />
The ultraf<strong>in</strong>e size range <strong>of</strong> <strong>nanoparticles</strong> has <strong>the</strong> potential for <strong>the</strong><br />
largest deposition rates <strong>in</strong> <strong>the</strong> lungs (Fig. 1). They can enter <strong>the</strong> body<br />
through <strong>the</strong> sk<strong>in</strong>, lung and gastro<strong>in</strong>test<strong>in</strong>al tract and can also<br />
penetrate epi<strong>the</strong>lial cells and accumulate <strong>in</strong> lymph nodes (Nel et al.,<br />
2006). Nemmar et al. (2002) observed that ultraf<strong>in</strong>e particles could<br />
rapidly pass through <strong>the</strong> blood circulation system and accumulate<br />
<strong>in</strong> <strong>the</strong> lungs, liver and bladder. Only about 20% <strong>of</strong> <strong>nanoparticles</strong> are<br />
removed once deposited <strong>in</strong> alveolar regions <strong>in</strong> animal subjects after<br />
24 h exposure, <strong>in</strong> contrast to about 80% removal for particles above<br />
500 nm (Oberdörster et al., 2005b). In related work, Chalupa et al.<br />
(2004) found about 74% deposition <strong>of</strong> carbon ultraf<strong>in</strong>e particles <strong>in</strong><br />
asthmatic human subjects for a 2 h exposure.<br />
A number <strong>of</strong> generic and specific properties (e.g. particle<br />
number or mass concentrations, chemical composition, size,<br />
geometry or surface area) are important <strong>in</strong> characteris<strong>in</strong>g <strong>the</strong><br />
toxicity <strong>of</strong> <strong>nanoparticles</strong> (McCawley, 1990). Nowack and Bucheli<br />
(2007) demonstrate that particle size plays an important role <strong>in</strong><br />
def<strong>in</strong><strong>in</strong>g toxicity but little is known about <strong>the</strong> effects <strong>of</strong> size on<br />
particle behaviour and reactivity. Tetley (2007) notes that some <strong>of</strong><br />
<strong>the</strong> particular properties <strong>of</strong> <strong>nanoparticles</strong> (i.e. high surface reactivity<br />
and ability to cross cell membranes) <strong>in</strong>crease <strong>the</strong>ir negative<br />
health impact. Likewise, Limbach et al. (2007) showed that chemical<br />
composition plays a significant role <strong>in</strong> def<strong>in</strong><strong>in</strong>g effects on<br />
human lung epi<strong>the</strong>lial cells.<br />
Some studies favour particle surface area as a suitable metric to<br />
quantify human exposure whilst many o<strong>the</strong>rs support particle<br />
number concentrations. For example, Maynard and Maynard<br />
(2002) found that <strong>the</strong> higher surface area to mass ratio <strong>of</strong> ultraf<strong>in</strong>e<br />
particles (relative to coarse particle) allows greater contact for<br />
adsorbed compounds to <strong>in</strong>teract with biological surfaces. On <strong>the</strong><br />
o<strong>the</strong>r hand, epidemiological studies discussed below support<br />
number concentration as a metric. Pekkanen et al. (1997) demonstrated<br />
associations between deficits <strong>in</strong> peak expiratory flow<br />
among asthmatic children and exposure to ultraf<strong>in</strong>e particles.<br />
Likewise, o<strong>the</strong>r studies associate this form <strong>of</strong> exposure with<br />
cardiovascular events such as heart attacks and cardiac-rhythm<br />
dist<strong>urban</strong>ce (Nel et al., 2006; Oberdörster et al., 2005a; Seaton et al.,<br />
1999; Wichmann et al., 2000). Pentt<strong>in</strong>en et al. (2001) demonstrated<br />
a negative correlation between <strong>the</strong> ultraf<strong>in</strong>e-dom<strong>in</strong>ated fraction <strong>of</strong><br />
daily mean particle number concentrations and peak expiratory<br />
flow. Similarly, Delf<strong>in</strong>o et al. (2005) showed <strong>in</strong>direct epidemiologic<br />
evidence l<strong>in</strong>k<strong>in</strong>g <strong>the</strong> ultraf<strong>in</strong>e-dom<strong>in</strong>ated fraction <strong>of</strong> fossil-fuel<br />
combustion particles with adverse cardiovascular effects. Peters<br />
et al. (2004), Pope and Dockery (2006), Sioutas et al. (2005) and<br />
Brugge et al. (2007) found that while short-term exposure to<br />
<strong>nanoparticles</strong> exacerbated exist<strong>in</strong>g pulmonary and cardiovascular<br />
disease, long-term repeated exposure <strong>in</strong>creased <strong>the</strong> risk <strong>of</strong><br />
cardiovascular disease and death. Seaton et al. (1995) hypo<strong>the</strong>sised<br />
that <strong>nanoparticles</strong> can penetrate <strong>the</strong> lung wall <strong>in</strong>duc<strong>in</strong>g <strong>in</strong>flammation<br />
that stimulates <strong>the</strong> production <strong>of</strong> clott<strong>in</strong>g factors <strong>in</strong> <strong>the</strong><br />
blood which are responsible for exacerbat<strong>in</strong>g ischemic heart<br />
disease <strong>in</strong> susceptible <strong>in</strong>dividuals. This hypo<strong>the</strong>sis has been fur<strong>the</strong>r<br />
supported by panel studies with coronary heart disease patients<br />
(Ruckerl et al., 2006). Panel studies with patients suffer<strong>in</strong>g from<br />
chronic pulmonary diseases have also been performed <strong>in</strong> Germany,<br />
F<strong>in</strong>land and <strong>the</strong> United K<strong>in</strong>gdom (Ibald-Mulli et al., 2002). Overall,<br />
a decrease <strong>of</strong> peak expiratory flow and an <strong>in</strong>crease <strong>of</strong> daily symptoms<br />
and medication use were found for elevated daily f<strong>in</strong>e and<br />
ultraf<strong>in</strong>e particle concentrations. More recently, Stölzel et al. (2007)<br />
found statistically significant associations between elevated nanoparticle<br />
number concentrations (10e100 nm) and daily total as well<br />
as cardio-respiratory mortality us<strong>in</strong>g time-series epidemiological<br />
analysis. Likewise, several toxicological and panel studies present<br />
similar evidence, favour<strong>in</strong>g number concentrations as an appropriate<br />
metric for assess<strong>in</strong>g health effects (Nel et al., 2006; Peters<br />
et al., 1997; Xia et al., 2009).<br />
Ultraf<strong>in</strong>e particles carry considerable levels <strong>of</strong> tox<strong>in</strong>s that are<br />
expected to <strong>in</strong>duce <strong>in</strong>flammatory responses through reactive<br />
oxygen species or o<strong>the</strong>r mechanisms (Sioutas et al., 2005). Kim<br />
et al. (2002) performed chemical characterisation <strong>of</strong> ambient<br />
ultraf<strong>in</strong>e particles and found that a major fraction comprised<br />
organic and elemental carbon, which is a primary product <strong>of</strong> dieselfuelled<br />
vehicle emissions. Large concentrations <strong>of</strong> such particles are<br />
expected <strong>in</strong> close proximity <strong>of</strong> mobile sources (M<strong>in</strong>oura et al.,<br />
2009), result<strong>in</strong>g <strong>in</strong> <strong>in</strong>creased susceptibility <strong>of</strong> <strong>the</strong> health <strong>of</strong> children<br />
and asthmatic patients (Chalupa et al., 2004; Peters et al.,<br />
1997).<br />
It can be concluded from <strong>the</strong> above discussions that particle<br />
number concentration is an important <strong>in</strong>dicator <strong>of</strong> toxicity, present<strong>in</strong>g<br />
a strong contention for a potential regulatory metric.<br />
Exposure <strong>of</strong> nanoparticle number (or surface area) concentrations<br />
adversely affects human health (Stölzel et al., 2007). When such<br />
particles are <strong>in</strong>haled, <strong>the</strong>ir behaviour differs from coarse particles<br />
as <strong>the</strong>y become more reactive and toxic due to larger surface areas,<br />
lead<strong>in</strong>g to detrimental health effects such as oxidation stress,<br />
pulmonary <strong>in</strong>flammation and cardiovascular events (Buseck and<br />
Adachi, 2008; Nel et al., 2006). To date, understand<strong>in</strong>g <strong>of</strong> <strong>the</strong><br />
exact biological mechanisms through which such particles cause<br />
disease or death are not yet fully understood. This is clearly an area<br />
<strong>of</strong> nanoparticle research that requires more epidemiological and<br />
toxicological evidence.<br />
6.2. Visibility<br />
Visibility impairment is generally caused by a build-up <strong>of</strong> suspended<br />
particles <strong>in</strong> <strong>the</strong> atmosphere (Horvath, 2008). It <strong>in</strong>creases<br />
with relative humidity and atmospheric pressure and decreases<br />
with temperature and w<strong>in</strong>d speed (Tsai, 2005). At high (e.g. 90%)<br />
relative humidity, <strong>the</strong> light scatter<strong>in</strong>g cross-sectional areas <strong>of</strong><br />
particles enlarge by uptake <strong>of</strong> water. For an ammonium sulphate<br />
particle, <strong>the</strong> <strong>in</strong>crease may be by a factor or five or more above that<br />
<strong>of</strong> <strong>the</strong> dry particle (Malm and Day, 2001). In polluted air, light<br />
scatter<strong>in</strong>g by particles (particularly those conta<strong>in</strong><strong>in</strong>g sulphate,<br />
organic carbon and nitrate species) may cause 60e95% <strong>of</strong> overall<br />
visibility reduction, whilst carbon particles (e.g. soot) may<br />
contribute a 5e40% reduction through light absorption (Tang et al.,<br />
1981; Waggoner et al., 1981). For example, Horvath (1994) reported<br />
that particles were responsible for up to 90% <strong>of</strong> light scatter<strong>in</strong>g and<br />
absorption <strong>in</strong> rural areas <strong>of</strong> <strong>the</strong> Austria and up to 99% <strong>in</strong> <strong>urban</strong><br />
areas. In comparison, light absorption and scatter<strong>in</strong>g by gaseous<br />
pollutants is relatively small <strong>in</strong> polluted air (Jacobson, 2005).<br />
Several local to global scale studies have established strong l<strong>in</strong>ks<br />
between visibility impairment and mass concentrations <strong>of</strong> both<br />
PM 2.5 and PM 10 (Chang et al., 2009; Che et al., 2009; Cheng and Tsai,<br />
2000; Noone et al., 1992; Tsai, 2005; Doyale and Dorl<strong>in</strong>g, 2002;<br />
Mahowald et al., 2007). For example, Doyale and Dorl<strong>in</strong>g (2002)<br />
analysed <strong>the</strong> changes <strong>in</strong> visibility over a period between 1950 and<br />
1997 with respect to particles load<strong>in</strong>g with<strong>in</strong> <strong>the</strong> atmosphere <strong>of</strong><br />
eight rural and <strong>urban</strong> locations <strong>in</strong> <strong>the</strong> UK. They reported a strong<br />
association <strong>of</strong> anthropogenically produced and long-range transport<br />
<strong>of</strong> secondary particles (mostly with<strong>in</strong> <strong>the</strong> nanoparticle size<br />
range) with reduction <strong>in</strong> visibility. This was greatest at <strong>urban</strong><br />
locations due to <strong>the</strong> high concentrations <strong>of</strong> atmospheric particles<br />
compared to rural locations, with relative humidity, size and<br />
chemical composition <strong>of</strong> particles also play<strong>in</strong>g important roles.<br />
Particle emissions from diesel-fuelled vehicles contribute more to<br />
visibility impairment than emissions from petrol-fuelled vehicles<br />
as <strong>the</strong>y absorb more light than <strong>the</strong>y scatter (Kittelson, 1998).<br />
Please cite this article <strong>in</strong> press as: Kumar, P., et al., A <strong>review</strong> <strong>of</strong> <strong>the</strong> <strong>characteristics</strong> <strong>of</strong> <strong>nanoparticles</strong> <strong>in</strong> <strong>the</strong> <strong>urban</strong> atmosphere and <strong>the</strong>..., Atmospheric<br />
Environment (2010), doi:10.1016/j.atmosenv.2010.08.016
12<br />
P. Kumar et al. / Atmospheric Environment xxx (2010) 1e18<br />
Trijonis (1984) noticed that elemental carbon emitted from heavyduty<br />
diesel trucks <strong>in</strong> California contributed nearly one-half <strong>of</strong> <strong>the</strong><br />
state wide elemental carbon emissions and about 5e15% <strong>of</strong> <strong>the</strong><br />
state wide visibility reduction.<br />
Nanoparticles play an important role <strong>in</strong> <strong>the</strong> growth <strong>of</strong> coarse<br />
particles and <strong>in</strong> chang<strong>in</strong>g <strong>the</strong>ir chemical and optical properties that<br />
<strong>in</strong>fluence <strong>urban</strong> visibility. Those studies that do relate number<br />
concentrations with visibility are limited to coarse particles. For<br />
<strong>in</strong>stance, a recent study by Mohan and Payra (2009) analysed fog<br />
episodes <strong>in</strong> Delhi (India) and showed an <strong>in</strong>verse correlation<br />
between <strong>urban</strong> visibility and particle number concentrations<br />
between 0.3 and 20 mm. The relative contributions to visibility<br />
improvement from reductions <strong>in</strong> atmospheric nanoparticle<br />
concentrations and <strong>the</strong> degree to which control <strong>of</strong> <strong>the</strong>ir emissions<br />
will br<strong>in</strong>g improvements to <strong>urban</strong> visibility is largely unknown and<br />
requires fur<strong>the</strong>r research.<br />
7. Progress towards <strong>the</strong> regulation <strong>of</strong> atmospheric<br />
nanoparticle concentrations<br />
In 1971, <strong>the</strong> USEPA promulgated <strong>the</strong> first National Ambient Air<br />
Quality Standards for particles <strong>in</strong> <strong>the</strong> atmosphere. The primary<br />
standard was set for total suspended particulates as 260 and<br />
75 mg m 3 for a 24 h and an annual average, respectively. However,<br />
<strong>in</strong> 1987 <strong>the</strong> USEPA revised <strong>the</strong> standards by replac<strong>in</strong>g total suspended<br />
particulates with PM 10 . The numerical values were also<br />
revised and set to 150 and 50 mg m 3 for a 24 h and an annual<br />
average, respectively. Then aga<strong>in</strong> <strong>in</strong> 1997, <strong>the</strong> USEPA revised <strong>the</strong><br />
standards for <strong>the</strong> second time and <strong>in</strong>cluded f<strong>in</strong>e particles (i.e.<br />
PM 2.5 ). In <strong>the</strong> face <strong>of</strong> a widespread challenge to this development,<br />
<strong>the</strong> US Supreme Court upheld <strong>the</strong> USEPA’s decision under <strong>the</strong> Clean<br />
Air Act <strong>in</strong> 2002. Subsequently, <strong>the</strong> PM 10 and PM 2.5 limits were once<br />
more <strong>review</strong>ed and changes made, not to <strong>the</strong> limit values <strong>the</strong>mselves<br />
but to <strong>the</strong> criteria as summarised <strong>in</strong> supplementary Table S.1.<br />
These standards were chosen as <strong>the</strong>y were regarded as be<strong>in</strong>g most<br />
appropriate for particles most likely to reach <strong>the</strong> lung ac<strong>in</strong>us<br />
(Li et al., 1996; Schwartz, 1994, 2000; Seaton et al., 1995). However,<br />
<strong>in</strong> December 2006 <strong>the</strong> USEPA revoked <strong>the</strong> annual PM 10 standard,<br />
due to a lack <strong>of</strong> evidence l<strong>in</strong>k<strong>in</strong>g health problems to long-term<br />
exposure to coarse particle pollution (Moolgavkar, 2005), but<br />
reta<strong>in</strong>ed <strong>the</strong> 24 h standard for PM 10 (see Table S.1).<br />
The European Union (EU) first air quality daughter directive<br />
(1999/30/EC) came <strong>in</strong>to existence <strong>in</strong> 1999. This set ‘Stage-I’ values<br />
for PM 10 at levels <strong>of</strong> 50 and 40 mgm 3 for <strong>the</strong> 24 h and annual mean<br />
values, respectively, to be achieved by <strong>the</strong> member states <strong>of</strong> <strong>the</strong><br />
European Community (EC) by <strong>the</strong> 1st <strong>of</strong> January 2006. The directive<br />
also <strong>in</strong>dicated equivalent ‘Stage-II’ values for PM 10 at 50 and<br />
20 mg m 3 for 24 h and annual mean values, respectively, with<br />
a target date <strong>of</strong> 1st <strong>of</strong> January 2010. In September 2005, <strong>the</strong> EU<br />
contemplated its first ever limit for PM 2.5 . This moved a step closer<br />
<strong>in</strong> May 2008 when a non-b<strong>in</strong>d<strong>in</strong>g target value for PM 2.5 <strong>in</strong> 2010 was<br />
superseded by a b<strong>in</strong>d<strong>in</strong>g limit value <strong>in</strong> 2015 (25 mg m 3 annual<br />
average for both target and limit values).<br />
In 2005, <strong>the</strong> EU adopted <strong>the</strong> “Thematic Strategy on Air Pollution”<br />
as a consequence <strong>of</strong> <strong>the</strong> “Clean Air for Europe” program. This<br />
strategy calls for member countries to <strong>in</strong>crease <strong>the</strong>ir research<br />
activities <strong>in</strong> <strong>the</strong> fields <strong>of</strong> atmospheric chemistry and <strong>the</strong> distribution<br />
<strong>of</strong> pollutants, and to identify <strong>the</strong> impact <strong>of</strong> air pollution on<br />
human health and <strong>the</strong> environment. In July 2008, <strong>the</strong> UK Department<br />
<strong>of</strong> Transport proposed an emission standard<br />
(6 10 11 #km 1 )onanumber basis for light and heavy duty<br />
compression ignition vehicles through <strong>the</strong>ir UN-ECE Particle<br />
Measurement Programme (Park<strong>in</strong>, 2008). These limits were<br />
subsequently agreed for <strong>in</strong>clusion <strong>in</strong> Euro-5 and Euro-6 emission<br />
standards (Table S.2), to become effective from 1st September 2011<br />
for <strong>the</strong> approval <strong>of</strong> new types <strong>of</strong> vehicles and from 1st January 2013<br />
for all new vehicles sold, registered or put <strong>in</strong>to service <strong>in</strong> <strong>the</strong><br />
Community (EU, 2008). The Particle Measurement Programme<br />
focuses on <strong>the</strong> development <strong>of</strong> new approaches to replace or<br />
complement exist<strong>in</strong>g mass-based regulatory limits for vehicles and<br />
concentrates on <strong>the</strong> 23e2500 nm size range <strong>of</strong> solid particles.<br />
At present, <strong>the</strong>re are no legal thresholds for nanoparticle<br />
number concentrations <strong>in</strong> ambient air and <strong>the</strong>refore local observation<br />
networks do not generally monitor <strong>the</strong>m. A number <strong>of</strong><br />
technical and practical matters have limited <strong>the</strong> development <strong>of</strong><br />
ambient particle regulations on a number basis. One <strong>of</strong> <strong>the</strong> ma<strong>in</strong><br />
technical constra<strong>in</strong>ts is <strong>the</strong> lack <strong>of</strong> standard methods and <strong>in</strong>strumentation,<br />
and <strong>the</strong> uncerta<strong>in</strong>ties <strong>in</strong> repeatability and reproducibility<br />
<strong>in</strong> measurements (see Section 4). Practical constra<strong>in</strong>ts<br />
<strong>in</strong>clude lack <strong>of</strong> sufficient long-term monitor<strong>in</strong>g studies that<br />
<strong>in</strong>clude measurements <strong>of</strong> nanoparticle concentrations and size<br />
distributions, <strong>in</strong>sufficient <strong>in</strong>formation on dispersion and transformation<br />
behaviour, a shortage <strong>of</strong> toxicological and epidemiological<br />
evidence (see Section 6.1). Never<strong>the</strong>less, it is acknowledged<br />
that mass based particle concentration limits do not effectively<br />
control <strong>the</strong> smaller particles that can readily penetrate <strong>the</strong> alveoli<br />
region (Oberdörster et al., 2005a). Therefore, metrics such as<br />
particle number concentrations may be considered with<strong>in</strong> future<br />
air quality regulation.<br />
8. Discussion and future research<br />
This <strong>review</strong> has covered <strong>the</strong> <strong>characteristics</strong> and sources <strong>of</strong><br />
ambient <strong>nanoparticles</strong>, <strong>the</strong> <strong>in</strong>strumentation available for <strong>the</strong>ir<br />
measurements, <strong>the</strong>ir modell<strong>in</strong>g, environmental and health<br />
impacts, and regulatory implications.<br />
The lognormal distribution is a good fit to <strong>the</strong> size distribution<br />
over a wide particle size range <strong>in</strong> <strong>the</strong> nucleation, Aitken, accumulation<br />
and coarse modes. Each mode reflects particular <strong>characteristics</strong>,<br />
<strong>in</strong>dicat<strong>in</strong>g sources, chemical composition and sensitivity to<br />
particle dynamics. The size ranges quoted for <strong>the</strong>se modes <strong>of</strong>ten<br />
vary (Section 2), but it is generally agreed that about 80% <strong>of</strong> total<br />
particles, by number, reside <strong>in</strong> first two modes.<br />
Ambient <strong>nanoparticles</strong> derive from natural and anthropogenic<br />
sources. Road vehicles are <strong>the</strong> dom<strong>in</strong>ant source <strong>in</strong> <strong>urban</strong> areas and<br />
can raise nanoparticle concentrations by up to three orders <strong>of</strong><br />
magnitude above <strong>the</strong> typical levels <strong>in</strong> natural environments<br />
(Section 3). Bio-fuels are seen as an alternate fuel option for<br />
controll<strong>in</strong>g vehicle emissions. Their use is be<strong>in</strong>g encouraged as<br />
a part <strong>of</strong> <strong>in</strong>ternational energy policies and to ga<strong>in</strong> social, economic<br />
and environmental benefits. The latter are clear as bio-fuelled<br />
driven vehicles emit far less particulate mass and gaseous pollutants<br />
than conventionally fuelled vehicles, all else be<strong>in</strong>g equal.<br />
Similar benefits do not seem to be achieved <strong>in</strong> terms <strong>of</strong> nanoparticle<br />
number emissions (Section 3). In some <strong>in</strong>stances <strong>the</strong>se can<br />
fail to satisfy <strong>the</strong> number based limits for vehicles enacted <strong>in</strong> Euro<br />
emission standards, unless, for example, an appropriate emission<br />
control system or alternative measures are applied (Grose et al.,<br />
2006; Mohr et al., 2006). Moreover, <strong>the</strong>re are still several unanswered<br />
technical and social issues perta<strong>in</strong><strong>in</strong>g to <strong>the</strong> use <strong>of</strong> bio-fuels,<br />
<strong>in</strong>clud<strong>in</strong>g (i) a lack <strong>of</strong> adequate knowledge about <strong>the</strong>ir effect on<br />
eng<strong>in</strong>e ma<strong>in</strong>tenance, efficiency and emissions, and (ii) <strong>the</strong> social<br />
challenges associated with food security and water footpr<strong>in</strong>t<br />
(Dom<strong>in</strong>guez-Faus et al., 2009).<br />
Manufactured <strong>nanoparticles</strong> are emerg<strong>in</strong>g as an important class<br />
<strong>of</strong> ambient particles and substantial <strong>in</strong>creases <strong>in</strong> <strong>the</strong>ir use <strong>in</strong><br />
nanomaterials <strong>in</strong>tegrated products are predicted. Currently, <strong>the</strong>re is<br />
little knowledge <strong>of</strong> <strong>the</strong> background concentrations and distributions<br />
(on a number basis) <strong>of</strong> <strong>the</strong>se particles <strong>in</strong> <strong>the</strong> atmosphere.<br />
Moreover, <strong>the</strong>ir sources, emission routes, exposure pathways and<br />
Please cite this article <strong>in</strong> press as: Kumar, P., et al., A <strong>review</strong> <strong>of</strong> <strong>the</strong> <strong>characteristics</strong> <strong>of</strong> <strong>nanoparticles</strong> <strong>in</strong> <strong>the</strong> <strong>urban</strong> atmosphere and <strong>the</strong>..., Atmospheric<br />
Environment (2010), doi:10.1016/j.atmosenv.2010.08.016
P. Kumar et al. / Atmospheric Environment xxx (2010) 1e18 13<br />
potential to affect <strong>the</strong> environment and human health are poorly<br />
understood. Current knowledge <strong>of</strong> <strong>the</strong>ir physico-chemical <strong>characteristics</strong>,<br />
toxicity, release paths (<strong>in</strong>tentional and/or un<strong>in</strong>tentional),<br />
sizes, atmospheric life time and degradability suggests that <strong>the</strong>ir<br />
concentrations <strong>in</strong> ambient air (exclud<strong>in</strong>g areas associated with<br />
<strong>the</strong>ir production or use) are expected to be considerably lower than<br />
for o<strong>the</strong>r <strong>nanoparticles</strong> but that, never<strong>the</strong>less, may have substantial<br />
impact on health and <strong>the</strong> environment (Andujar et al., 2009). Many<br />
aspects <strong>of</strong> airborne manufactured <strong>nanoparticles</strong> need thorough<br />
study to enable appropriate controls to be established, both for <strong>the</strong><br />
<strong>in</strong>door (residential, places <strong>of</strong> production, etc.) and ambient environments,<br />
that can be <strong>in</strong>tegrated appropriately <strong>in</strong>to potential<br />
regulatory frameworks for ambient <strong>nanoparticles</strong>.<br />
A number <strong>of</strong> advanced <strong>in</strong>struments have emerged for measur<strong>in</strong>g<br />
number concentrations and size distributions, though standard<br />
application guidel<strong>in</strong>es and methods are lack<strong>in</strong>g. Standardis<strong>in</strong>g<br />
<strong>in</strong>strument use is a major scientific issue that needs to be resolved<br />
before regulations can be reliably imposed for controll<strong>in</strong>g atmospheric<br />
<strong>nanoparticles</strong>. Instrument <strong>characteristics</strong> and <strong>the</strong> capabilities<br />
for automatic data logg<strong>in</strong>g should <strong>in</strong>form <strong>the</strong> design <strong>of</strong><br />
regulatory methods so that data accurately describes local conditions<br />
on appropriate time scales. Most available <strong>in</strong>struments are<br />
<strong>in</strong>capable <strong>of</strong> measur<strong>in</strong>g particles below 3 nm <strong>in</strong> diameter e a size<br />
range that is crucial <strong>in</strong> <strong>the</strong> formation <strong>of</strong> secondary atmospheric<br />
particles. Fur<strong>the</strong>r advances <strong>in</strong> <strong>in</strong>strumentation are desired to<br />
address this deficiency and enable real-time determ<strong>in</strong>ation <strong>of</strong><br />
physico-chemical properties and <strong>the</strong> related gas phase species to<br />
understand particle transformation processes and <strong>the</strong>ir modell<strong>in</strong>g<br />
<strong>in</strong> more detail e both be<strong>in</strong>g important for develop<strong>in</strong>g regulatory<br />
controls.<br />
O<strong>the</strong>r technical issues concern <strong>the</strong> metric used to characterise<br />
particle diameter (aerodynamic equivalent, D a , or electrical<br />
mobility equivalent, D p ), <strong>the</strong> appropriate sampl<strong>in</strong>g frequencies and<br />
<strong>the</strong> adequacy <strong>of</strong> corrections for particle losses <strong>in</strong> sampl<strong>in</strong>g tubes.<br />
The existence <strong>of</strong> sources <strong>of</strong> high nanoparticle number concentrations<br />
that are localised <strong>in</strong> time and space (e.g. motor vehicles),<br />
coupled with imperfect mix<strong>in</strong>g, may result <strong>in</strong> local concentrations<br />
that vary greatly over time scales <strong>of</strong> a few seconds. To measure such<br />
a concentration accurately <strong>in</strong> a range <strong>of</strong> environments requires an<br />
<strong>in</strong>strument with a fast response to avoid sampl<strong>in</strong>g artefacts <strong>in</strong> <strong>the</strong><br />
data. Instruments measur<strong>in</strong>g particles based on D p may be preferable<br />
to those measur<strong>in</strong>g D a as <strong>the</strong> aerodynamic measure can be<br />
adversely affected by particle <strong>characteristics</strong> (such as size, shape<br />
and density), as most <strong>of</strong> <strong>the</strong> particles <strong>in</strong> <strong>the</strong> accumulation mode are<br />
non-spherical agglomerates (H<strong>in</strong>ds, 1999; Park et al., 2003). When<br />
attempt<strong>in</strong>g to measure non-spherical particles <strong>of</strong> known density,<br />
<strong>the</strong> shape and orientation <strong>of</strong> each particle subjected to <strong>the</strong> accelerat<strong>in</strong>g<br />
airflow governs <strong>the</strong> drag force it experiences and hence<br />
affects <strong>the</strong> measured aerodynamic size (Secker et al., 2001).<br />
However, measurements <strong>of</strong> number distributions based on any<br />
def<strong>in</strong>ition <strong>of</strong> particle diameter may not differ significantly but <strong>the</strong>ir<br />
mass distributions do because <strong>the</strong> density <strong>of</strong> accumulation mode<br />
particles changes rapidly with <strong>in</strong>creased particle diameter (Park<br />
et al., 2003). Ano<strong>the</strong>r common but somewhat neglected issue is<br />
<strong>the</strong> adequate correction for particle losses <strong>in</strong> sampl<strong>in</strong>g tubes. The<br />
limited number <strong>of</strong> studies that have addressed this suggest that<br />
<strong>in</strong>appropriate correction (or neglect <strong>of</strong> correction) for such losses<br />
may significantly affect <strong>the</strong> measured number distributions (Kumar<br />
et al., 2008d; Noble et al., 2005; Timko et al., 2009). This issue,<br />
along with those mentioned above, should be considered while<br />
develop<strong>in</strong>g a framework for <strong>the</strong> monitor<strong>in</strong>g and control <strong>of</strong> atmospheric<br />
<strong>nanoparticles</strong>.<br />
Suitable modell<strong>in</strong>g tools for <strong>the</strong> prediction <strong>of</strong> nanoparticle<br />
concentrations are required for <strong>the</strong> evaluation <strong>of</strong> mitigation policies.<br />
At present, <strong>the</strong> development <strong>of</strong> dispersion modell<strong>in</strong>g faces<br />
several challenges, such as a lack <strong>of</strong> suitable experimental datasets<br />
for evaluation purposes, potentially <strong>in</strong>adequate <strong>in</strong>put <strong>in</strong>formation<br />
(i.e. emission factors) and <strong>in</strong>sufficient knowledge for treat<strong>in</strong>g<br />
particle dynamics at all relevant scales. Toge<strong>the</strong>r, <strong>the</strong>se factors<br />
result <strong>in</strong> <strong>in</strong>consistency <strong>in</strong> <strong>the</strong> results from particle number<br />
concentration models. Laboratory and computational dynamics<br />
studies, coupled with long-term field measurements (<strong>in</strong>clud<strong>in</strong>g<br />
number and size distributions), are needed for <strong>the</strong> development<br />
and validation <strong>of</strong> reliable nanoparticle dispersion models.<br />
Although it is difficult to separate <strong>the</strong> effects <strong>of</strong> <strong>nanoparticles</strong><br />
from those <strong>of</strong> o<strong>the</strong>r pollutants and larger particles (Harrison and<br />
Y<strong>in</strong>, 2000; Osunsanya et al., 2001), epidemiological studies<br />
suggest that <strong>the</strong>re are health effects <strong>of</strong> f<strong>in</strong>e and <strong>nanoparticles</strong> which<br />
might be <strong>in</strong>dependent <strong>of</strong> each o<strong>the</strong>r (Ibald-Mulli et al., 2002). A<br />
number <strong>of</strong> studies associate high number concentrations <strong>in</strong> <strong>the</strong><br />
ultraf<strong>in</strong>e size range with adverse health effects and <strong>the</strong>re are also<br />
global climate and <strong>urban</strong> visibility impacts. Despite considerable<br />
toxicological evidence <strong>of</strong> <strong>the</strong> potential detrimental effects <strong>of</strong> <strong>the</strong>se<br />
particles on human health, <strong>the</strong> appropriate metric for evaluat<strong>in</strong>g<br />
health effects is still not clear. The exist<strong>in</strong>g body <strong>of</strong> epidemiological<br />
evidence is thought to be <strong>in</strong>sufficient to def<strong>in</strong>e <strong>the</strong> exposureeresponse<br />
relationship. Never<strong>the</strong>less, recent studies suggest that<br />
amongst o<strong>the</strong>r <strong>characteristics</strong>, particle number concentrations are<br />
an important <strong>in</strong>dicator <strong>of</strong> <strong>the</strong>ir toxicity. This implies that size<br />
distribution <strong>in</strong>formation for <strong>the</strong> entire nanoparticle size range<br />
could enhance our ability to assess potential health effects. The<br />
measurement <strong>of</strong> size distributions is thus an important matter that<br />
should be considered <strong>in</strong> potential regulatory frameworks. Whe<strong>the</strong>r<br />
number concentration based limits should address only <strong>the</strong> ultraf<strong>in</strong>e<br />
size range or <strong>the</strong> whole nanoparticle range is not clear. Perhaps,<br />
cover<strong>in</strong>g <strong>the</strong> nanoparticle size range would be a preferable option<br />
as this comprises nearly all <strong>the</strong> particle number population <strong>in</strong> <strong>the</strong><br />
ambient environment.<br />
Nanoparticles are major precursors <strong>of</strong> larger particles, as <strong>the</strong>y<br />
promote <strong>the</strong>ir growth and modify <strong>the</strong>ir optical properties, <strong>the</strong>reby<br />
affect<strong>in</strong>g <strong>the</strong> radiative properties <strong>of</strong> <strong>the</strong> atmosphere. The over<br />
effects <strong>of</strong> <strong>the</strong> nanoparticle size range on global climate cannot<br />
currently be determ<strong>in</strong>ed with any accuracy. It is generally believed<br />
that aerosol particles <strong>in</strong>duce a net negative radiative forc<strong>in</strong>g <strong>of</strong><br />
1.2 W m 2 which is a comb<strong>in</strong>ation <strong>of</strong> direct ( 0.5 W m 2 ) and<br />
<strong>in</strong>direct ( 0.7 W m 2 ) effects (IPCC, 2007), mean<strong>in</strong>g that half <strong>of</strong> <strong>the</strong><br />
present global warm<strong>in</strong>g from greenhouse gases (þ2.5 W m 2 ;<br />
Jacobson, 2001) might be masked by <strong>the</strong> effects <strong>of</strong> aerosol particles.<br />
On <strong>the</strong> o<strong>the</strong>r hand, carbonaceous particles (e.g. soot) are considered<br />
to be one <strong>of</strong> <strong>the</strong> major contributors to global warm<strong>in</strong>g (i.e.<br />
þ0.34 W m 2 ; IPCC, 2007). Their radiative forc<strong>in</strong>g can <strong>in</strong>crease to<br />
about þ0.6 W m 2 if <strong>the</strong> particles are coated with sulphate or<br />
organic compounds, as is common <strong>in</strong> ambient atmosphere (Chung<br />
and Se<strong>in</strong>field, 2005). This impact, toge<strong>the</strong>r with health and environmental<br />
issues (e.g. acid ra<strong>in</strong>, stratospheric ozone depletion<br />
(Soden et al., 2002)) associated directly or <strong>in</strong>directly with atmospheric<br />
<strong>nanoparticles</strong> illustrates <strong>the</strong> need for suitable regulatory<br />
control.<br />
Visibility impairment has a quite well established l<strong>in</strong>k with <strong>the</strong><br />
light ext<strong>in</strong>ction e scatter<strong>in</strong>g and absorption e properties (e.g.<br />
hygroscopic or hydrophobic nature; Noone et al. (1992), size,<br />
chemical composition and concentrations) <strong>of</strong> coarse atmospheric<br />
particles (Che et al., 2009; Cheng and Tsai, 2000). However, <strong>the</strong> role<br />
<strong>of</strong> <strong>nanoparticles</strong> <strong>in</strong> visibility impairment is still unclear. That <strong>the</strong>se<br />
particles account for an appreciable number fraction <strong>of</strong> <strong>the</strong> carbon<br />
and sulphate particles emitted from diesel vehicles and that <strong>the</strong>se<br />
particles contribute considerably to visibility reduction, suggests<br />
that <strong>the</strong>y play an <strong>in</strong>direct role <strong>in</strong> visibility impairment. That be<strong>in</strong>g<br />
so, improved understand<strong>in</strong>g <strong>of</strong> <strong>nanoparticles</strong> role <strong>in</strong> visibility<br />
impairment is essential.<br />
Please cite this article <strong>in</strong> press as: Kumar, P., et al., A <strong>review</strong> <strong>of</strong> <strong>the</strong> <strong>characteristics</strong> <strong>of</strong> <strong>nanoparticles</strong> <strong>in</strong> <strong>the</strong> <strong>urban</strong> atmosphere and <strong>the</strong>..., Atmospheric<br />
Environment (2010), doi:10.1016/j.atmosenv.2010.08.016
14<br />
P. Kumar et al. / Atmospheric Environment xxx (2010) 1e18<br />
Currently, <strong>the</strong>re is no legal threshold for controll<strong>in</strong>g number<br />
concentrations <strong>of</strong> airborne <strong>nanoparticles</strong> and present mass-based<br />
regulations for atmospheric particulate matter are <strong>in</strong>sufficient for<br />
<strong>the</strong>ir control. Recent Euro-5 and Euro-6 vehicle emission standards<br />
<strong>in</strong>clude number based limits for <strong>nanoparticles</strong> (EU, 2008), which is<br />
a positive step <strong>in</strong>itiated by <strong>the</strong> emissions control community.<br />
Similar <strong>in</strong>itiatives are needed to control public exposure to atmospheric<br />
particles but <strong>the</strong>ir development is h<strong>in</strong>dered by <strong>the</strong> technical<br />
and practical issues discussed <strong>in</strong> Section 7. Despite <strong>the</strong>se challenges,<br />
understand<strong>in</strong>g <strong>of</strong> ambient <strong>nanoparticles</strong> (e.g. dispersion<br />
behaviour, characterisation and secondary formation) and capabilities<br />
for <strong>the</strong>ir measurement have <strong>in</strong>creased considerably <strong>in</strong><br />
recent years. These advances should play a pivotal role <strong>in</strong> support<strong>in</strong>g<br />
<strong>the</strong> establishment <strong>of</strong> regulatory frameworks that focus on<br />
a number basis. In l<strong>in</strong>e with <strong>the</strong>se advances, <strong>urban</strong> air quality<br />
monitor<strong>in</strong>g networks should be encouraged to <strong>in</strong>clude nanoparticle<br />
number and size distribution measurements <strong>in</strong> <strong>the</strong>ir air pollution<br />
monitor<strong>in</strong>g programmes. Such observations can provide <strong>the</strong> data<br />
that will help address <strong>the</strong> questions summarised above, as well as<br />
enable <strong>the</strong> comprehensive validation <strong>of</strong> particle dispersion models.<br />
Acknowledgements<br />
The authors thank Jonathon Symonds (Cambustion Instruments),<br />
Mark Crooks and Kathy Erickson (both from TSI Incorporates),<br />
Ville Niemela (Dekati Ltd.) and Chris Tyrrell (GRIMM Aerosol<br />
UK Ltd.) for provid<strong>in</strong>g useful <strong>in</strong>formation on <strong>in</strong>strument <strong>characteristics</strong>.<br />
PK thanks <strong>the</strong> EPSRC (grant EP/H026290/1) for support<strong>in</strong>g<br />
his research on atmospheric <strong>nanoparticles</strong>. He also thanks Kosha<br />
Joshi, Rav<strong>in</strong>dra Khaiwal and Paul Fennell for editorial suggestions.<br />
Rex Britter was funded <strong>in</strong> part by <strong>the</strong> S<strong>in</strong>gapore National Research<br />
Foundation (NRF) through <strong>the</strong> S<strong>in</strong>gapore-MIT Alliance for Research<br />
and Technology (SMART) Center for Environmental Sens<strong>in</strong>g and<br />
Model<strong>in</strong>g (CENSAM).<br />
Appendix. Supplementary material<br />
Supplementary data associated with this article can be found <strong>in</strong><br />
<strong>the</strong> onl<strong>in</strong>e version at doi:10.1016/j.atmosenv.2010.08.016.<br />
References<br />
Aakko, P., Nylund, N.O., Westerholm, M., Marjama ki, M., Moisio, M., Hillamo, R.,<br />
2002. Emissions from heavy-duty eng<strong>in</strong>e with and without after treatment<br />
us<strong>in</strong>g selected bi<strong>of</strong>uels. In: FISITA 2002 World Automotive Congress Proceed<strong>in</strong>gs,<br />
F02E195.<br />
Aatmeeyata, Kaul, D.S., Sharma, M., 2009. Traffic generated non-exhaust particulate<br />
emissions from concrete pavement: a mass and particle size study for twowheelers<br />
and small cars. Atmospheric Environment 43, 5691e5697.<br />
Agarwal, J.K., Remiarz, R.J., 1981. Development <strong>of</strong> an Aerodynamic Particle Size<br />
Analyzer. Contract Report No. 210-80-0800. NIOSH, C<strong>in</strong>c<strong>in</strong>nati OH.<br />
Agarwal, A.K., 2007. Bi<strong>of</strong>uels (alcohols and biodiesel) applications as fuels for<br />
<strong>in</strong>ternal combustion eng<strong>in</strong>es. Progress <strong>in</strong> Energy and Combustion Science 33,<br />
233e271.<br />
Agus, E.L., Young, D.T., L<strong>in</strong>gard, J.J.N., Smalley, R.J., Tate, E.J., Goodman, P.S.,<br />
Toml<strong>in</strong>, A.S., 2007. Factors <strong>in</strong>fluenc<strong>in</strong>g particle number concentrations, size<br />
distributions and modal parameters at a ro<strong>of</strong>-level and roadside site <strong>in</strong><br />
Leicester, UK. Science <strong>of</strong> <strong>the</strong> Total Environment 386, 65e82.<br />
Ammann, M., Burtscher, H., 1990. Characterization <strong>of</strong> ultraf<strong>in</strong>e aerosol particles <strong>in</strong><br />
Mt. Etna emissions. Bullet<strong>in</strong> <strong>of</strong> Volcanology 52, 577e583.<br />
Anastasio, C., Mart<strong>in</strong>, S.T., 2001. Atmospheric <strong>nanoparticles</strong>. In: Banfield, J.F.,<br />
Navrotsky, A. (Eds.), Nanoparticles and <strong>the</strong> Environment, vol. 44. M<strong>in</strong>eralogical<br />
Society <strong>of</strong> America, pp. 293e349.<br />
Andujar, P., Lanone, S., Brochard, P., Boczkowski, J., 2009. Respiratory effects <strong>of</strong><br />
manufactured <strong>nanoparticles</strong>. Revue Des Maladies Respiratoires 26, 625e637.<br />
AQEG, 1999. Source apportionment <strong>of</strong> airborne particulate matter <strong>in</strong> <strong>the</strong> United<br />
K<strong>in</strong>gdom. Report <strong>of</strong> <strong>the</strong> Airborne Particles Expert Group pp. 158.http://www.<br />
environment.detr.gov.uk/airq/<br />
AQEG, 2005. Particulate Matter <strong>in</strong> <strong>the</strong> United K<strong>in</strong>gdom. AQEG, Defra, London.<br />
Asbach, C., Kam<strong>in</strong>ski, H., Fissan, H., Monz, C., Dahmann, D., Mülhopt, S., Paur, H.R.,<br />
Kiesl<strong>in</strong>g, H.J., Herrmann, F., Voetz, M., Kuhlbusch, T.A.J., 2009. Comparison <strong>of</strong><br />
four mobility particle sizers with different time resolution for stationary<br />
exposure measurements. Journal <strong>of</strong> Nanoparticle Research 11, 1593e1609.<br />
Bagley, S.T., Gratz, L.D., Johnson, J.H., McDonald, J.F., 1998. Effects <strong>of</strong> an oxidation<br />
catalytic converter and a biodiesel fuel on <strong>the</strong> chemical, mutagenic, and particle<br />
size <strong>characteristics</strong> <strong>of</strong> emissions from a diesel eng<strong>in</strong>e. Environmental Science<br />
and Technology 32, 1183e1191.<br />
Balat, M., Balat, H., 2009. Recent trends <strong>in</strong> global production and utilization <strong>of</strong> bioethanol<br />
fuel. Applied Energy 86, 2273e2282.<br />
Basha, S.A., Gopal, K.R., Jebaraj, S., 2009. A <strong>review</strong> on biodiesel production,<br />
combustion, emissions and performance. Renewable and Susta<strong>in</strong>able Energy<br />
Reviews 13, 1628e1634.<br />
Berkowicz, R., 2000. Operational street pollution model e a parameterized street<br />
pollution model. Environmental Monitor<strong>in</strong>g and Assessment 65, 323e331.<br />
Birmili, W., Stratmann, F., Weidensohler, A., 2000. New particle formation <strong>in</strong> <strong>the</strong><br />
cont<strong>in</strong>ental boundary layer: meteorological and gas phase parameter <strong>in</strong>fluence.<br />
Geophysics Research Letter 27, 3325e3328.<br />
Biskos, G., Reavell, K., Coll<strong>in</strong>gs, N., 2005. Description and <strong>the</strong>oretical analysis <strong>of</strong><br />
a differential mobility spectrometer. Aerosol Science and Technology 39 (6),<br />
527e541.<br />
Brugge, D., Durant, J.L., Rioux, C., 2007. Near-highway pollutants <strong>in</strong> motor vehicle<br />
exhaust: a <strong>review</strong> <strong>of</strong> epidemiologic evidence <strong>of</strong> cardiac and pulmonary health<br />
risks. Environmental Health 6, 23.<br />
BSI, 2005. Vocabulary e <strong>nanoparticles</strong>. BSI PAS 71.<br />
Bunger, J., Krahl, J., Baum, K., Schroder, O., Muller, M., Westphal, G., 2000. Cytotoxic<br />
and mutagenic effects, particle size and concentration analysis <strong>of</strong> diesel eng<strong>in</strong>e<br />
emissions us<strong>in</strong>g biodiesel and petrol diesel as fuel. Archives <strong>of</strong> Toxicology 74,<br />
490e498.<br />
Buseck, P.R., Adachi, K., 2008. Nanoparticles <strong>in</strong> <strong>the</strong> atmosphere. Elements 4,<br />
389e394.<br />
Bystrzejewska-Piotrowska, G., Golimowski, J., Urban, P.L., 2009. Nanoparticles: <strong>the</strong>ir<br />
potential toxicity, waste and environmental management. Waste Management<br />
29, 2587e2595.<br />
Cambustion, 2003-9. DMS500 Fast Particulate Spectrometer User Manual, Version<br />
1.8. Cambustion Ltd., Cambridge, UK.<br />
Cambustion, 2008. Cambustion DMS500 Fast Particulate Size Spectrometer. Cambustion<br />
Ltd., Cambridge, UK. Download from: http://www.cambustion.com/<br />
products/dms500.<br />
Cambustion, 2009. Cambustion DMS50 Fast Particulate Size Spectrometer Download<br />
from: http://www.cambustion.com/sites/default/files/<strong>in</strong>struments/DMS50/<br />
DMS50.pdf.<br />
Chalupa, D.C., Marrow, P.E., Oberdorster, G., Utell, M.J., Frampton, M.W., 2004.<br />
Ultraf<strong>in</strong>e particle deposition <strong>in</strong> subjects with asthma. Environmental Health<br />
Perspectives 112, 879e882.<br />
Chang, D., Song, Y., Liu, B., 2009. Visibility trends <strong>in</strong> six megacities <strong>in</strong> Ch<strong>in</strong>a<br />
1973e2007. Atmospheric Research 94, 161e167.<br />
Charron, A., Harrison, R.M., 2003. Primary particle formation from vehicle emissions<br />
dur<strong>in</strong>g exhaust dilution <strong>in</strong> <strong>the</strong> road side atmosphere. Atmospheric Environment<br />
37, 4109e4119.<br />
Charron, A., Birmili, W., Harrison, R.M., 2008. F<strong>in</strong>gerpr<strong>in</strong>t<strong>in</strong>g particle orig<strong>in</strong>s<br />
accord<strong>in</strong>g to <strong>the</strong>ir size distribution at a UK rural site. Journal <strong>of</strong> Geophysical<br />
Research 113, D07202.<br />
Che, H., Zhang, X., Li, Y., Zhou, Z., Qu, J., Hao, X., 2009. Haze trends over <strong>the</strong> capital<br />
cities <strong>of</strong> 31 prov<strong>in</strong>ces <strong>in</strong> Ch<strong>in</strong>a, 1981e2005. Theoretical and Applied Climatology<br />
97, 235e242.<br />
Cheng, M.T., Tsai, Y.I., 2000. Characterization <strong>of</strong> visibility and atmospheric aerosols<br />
<strong>in</strong> <strong>urban</strong>, sub<strong>urban</strong>, and remote areas. Science <strong>of</strong> <strong>the</strong> Total Environment 263,<br />
101e114.<br />
Cheng, C.H., Cheung, C.S., Chan, T.L., Lee, S.C., Yao, C.D., 2008a. Experimental<br />
<strong>in</strong>vestigation on <strong>the</strong> performance, gaseous and particulate emissions <strong>of</strong><br />
a methanol fumigated diesel eng<strong>in</strong>e. Science <strong>of</strong> <strong>the</strong> Total Environment 389,<br />
115e124.<br />
Cheng, C.H., Cheung, C.S., Chan, T.L., Lee, S.C., Yao, C.D., Tsang, K.S., 2008b.<br />
Comparison <strong>of</strong> emissions <strong>of</strong> a direct <strong>in</strong>jection diesel eng<strong>in</strong>e operat<strong>in</strong>g on biodiesel<br />
with emulsified and fumigated methanol. Fuel 87, 1870e1879.<br />
Chung, S.H., Se<strong>in</strong>field, J.H., 2005. Climate response <strong>of</strong> direct radiative forc<strong>in</strong>g <strong>of</strong><br />
anthropogenic black carbon. Journal <strong>of</strong> Geophysical Research 110, D11102.<br />
Coll<strong>in</strong>gs, N., Reavell, K., Hands, T., Tate, J., 2003. Roadside aerosol measurements<br />
with a fast particle spectrometer. Proceed<strong>in</strong>gs, JSAE Annual Congress 41, 5e8.<br />
Colvile, R.N., Hutch<strong>in</strong>son, E.J., M<strong>in</strong>dell, J.S., Warren, R.F., 2001. The transport sector<br />
as a source <strong>of</strong> air pollution. Atmospheric Environment 2001, 1537e1565.<br />
CONCAWE, 1999. Fuel Quality, Vehicle Technology and <strong>the</strong>ir Interactions. CONCAWE<br />
Report 99/55, pp. 1e72.<br />
Curtius, J., 2006. Nucleation <strong>of</strong> atmospheric aerosol particles. Comptes Rendus<br />
Physique 7, 1027e1045.<br />
Dahl, A., Gharibi, A., Swietlicki, E., Gudmundsson, A., Bohgard, M., Ljungman, A.,<br />
Blomqvist, G., Gustafsson, M., 2006. Traffic-generated emissions <strong>of</strong> ultraf<strong>in</strong>e<br />
particles from pavement-tire <strong>in</strong>terface. Atmospheric Environment 40,<br />
1314e1323.<br />
Dawson, N.G., 2008. Sweat<strong>in</strong>g <strong>the</strong> small stuff: environmental risk and nanotechnology.<br />
Bioscience 58 690e690.<br />
Delf<strong>in</strong>o, R.J., Sioutas, C., Malik, S., 2005. Potential role <strong>of</strong> ultraf<strong>in</strong>e particles <strong>in</strong><br />
associations between airborne particle mass and cardiovascular health. Environmental<br />
Health Perspectives 113 (8), 934e946.<br />
Demirbas, A., 2009. Progress and recent trends <strong>in</strong> biodiesel fuels. Energy Conversion<br />
and Management 50, 14e34.<br />
Please cite this article <strong>in</strong> press as: Kumar, P., et al., A <strong>review</strong> <strong>of</strong> <strong>the</strong> <strong>characteristics</strong> <strong>of</strong> <strong>nanoparticles</strong> <strong>in</strong> <strong>the</strong> <strong>urban</strong> atmosphere and <strong>the</strong>..., Atmospheric<br />
Environment (2010), doi:10.1016/j.atmosenv.2010.08.016
P. Kumar et al. / Atmospheric Environment xxx (2010) 1e18 15<br />
DfT, 2008. Transport Statistics Bullet<strong>in</strong>: Vehicle Licens<strong>in</strong>g Statistics 2008. Department<br />
for Transport. Download from: http://www.dft.gov.uk/adobepdf/162469/<br />
221412/221552/228052/458127/vehiclelicens<strong>in</strong>g2008.pdf, 44 pp.<br />
DfT, 2009. Road Statistics 2008: Traffic, Speeds and Congestion. Department for<br />
Transport. Download from: http://www.dft.gov.uk/adobepdf/162469/221412/<br />
221546/226956/261695/roadstats08tsc.pdf, 73 pp.<br />
Dom<strong>in</strong>guez-Faus, R., Powers, S.E., Burken, J.G., Alvarez, P.J., 2009. The water footpr<strong>in</strong>t<br />
<strong>of</strong> bi<strong>of</strong>uels: a dr<strong>in</strong>k or drive issue? Environmental Science and Technology<br />
43, 3005e3010.<br />
Donaldson, K., Tran, C.L., 2004. An <strong>in</strong>troduction to <strong>the</strong> short-term toxicology <strong>of</strong><br />
respirable <strong>in</strong>dustrial fibres. Mutation Research/Fundamental and Molecular<br />
Mechanisms <strong>of</strong> Mutagenesis 553, 5e9.<br />
Donaldson, K., Tran, L., Albert Jimenez, L.A., Duff<strong>in</strong>, R., Newby, D.E., Mills, N., MacNee, W.,<br />
Stone, V., 2005. Combustion-derived <strong>nanoparticles</strong>: a <strong>review</strong> <strong>of</strong> <strong>the</strong>ir toxicology<br />
follow<strong>in</strong>g <strong>in</strong>halation exposure. Particle & Fibre Toxicology 5/6, 553e560.<br />
Donaldson, K., Aitken, R., Tran, L., Stone, V., Duff<strong>in</strong>, R., Forrester, G., Alexander, A.,<br />
2006. Carbon nanotubes: a <strong>review</strong> <strong>of</strong> <strong>the</strong>ir properties <strong>in</strong> relation to pulmonary<br />
toxicology and workplace safety. Toxicology Science 92, 5e22.<br />
Doyale, M., Dorl<strong>in</strong>g, S., 2002. Visibility trends <strong>in</strong> UK, 1950e1997. Atmospheric<br />
Environment 36, 3161e3172.<br />
Duff<strong>in</strong>, R., Mills, N.L., Donaldson, K., 2007. Nanoparticles e a thoracic toxicology<br />
perspective. Yonsei Medical Journal 48, 561e562.<br />
EEA Brief<strong>in</strong>g, 2004. Transport bi<strong>of</strong>uels: explor<strong>in</strong>g l<strong>in</strong>ks with <strong>the</strong> energy and agriculture<br />
sectors Download from: http://www.eea.europa.eu/publications/<br />
brief<strong>in</strong>g_2004_4.<br />
ELPI, 2009. DEKATI Electrical Low Pressure Impactor (ELPI) Download from: http://<br />
www.dekati.com/cms/elpi.<br />
EPA, 2002. Health Assessment Document for Diesel Eng<strong>in</strong>e Exhaust. Environmental<br />
Protection Agency. Download from: http://cfpub.epa.gov/ncea/cfm/recordisplay.<br />
cfm?deid¼29060.<br />
EPA, 2007. Nanotechnology White Paper. Report EPA 100/B-07/001. US Environmental<br />
Protection Agency, Wash<strong>in</strong>gton DC 20460, USA.<br />
EU, 2008. Commission regulation (EC) No 692/2008. Official Journal <strong>of</strong> <strong>the</strong> European<br />
Union, 136.<br />
Evelyn, A., Mannick, S., Sermon, P.A., 2002. Unusual carbon-based nan<strong>of</strong>ibres and<br />
cha<strong>in</strong>s among diesel-emitted particles. Nano Letters 3, 63e64.<br />
Flagan, R.C., 1998. History <strong>of</strong> electrical aerosol measurements. Aerosol Science and<br />
Technology 28, 301e380.<br />
Fontaras, G., Karavalakis, G., Kousoulidou, M., Tzamkiozis, T., Ntziachristos, L.,<br />
Bakeas, E., Stournas, S., Samaras, S., 2009. Effects <strong>of</strong> biodiesel on passenger car<br />
fuel consumption, regulated and non-regulated pollutant emissions over legislated<br />
and real-world driv<strong>in</strong>g cycles. Fuel 88, 1608e1617.<br />
Fujitani, Y., Kobayashi, T., Arashidani, K., Kunugita, N., Suemura, K., 2008. Measurement<br />
<strong>of</strong> <strong>the</strong> physical properties <strong>of</strong> aerosols <strong>in</strong> a fullerene factory for <strong>in</strong>halation exposure<br />
assessment. Journal <strong>of</strong> Occupational and Environmental Hygiene 5, 380e389.<br />
Gidhagen, L., Johansson, C., Langner, J., Foltescu, V.L., 2005. Urban scale model<strong>in</strong>g <strong>of</strong><br />
particle number concentration <strong>in</strong> Stockholm. Atmospheric Environment 39,<br />
1711e1725.<br />
Gouriou, F., Mor<strong>in</strong>, J.-P., Weill, M.-E., 2004. On-road measurements <strong>of</strong> particle<br />
number concentrations and size distributions <strong>in</strong> <strong>urban</strong> and tunnel environments.<br />
Atmospheric Environment 38, 2831e2840.<br />
Graskow, B.R., Kittelson, D.B., Abdul-Khaleek, I.S., Ahmadi, M.R., Morris, J.E., 1998.<br />
Characterization <strong>of</strong> Exhaust Particulate Emissions from a Spark Ignition Eng<strong>in</strong>e.<br />
Society <strong>of</strong> Automotive Eng<strong>in</strong>eers, Warrendale, PA, 980528.<br />
GRIMM, 2009. Stationary Sizers and Counters Download from: http://www.grimmaerosol.com/Nano-Particle-Instruments/stationary-sizers-a-counters.html.<br />
Grose, M., Sakurai, H., Savstrom, J., Stolzenburg, M.R., Watts, W.F., Morgan, C.G.,<br />
Murray, I.P., Twigg, M.V., Kittelson, D.B., McMurry, P.H., 2006. Chemical and<br />
physical properties <strong>of</strong> ultraf<strong>in</strong>e diesel exhaust particles sampled downstream <strong>of</strong><br />
a catalytic trap. Environmental Science and Technology 40, 5502e5507.<br />
Gustafsson, M., Blomqvist, G., Gudmundsson, A., Dahl, A., Swietlicki, E., Bohgard, M.,<br />
L<strong>in</strong>dbom, J., Ljungman, A., 2008. Properties and toxicological effects <strong>of</strong> particles<br />
from <strong>the</strong> <strong>in</strong>teraction between tyres, road pavement and w<strong>in</strong>ter traction material.<br />
Science <strong>of</strong> <strong>the</strong> Total Environment 393, 226e240.<br />
Hammond, G.P., Kallu, S., McManus, M.C., 2008. Development <strong>of</strong> bi<strong>of</strong>uels for <strong>the</strong> UK<br />
automotive market. Applied Energy 85, 506e515.<br />
Handy, R.D., Henry, T.B., Scown, T.M., Johnston, B.D., Tyler, C.R., 2008a. Manufactured<br />
<strong>nanoparticles</strong>: <strong>the</strong>ir uptake and effects on fish e a mechanistic analysis.<br />
Ecotoxicology 17, 396e409.<br />
Handy, R.D., von der Kammer, F., Lead, J.R., Hassellöv, M., Owen, R., Crane, M., 2008b.<br />
The ecotoxicology and chemistry <strong>of</strong> manufactured <strong>nanoparticles</strong>. Ecotoxicology<br />
17, 287e314.<br />
Hansen, K.F., Jensen, M.G., 1997. Chemical and Biological Characteristics <strong>of</strong> Exhaust<br />
Emissions from a DI Diesel Eng<strong>in</strong>e Fuelled with Rapeseed Oil Methyl Ester<br />
(RME). SAE paper, 971689.<br />
Hansen, D., Blahout, B., Benner, D., Popp, W., 2008. Environmental sampl<strong>in</strong>g <strong>of</strong><br />
particulate matter and fungal spores dur<strong>in</strong>g demolition <strong>of</strong> a build<strong>in</strong>g on<br />
a hospital area. Journal <strong>of</strong> Hospital Infection 70, 259e264.<br />
Harris, S.J., Maricq, M.M., 2001. Signature size distributions for diesel and gasol<strong>in</strong>e<br />
eng<strong>in</strong>e exhaust particulate matter. Journal <strong>of</strong> Aerosol Science 32, 749e764.<br />
Harrison, R.M., Y<strong>in</strong>, J., 2000. Particulate matter <strong>in</strong> <strong>the</strong> atmosphere: which particle<br />
properties are important for its effect on health? Science <strong>of</strong> <strong>the</strong> Total Environment<br />
249, 85e101.<br />
Hart, D., Bauen, A., Chase, A., Howes, J., 2003. Liquid Bi<strong>of</strong>uels and Hydrogen from<br />
Renewable Resources <strong>in</strong> <strong>the</strong> UK to 2050: a Technical Analysis. E4tech (UK) Ltd.<br />
Download from: http://www.senternovem.nl/mmfiles/TechanalBi<strong>of</strong>uelsand-<br />
H22050_tcm24-187065.pdf, Study carried out for <strong>the</strong> UK Department for<br />
Transport, 82 pp.<br />
Helland, A., Wick, P., Koehler, A., Schmid, K., Som, C., 2007. Review<strong>in</strong>g <strong>the</strong> environmental<br />
and human health knowledge base <strong>of</strong> carbon nanotubes. Environmental<br />
Health Perspectives 115, 1125e1131.<br />
H<strong>in</strong>ds, W.C., 1999. Aerosol Technology: Properties, Behaviour and Measurement <strong>of</strong><br />
Airborne Particles. John Wiley & Sons, UK. 483.<br />
Holmes, N.S., Morawska, L., 2006. A <strong>review</strong> <strong>of</strong> dispersion modell<strong>in</strong>g and its application<br />
to <strong>the</strong> dispersion <strong>of</strong> particles: an overview <strong>of</strong> different dispersion models<br />
available. Atmospheric Environment 40, 5902e5928.<br />
Holmes, N., 2007. A <strong>review</strong> <strong>of</strong> particle formation events and growth <strong>in</strong> <strong>the</strong> atmosphere<br />
<strong>in</strong> <strong>the</strong> various environments and discussion <strong>of</strong> mechanistic implications.<br />
Atmospheric Environment 41, 2183e2201.<br />
Horvath, H., 1994. Atmospheric aerosols, atmospheric optics visibility. Journal <strong>of</strong><br />
Aerosol Science 25, S23eS24.<br />
Horvath, H., 2008. Conference on visibility, aerosols, and atmospheric optics,<br />
Vienna, September 3e6, 2006. Atmospheric Environment 42, 2569e2570.<br />
HSE, 2007. Trends <strong>in</strong> nanotechnology. Health and Safety Executive, 1e4, http://<br />
www.hse.gov.uk/horizons/nanotech/sr002p002.pdf.<br />
Hu,S.,Fru<strong>in</strong>,S.,Kozawa,K.,Mara,S.,W<strong>in</strong>er,A.M.,Paulson,S.E.,2009.Aircraft<br />
emission impacts <strong>in</strong> a neighborhood adjacent to a general aviation airport<br />
<strong>in</strong> Sou<strong>the</strong>rn California. Environmental Science and Technology 43,<br />
8039e8045.<br />
Husse<strong>in</strong>, T., Johansson, C., Karlsson, H., Hansson, H.-C., 2008. Factors affect<strong>in</strong>g nontailpipe<br />
aerosol particle emissions from paved roads: on-road measurements <strong>in</strong><br />
Stockholm, Sweden. Atmospheric Environment 42, 688e702.<br />
Ibald-Mulli, A., Wichmann, H.-E., Kreyl<strong>in</strong>g, W., Peters, A., 2002. Epidemiological<br />
evidence on health effects <strong>of</strong> ultraf<strong>in</strong>e particles. Journal <strong>of</strong> Aerosol Medic<strong>in</strong>e 15,<br />
189e201.<br />
ICRP, 1994. ICRP publication 66: human respiratory tract model for radiological<br />
protection. A Report <strong>of</strong> a task group <strong>of</strong> <strong>the</strong> International Commission on<br />
Radiological Protection. Annals <strong>of</strong> <strong>the</strong> ICRP 24 (1e3), 1e480.<br />
Iijima, S., 1991. Helical microtubules <strong>of</strong> graphitic carbon. Nature 354, 56e58.<br />
IPCC, 2007. Climate change 2007: <strong>the</strong> physical science basis. In: Soloman, S., Q<strong>in</strong>, D.,<br />
Mann<strong>in</strong>g, M., Chen, Z., Marquis, M., Averyt, K.B., Tignor, M., Miller, H.L. (Eds.),<br />
Contribution <strong>of</strong> Work<strong>in</strong>g Group I to <strong>the</strong> Fourth Assessment Report <strong>of</strong> <strong>the</strong><br />
Intergovernmental Panel on Climate Change. Cambridge University Press,<br />
Cambridge, United K<strong>in</strong>gdom.<br />
Isakson, J., Persson, T.A., Sel<strong>in</strong> L<strong>in</strong>dgren, E., 2001. Identification and assessment <strong>of</strong><br />
ship emissions and <strong>the</strong>ir effects <strong>in</strong> <strong>the</strong> harbour <strong>of</strong> Göteborg, Sweden. Atmospheric<br />
Environment 35, 3659e3666.<br />
Jacobson, M.Z., 2001. Strong radiative heat<strong>in</strong>g due to <strong>the</strong> mix<strong>in</strong>g state <strong>of</strong> black<br />
carbon <strong>in</strong> atmospheric aerosols. Nature 409, 695e697.<br />
Jacobson, M.Z., 2005. Fundamentals <strong>of</strong> Atmospheric Model<strong>in</strong>g, second ed. Cambridge<br />
University Press.<br />
Johansson, C., Norman, M., Gidhagen, L., 2007. Spatial & temporal variations <strong>of</strong> PM 10<br />
and particle number concentrations <strong>in</strong> <strong>urban</strong> air. Environmental Monitor<strong>in</strong>g<br />
and Assessment 127, 477e487.<br />
Jones, A.M., Harrison, R.M., 2006. Estimation <strong>of</strong> <strong>the</strong> emission factors <strong>of</strong> particle<br />
number and mass fractions from traffic at a site where mean vehicle speeds<br />
vary over short distances. Atmospheric Environment 40, 7125e7137.<br />
Ju-Nam, Y., Lead, J.R., 2008. Manufactured <strong>nanoparticles</strong>: an overview <strong>of</strong> <strong>the</strong>ir<br />
chemistry, <strong>in</strong>teractions and potential environmental implications. Science <strong>of</strong><br />
<strong>the</strong> Total Environment 400, 396e414.<br />
Jung, H., Kittelson, D.B., Zachariah, M.R., 2006. Characteristics <strong>of</strong> SME biodieselfueled<br />
diesel particle emissions and <strong>the</strong> k<strong>in</strong>etics <strong>of</strong> oxidation. Environmental<br />
Science and Technology 40, 4949e4955.<br />
Keogh, D.U., Ferreira, L., Morawska, L., 2009. Development <strong>of</strong> a particle number and<br />
particle mass vehicle emissions <strong>in</strong>ventory for an <strong>urban</strong> fleet. Environmental<br />
Modell<strong>in</strong>g & S<strong>of</strong>tware 24, 1323e1331.<br />
Keogh, D.U., Kelly, J., Mengersen, K., Jayaratne, R., Ferreira, L., Morawska, L., 2010.<br />
Derivation <strong>of</strong> motor vehicle tailpipe particle emission factors suitable for<br />
modell<strong>in</strong>g <strong>urban</strong> fleet emissions and air quality assessments. Environmental<br />
Science and Pollution 73, 724e729.<br />
Kerm<strong>in</strong>en, V.-M., Pijrola, L., Kulmala, M., 2001. How significantly does coagulational<br />
scaveng<strong>in</strong>g limit atmospheric particle production? Journal <strong>of</strong> Geophysical<br />
Research 106, 24119e24125.<br />
Kesk<strong>in</strong>en, J., Pietar<strong>in</strong>en, K., Lehtimäki, M., 1992. Electrical low pressure impactor.<br />
Journal <strong>of</strong> Aerosol Science 23, 353e360.<br />
Ketzel, M., Berkowicz, R., 2004. Modell<strong>in</strong>g <strong>the</strong> fate <strong>of</strong> ultraf<strong>in</strong>e particles from<br />
exhaust pipe to rural background: an analysis <strong>of</strong> time scales for dilution,<br />
coagulation and deposition. Atmospheric Environment 38, 2639e2652.<br />
Ketzel, M., Berkowicz, R., 2005. Multi-plume aerosol dynamics and transport<br />
model for <strong>urban</strong> scale particle pollution. Atmospheric Environment 39,<br />
3407e3420.<br />
Ketzel, M., Wahl<strong>in</strong>, P., Kristensson, A., Swietlicki, E., Berkowicz, R., Nielsen, O.J.,<br />
Palmgren, F., 2003. Particle size distribution and particle mass measurements at<br />
<strong>urban</strong>, near-city and rural level <strong>in</strong> <strong>the</strong> Copenhagen area and Sou<strong>the</strong>rn Sweden.<br />
Atmospheric Chemistry and Physics Discussions 3, 5513e5546.<br />
Kim, C.S., Shen, S., Sioutas, C., 2002. Size distribution and diurnal and seasonal<br />
trends <strong>of</strong> ultraf<strong>in</strong>e particles <strong>in</strong> source and receptor sites <strong>of</strong> <strong>the</strong> Los Angeles<br />
Bas<strong>in</strong>. Journal <strong>of</strong> Air & Waste Management Association 52, 297e307.<br />
Kittelson, D.B., 1998. Eng<strong>in</strong>es and nano-particles: a <strong>review</strong>. Journal <strong>of</strong> Aerosol<br />
Science 29, 575e588.<br />
Please cite this article <strong>in</strong> press as: Kumar, P., et al., A <strong>review</strong> <strong>of</strong> <strong>the</strong> <strong>characteristics</strong> <strong>of</strong> <strong>nanoparticles</strong> <strong>in</strong> <strong>the</strong> <strong>urban</strong> atmosphere and <strong>the</strong>..., Atmospheric<br />
Environment (2010), doi:10.1016/j.atmosenv.2010.08.016
16<br />
P. Kumar et al. / Atmospheric Environment xxx (2010) 1e18<br />
Kittelson, D.B., Watts, W.F., Johnson, J.P., 2001. F<strong>in</strong>e Particle (Nanoparticle) Emissions<br />
on M<strong>in</strong>nesota Highways. M<strong>in</strong>nesota Department <strong>of</strong> Transportation, St.<br />
Paul, MN. F<strong>in</strong>al Report, May 2001.<br />
Kittelson, D.B., Watts, W.F., Johnson, J.P., 2004. Nanoparticle emissions on M<strong>in</strong>nesota<br />
highways. Atmospheric Environment 38, 9e19.<br />
Kittelson, D.B., Watts, W.F., Johnson, J.P., 2006a. On-road and laboratory evaluation<br />
<strong>of</strong> combustion aerosols e part 1: summary <strong>of</strong> diesel eng<strong>in</strong>e results. Journal <strong>of</strong><br />
Aerosol Science 37, 913e930.<br />
Kittelson, D.B., Watts, W.F., Johnson, J.P., Lawson, D.R., 2006b. On-road and laboratory<br />
evaluation <strong>of</strong> combustion aerosol e part 2: summary <strong>of</strong> spark ignition<br />
eng<strong>in</strong>e results. Journal <strong>of</strong> Aerosol Science 37, 931e949.<br />
Köhler, A.R., Som, C., Helland, A., Gottschalk, F., 2008. Study<strong>in</strong>g <strong>the</strong> potential release<br />
<strong>of</strong> carbon nanotubes throughout <strong>the</strong> application life cycle. Journal <strong>of</strong> Cleaner<br />
Production 16, 927e937.<br />
Krahl, J., Munack, A., Schroder, O., Ste<strong>in</strong>, H., Bunger, J., 2003. Influence <strong>of</strong> Biodiesel<br />
and Different Designed Diesel Fuels on <strong>the</strong> Exhaust Gas Emissions and Health<br />
Effects. SAE paper 2003-2001-3199.<br />
Krahl, J., Munack, A., Schroder, O., Ste<strong>in</strong>, H., Herbst, L., Kaufmann, A., 2005. Fuel<br />
design as constructional element with <strong>the</strong> example <strong>of</strong> biogenic and fossil diesel<br />
fuels. Agricultural Eng<strong>in</strong>eer<strong>in</strong>g International: <strong>the</strong> CIGR Ejournal VII, 1e11.<br />
manuscript EE 04 008.<br />
Kreider, M.L., Panko, J.M., McAtee, B.L., Sweet, L.I., F<strong>in</strong>ley, B.L., 2010. Physical and<br />
chemical characterization <strong>of</strong> tire-related particles: comparison <strong>of</strong> particles<br />
generated us<strong>in</strong>g different methodologies. Science <strong>of</strong> <strong>the</strong> Total Environment 408,<br />
652e659.<br />
Kuhlbusch, T.A., Neumann, S., Fissan, H., 2004. Number size distribution, mass<br />
concentration, and particle composition <strong>of</strong> PM 1 ,PM 2.5 , and PM 10 <strong>in</strong> bag fill<strong>in</strong>g<br />
areas <strong>of</strong> carbon black production. Journal <strong>of</strong> Occupational and Environmental<br />
Hygiene 1, 660e671.<br />
Kulmala, M., Pijrola, L., Makela, J.M., 2000. Stable sulphate clusters as a source <strong>of</strong><br />
new atmospheric particles. Nature 404, 66e69.<br />
Kulmala, M., Boy, M., Gaman, A., Raivonen, M., Suni, T., Aaltonen, V., Adler, H.,<br />
Anttila, T., Fiedler, V., Gronholm, T., Hellen, H., Herrmann, E., Jalonen, R.,<br />
Jussila, M., Komppula, M., Kosmale, M., Plauskaite, K., Reis, R., R<strong>in</strong>ollo, A.,<br />
Savola, N., So<strong>in</strong>i, P., Virtanen, S., Aalto, P., Dal Maso, M., Hakola, H., Keronen, P.,<br />
Leht<strong>in</strong>en, K.E.J., Vehkamäki, H., Rannik, U., Hari, P., 2003. Aerosols <strong>in</strong> boreal<br />
forest: w<strong>in</strong>tertime relations between formation events and bio-geo-chemical<br />
activity. Boreal Environment Research 9, 63e74.<br />
Kulmala, M., Vehkamaki, H., Petaja, T., Dal Maso, M., Lauri, A., Kerm<strong>in</strong>en, V.-M.,<br />
Birmili, W., McMurry, P.H., 2004. Formation and growth rates <strong>of</strong> ultraf<strong>in</strong>e<br />
particles: a <strong>review</strong> <strong>of</strong> observations. Journal <strong>of</strong> Aerosol Science 35, 143e176.<br />
Kumar, P., Fennell, P., Britter, R., 2008a. Effect <strong>of</strong> w<strong>in</strong>d direction and speed on <strong>the</strong><br />
dispersion <strong>of</strong> nucleation and accumulation mode particles <strong>in</strong> an <strong>urban</strong> street<br />
canyon. Science <strong>of</strong> <strong>the</strong> Total Environment 402, 82e94.<br />
Kumar, P., Fennell, P., Britter, R., 2008b. Measurements <strong>of</strong> particles <strong>in</strong> <strong>the</strong><br />
5e1000 nm range close to road level <strong>in</strong> an <strong>urban</strong> street canyon. Science <strong>of</strong> <strong>the</strong><br />
Total Environment 390, 437e447.<br />
Kumar, P., Fennell, P., Langley, D., Britter, R., 2008c. Pseudo-simultaneous<br />
measurements for <strong>the</strong> vertical variation <strong>of</strong> coarse, f<strong>in</strong>e and ultra f<strong>in</strong>e particles <strong>in</strong><br />
an <strong>urban</strong> street canyon. Atmospheric Environment 42, 4304e4319.<br />
Kumar, P., Fennell, P., Symonds, J., Britter, R., 2008d. Treatment <strong>of</strong> losses <strong>of</strong> ultraf<strong>in</strong>e<br />
aerosol particles <strong>in</strong> long cyl<strong>in</strong>drical sampl<strong>in</strong>g tubes dur<strong>in</strong>g ambient measurements.<br />
Atmospheric Environment 42, 8819e8826.<br />
Kumar, P., Fennell, P., Hayhurst, A.N., Britter, R.E., 2009a. Street versus ro<strong>of</strong>top level<br />
concentrations <strong>of</strong> f<strong>in</strong>e particles <strong>in</strong> a Cambridge street canyon. Boundary-Layer<br />
Meteorology 131, 3e18.<br />
Kumar, P., Garmory, A., Ketzel, M., Berkowicz, R., Britter, R., 2009b. Comparative<br />
study <strong>of</strong> measured and modelled number concentrations <strong>of</strong> <strong>nanoparticles</strong> <strong>in</strong> an<br />
<strong>urban</strong> street canyon. Atmospheric Environment, 949e958.<br />
Kumar, P., Rob<strong>in</strong>s, A., Britter, R., 2009c. Fast response measurements for <strong>the</strong><br />
dispersion <strong>of</strong> <strong>nanoparticles</strong> <strong>in</strong> a vehicle wake and <strong>in</strong> a street canyon. Atmospheric<br />
Environment 43, 6110e6118.<br />
Kumar, P., Fennell, P., Rob<strong>in</strong>s, A., 2010. Comparison <strong>of</strong> <strong>the</strong> behaviour <strong>of</strong> manufactured<br />
and o<strong>the</strong>r airborne <strong>nanoparticles</strong> and <strong>the</strong> consequences for prioritis<strong>in</strong>g<br />
research and regulation activities. Journal <strong>of</strong> Nanoparticle Research 12,<br />
1523e1530.<br />
Kumar, P., Rob<strong>in</strong>s, A., ApSimon, H. Nanoparticle emissions from bi<strong>of</strong>uelled vehicles e<br />
<strong>the</strong>ir <strong>characteristics</strong> and impact on <strong>the</strong> number based regulation <strong>of</strong> atmospheric<br />
particles. Atmospheric Science Letters, <strong>in</strong> press.<br />
Lapuerta, M., Armas, O., Ballesteros, R., 2002. Diesel Particulate Emissions from<br />
Bi<strong>of</strong>uels Derived from Spanish Vegetable Oils. SAE paper No. 2002-2001-1657.<br />
Lapuerta, M., Armas, O., Rodríguez-Fernández, J., 2008. Effect <strong>of</strong> biodiesel fuels on<br />
diesel eng<strong>in</strong>e emissions. Progress <strong>in</strong> Energy and Combustion Science 34,<br />
198e223.<br />
Lee, H., Myung, C.-L., Park, S., 2009. Time-resolved particle emission and size<br />
distribution <strong>characteristics</strong> dur<strong>in</strong>g dynamic eng<strong>in</strong>e operation conditions with<br />
ethanol-blended fuels. Fuel 88, 1680e1686.<br />
Leith, D., Peters, T.M., 2003. Concentration measurement and count<strong>in</strong>g efficiency<br />
<strong>of</strong> <strong>the</strong> aerodynamic particle sizer 3321. Journal <strong>of</strong> Aerosol Science 34,<br />
627e634.<br />
Leys, J., McTanish, G., Koen, T., Mooney, B., Strong, C., 2005. Test<strong>in</strong>g a statistical<br />
curve-fitt<strong>in</strong>g procedure for quantify<strong>in</strong>g sediment populations with<strong>in</strong> multimodal<br />
particle-size distributions. Earth Surface Processes and Landreforms 30,<br />
579e590.<br />
Li, X.Y., Gilmour, P.S., Donaldson, K., MacNee, W., 1996. Free radical activity and pro<strong>in</strong>flammatory<br />
effects <strong>of</strong> particulate air pollution (PM 10 ) <strong>in</strong> vivo and <strong>in</strong> vitro.<br />
Thorax 51, 1216e1222.<br />
Limbach, L.K., Wick, P., Manser, P., Grass, R.N., Bru<strong>in</strong><strong>in</strong>k, A., Stark, W.J., 2007.<br />
Exposure <strong>of</strong> eng<strong>in</strong>eered <strong>nanoparticles</strong> to human lung epi<strong>the</strong>lial cells: <strong>in</strong>fluence<br />
<strong>of</strong> chemical composition and catalytic activity on oxidative stress. Environmental<br />
Science and Technology 41, 4158e4163.<br />
L<strong>in</strong>gard, J.J.N., Agus, E.L., Young, D.T., Andrews, G.E., Toml<strong>in</strong>, A.S., 2006. Observations<br />
<strong>of</strong> <strong>urban</strong> airborne particle number concentrations dur<strong>in</strong>g rush-hour conditions:<br />
analysis <strong>of</strong> <strong>the</strong> number based size distributions and modal parameters. Journal<br />
<strong>of</strong> Environmental Monitor<strong>in</strong>g 8, 1203e1218.<br />
Lohmeyer, A., Mueller, W.J., Baechl<strong>in</strong>, W., 2002. A comparison <strong>of</strong> street canyon<br />
concentration predictions by different modellers: f<strong>in</strong>al results now available<br />
from <strong>the</strong> Podbi-exercise. Atmospheric Environment 36, 157e158.<br />
Longley, I.D., Gallagher, M.W., Dorsey, J.R., Flynn, M., 2004. A case-study <strong>of</strong> f<strong>in</strong>e<br />
particle concentrations and fluxes measured <strong>in</strong> a busy street canyon <strong>in</strong> Manchester,<br />
UK. Atmospheric Environment 38, 3595e3603.<br />
Mahowald, N.M., Ballant<strong>in</strong>e, J.A., Feddema, J., Ramankutty, N., 2007. Global trends <strong>in</strong><br />
visibility: implications for dust sources. Atmospheric Chemistry and Physics 7,<br />
3309e3339.<br />
Makkonen, U., Hellén, H., Anttila, P., Ferm, M., 2010. Size distribution and chemical<br />
composition <strong>of</strong> airborne particles <strong>in</strong> south-eastern F<strong>in</strong>land dur<strong>in</strong>g different<br />
seasons and wildfire episodes <strong>in</strong> 2006. Science <strong>of</strong> <strong>the</strong> Total Environment 408,<br />
644e651.<br />
Malm, W.C., Day, D.E., 2001. Estimates <strong>of</strong> aerosol species scatter<strong>in</strong>g <strong>characteristics</strong> as<br />
a function <strong>of</strong> relative humidity. Atmospheric Environment 35, 2845e2860.<br />
Marjamäki, M., Kesk<strong>in</strong>en, J., Chen, D.-R., Pui, D.Y.H., 2000. Performance evaluation <strong>of</strong><br />
<strong>the</strong> electrical low-pressure impactor (ELPI). Journal <strong>of</strong> Aerosol Science 31,<br />
249e261.<br />
Mathis, U., Mohr, M., Kaegi, R., Bertola, A., Boulouchos, K., 2005. Influence <strong>of</strong> diesel<br />
eng<strong>in</strong>e combustion parameters on primary soot particle diameter. Environmental<br />
Science and Technology 39, 1887e1892.<br />
Maynard, A.D., Aitken, R.J., 2007. Assess<strong>in</strong>g exposure to airborne nanomaterials:<br />
current abilities and future requirements. Nanotoxicology 1, 26e41.<br />
Maynard, A.D., Maynard, R.L., 2002. A derived association between ambient aerosol<br />
surface area and excess mortality us<strong>in</strong>g historic time series data. Atmospheric<br />
Environment 36, 5561e5567.<br />
Maynard, A.D., 2006. Nanotechnology: a Research Strategy for Address<strong>in</strong>g Risk.<br />
Woodrow Wilson International Centre for Scholars, Wash<strong>in</strong>gton, DC, pp. 1e45.<br />
McCawley, M.A., 1990. Should dust samples mimic human lung deposition?<br />
Counterpo<strong>in</strong>t. Applied Occupational and Environmental Hygiene 5 (12),<br />
829e835.<br />
McMurry, P.H., 2000a. The history <strong>of</strong> condensation nucleus counters. Aerosol<br />
Science and Technology 33, 297e322.<br />
McMurry, P.H., 2000b. A <strong>review</strong> <strong>of</strong> atmospheric aerosol measurements. Atmospheric<br />
Environment 34, 1959e1999.<br />
Medved, A., Dorman, F., Kaufman, S.L., Pöcher, A., 2000. A new corona-based<br />
charger for aerosol particles. Journal <strong>of</strong> Aerosol Science 31, 616e617.<br />
M<strong>in</strong>oura, H., Takekawa, H., Terada, S., 2009. Roadside <strong>nanoparticles</strong> correspond<strong>in</strong>g<br />
to vehicle emissions dur<strong>in</strong>g one signal cycle. Atmospheric Environment 43,<br />
546e556.<br />
Mohan, M., Payra, S., 2009. Influence <strong>of</strong> aerosol spectrum and air pollutants on fog<br />
formation <strong>in</strong> <strong>urban</strong> environment <strong>of</strong> megacity Delhi, India. Environmental<br />
Monitor<strong>in</strong>g and Assessment 151, 265e277.<br />
Mohr, M., Forss, A.-M., Lehmann, U., 2006. Particle emissions from diesel passenger<br />
cars equipped with a particle trap <strong>in</strong> comparison to o<strong>the</strong>r technologies. Environmental<br />
Science and Technology 40, 2375e2383.<br />
Monkkonen, P., Koponen, I.K., Leht<strong>in</strong>en, K.E.J., Hameri, K., Uma, R., Kulmala, M.,<br />
2005. Measurements <strong>in</strong> a highly polluted Asian mega city: observations <strong>of</strong><br />
aerosol number size distribution, modal parameters and nucleation events.<br />
Atmospheric Chemistry and Physics 5, 57e66.<br />
Moolgavkar, S.H., 2005. A <strong>review</strong> and critique <strong>of</strong> <strong>the</strong> EPA’s rationale for a f<strong>in</strong>e<br />
particle standard. Regulatory Toxicology and Pharmacology 42, 123e144.<br />
Muller, N.C., Nowack, B., 2008. Exposure model<strong>in</strong>g <strong>of</strong> eng<strong>in</strong>eered <strong>nanoparticles</strong> <strong>in</strong><br />
<strong>the</strong> environment. Environmental Science and Technology 42, 4447e4453.<br />
Munack, A., Schroder, O., Krahl, J., Bunger, J., 2001. Comparison <strong>of</strong> relevant gas<br />
emissions from biodiesel and fossil diesel fuel. Agricultural Eng<strong>in</strong>eer<strong>in</strong>g International:<br />
<strong>the</strong> CIGR Journal <strong>of</strong> Scientific Research and Development III, 1e8.<br />
manuscript EE 01 001.<br />
Murr, L.E., Garza, K.M., 2009. Natural and anthropogenic environmental nanoparticulates:<br />
<strong>the</strong>ir microstructural characterization and respiratory health<br />
implications. Atmospheric Environment 43, 2683e2692.<br />
Nel, A., Xia, T., Madler, L., Li, N., 2006. Toxic potential <strong>of</strong> materials at <strong>the</strong> nanolevel.<br />
Science 311, 622e627.<br />
Nemmar, A., Hoet, P.H.M., Vanquickenborne, B., D<strong>in</strong>sdale, D., Thomeer, M.,<br />
Hoyaerts, M.F., Vanbilleon, H., Mortelmans, L., Nemery, B., 2002. Passage <strong>of</strong><br />
<strong>in</strong>haled particles <strong>in</strong>to <strong>the</strong> blood circulation <strong>in</strong> humans. Circulation 105,<br />
411e414.<br />
Noble, C.A., Lawless, P.A., Rodes, C.E., 2005. A sampl<strong>in</strong>g approach for evaluat<strong>in</strong>g<br />
particle loss dur<strong>in</strong>g cont<strong>in</strong>uous field measurements <strong>of</strong> particulate matter.<br />
Particle & Particle System Characterization 22, 99e106.<br />
Noone, K.J., Orgren, J.A., Hallberg, A., He<strong>in</strong>tzenberg, J., Strom, J., Hansson, H.-C., et al.,<br />
1992. Changes <strong>in</strong> aerosol size- and phase distributions due to physical processes<br />
<strong>in</strong> fog. Tellus 41B, 24e31.<br />
Please cite this article <strong>in</strong> press as: Kumar, P., et al., A <strong>review</strong> <strong>of</strong> <strong>the</strong> <strong>characteristics</strong> <strong>of</strong> <strong>nanoparticles</strong> <strong>in</strong> <strong>the</strong> <strong>urban</strong> atmosphere and <strong>the</strong>..., Atmospheric<br />
Environment (2010), doi:10.1016/j.atmosenv.2010.08.016
P. Kumar et al. / Atmospheric Environment xxx (2010) 1e18 17<br />
Nowack, B., 2009. The behaviour and effects <strong>of</strong> <strong>nanoparticles</strong> <strong>in</strong> <strong>the</strong> environment.<br />
Environmental Pollution 157, 1063e1064.<br />
Nowack, B., Bucheli, T.D., 2007. Occurrence, behavior and effects <strong>of</strong> <strong>nanoparticles</strong> <strong>in</strong><br />
<strong>the</strong> environment. Environmental Pollution 150, 5e22.<br />
Oberdörster, G., Maynard, A., Donaldson, K., V<strong>in</strong>cent Castranova, V., Fitzpatrick, J.,<br />
Ausman, K., Carter, J., Karn, B., Kreyl<strong>in</strong>g, W., Lai, D., Ol<strong>in</strong>, S., Monteiro-Riviere, N.,<br />
Warheit, D., Yang, H., 2005a. Pr<strong>in</strong>ciples for characteriz<strong>in</strong>g <strong>the</strong> potential human<br />
health effects from exposure to nanomaterials: elements <strong>of</strong> a screen<strong>in</strong>g<br />
strategy. Particle and Fibre Toxicology 2 (8), 1e35.<br />
Oberdörster, G., Oberdörster, E., Oberdörster, J., 2005b. Nanotoxicology: an<br />
emerg<strong>in</strong>g discipl<strong>in</strong>e evolv<strong>in</strong>g from studies <strong>of</strong> ultraf<strong>in</strong>e particles. Environmental<br />
Health Perspectives 113, 823e839.<br />
O’Dowd, C.D., Lowe, J.A., Smith, M.H., 1997. Mar<strong>in</strong>e aerosol, sea-salt, and <strong>the</strong> mar<strong>in</strong>e<br />
sulphur cycle: a short <strong>review</strong>. Atmospheric Environment 31, 73e80.<br />
O’Dowd, C.D., Aalto, P., Hameri, K., Kulmala, M., H<strong>of</strong>fmann, T., 2002. Aerosol<br />
formation: atmospheric particles from organic vapours. Nature 416, 497e498.<br />
O’Dowd, C.D., Facch<strong>in</strong>i, M.C., Cavalli, F., Ceburnis, D., Mircea, M., Decesari, S.,<br />
Fuzzi, S., Jun Yoon, Y.J., Putaud, J.-P., 2004. Biogenically driven organic contribution<br />
to mar<strong>in</strong>e aerosol. Nature 431, 676e680.<br />
Osunsanya, T., Prescott, G., Seaton, A., 2001. Acute respiratory effects <strong>of</strong> particles:<br />
mass or number? Occupational and Environmental Medic<strong>in</strong>e 58, 154e159.<br />
Park, K., Cao, F., Kittelson, D.B., McMurray, P.H., 2003. Relationship between particle<br />
mass and mobility for diesel exhaust particles. Environmental Science and<br />
Technology 37, 577e583.<br />
Park<strong>in</strong>, C., 2008. Update <strong>of</strong> UN-ECE Particle Measurement Programme (PMP).<br />
Cambridge Particle Meet<strong>in</strong>g, Department <strong>of</strong> Eng<strong>in</strong>eer<strong>in</strong>g, University <strong>of</strong> Cambridge<br />
(UK), May 16, 2008. Download from http://www-diva.eng.cam.ac.uk/<br />
energy/nickparticle/particle_meet<strong>in</strong>g_2008/CPark<strong>in</strong>(DfT)_PMP.pdf.<br />
Pekkanen, J., Timonen, K.L., Ruuskanen, J., Reponen, A., Mirme, A., 1997. Effects <strong>of</strong><br />
ultraf<strong>in</strong>e and f<strong>in</strong>e particles <strong>in</strong> <strong>urban</strong> air on peak flow respiratory flow among<br />
children with asthmatic symptoms. Environmental Research 74, 24e33.<br />
Pentt<strong>in</strong>en, P., Timonen, K.L., Tiittanen, P., Mirme, A., Ruuskanen, J., 2001. Number<br />
concentration and size <strong>of</strong> particles <strong>in</strong> <strong>urban</strong> air: effects on spirometric lung<br />
function <strong>in</strong> adult asthmatic subjects. Environmental Health Perspectives 109,<br />
319e323.<br />
Peters, A., Wichmann, H.E., Tuch, T., He<strong>in</strong>rich, J., Heyder, J., 1997. Respiratory effects<br />
are associated with <strong>the</strong> number <strong>of</strong> ultraf<strong>in</strong>e particles. American Journal <strong>of</strong><br />
Respiratory and Critical Care Medic<strong>in</strong>e 155, 1376e1383.<br />
Peters, A., von Klot, S., Heier, H., Trent<strong>in</strong>aglia, I., Hormann, A., Wichmann, H.E.,<br />
Lowel, H., 2004. Exposure to traffic and <strong>the</strong> onset <strong>of</strong> myocardial <strong>in</strong>fraction. The<br />
New England Journal <strong>of</strong> Medic<strong>in</strong>e 351, 1861e1870.<br />
Pey, J., Querol, X., Alastuey, A., Rodríguez, S., Putaud, J.P., Van D<strong>in</strong>genen, R., 2009.<br />
Source apportionment <strong>of</strong> <strong>urban</strong> f<strong>in</strong>e and ultra f<strong>in</strong>e particle number concentration<br />
<strong>in</strong> a Western Mediterranean City. Atmospheric Environment 43,<br />
4407e4415.<br />
Pirjola, L., Kulmala, M., 2001. Development <strong>of</strong> particle size and composition<br />
distributions with a novel aerosol dynamics model. Tellus Series B e Chemical<br />
and Physical Meteorology 53, 491e509.<br />
Pohjola, M., Pirjola, L., Kukkonen, J., Kulmala, M., 2003. Modell<strong>in</strong>g <strong>of</strong> <strong>the</strong> <strong>in</strong>fluence <strong>of</strong><br />
aerosol processes for <strong>the</strong> dispersion <strong>of</strong> vehicular exhaust plumes <strong>in</strong> street<br />
environment. Atmospheric Environment 37, 339e351.<br />
Pope III, C.A., Dockery, D.W., 2006. Health effects <strong>of</strong> f<strong>in</strong>e particulate air pollution:<br />
L<strong>in</strong>es that connect. Journal <strong>of</strong> Air & Waste Management Association 56,<br />
707e742.<br />
Raes, F., D<strong>in</strong>genen, R.V., Vignati, E., Wilson, J., Putaud, J.-P., Se<strong>in</strong>feld, J.H., Adams, P.,<br />
2000. Formation and cycl<strong>in</strong>g <strong>of</strong> aerosols <strong>in</strong> <strong>the</strong> global troposphere. Atmospheric<br />
Environment 34, 4215e4240.<br />
Rickeard, D.J., Bateman, J.R., Kwon, Y.K., McAughey, J.J., Dickens, C.J., 1996. Exhaust<br />
Particulate Size Distribution: Vehicle and Fuel Influences <strong>in</strong> Light Duty Vehicles.<br />
Society <strong>of</strong> Automotive Eng<strong>in</strong>eers, Warrendale, PA, 961980.<br />
Riip<strong>in</strong>en, S., Kulmala, M., Arnold, F., Dal Maso, M., Birmili, W., Saarnio, K., Te<strong>in</strong>ilä, K.,<br />
Kerm<strong>in</strong>en, V., Laaksonen, A., Leht<strong>in</strong>en, K., 2007. Connections between atmospheric<br />
sulphuric acid and new particle formation dur<strong>in</strong>g QUEST IIIeIV<br />
campaigns <strong>in</strong> Heidelberg and Hyytiälä. Atmospheric Chemistry and Physics 7,<br />
1899e1914.<br />
Rose, D., Wehner, B., Ketzel, M., Engler, C., Voigtländer, J., Tuch, T., Wiedensohler, A.,<br />
2006. Atmospheric number size distributions <strong>of</strong> soot particles and estimation <strong>of</strong><br />
emission factors. Atmospheric Chemistry and Physics 6, 1021e1031.<br />
Roth, E., Kehrli, D., Bonnot, K., Trouve, G., 2008. Size distribution <strong>of</strong> f<strong>in</strong>e and ultraf<strong>in</strong>e<br />
particles <strong>in</strong> <strong>the</strong> city <strong>of</strong> Strasbourg: correlation between number <strong>of</strong> particles and<br />
concentrations <strong>of</strong> NO x and SO 2 gases and some soluble ions concentration<br />
determ<strong>in</strong>ation. Journal <strong>of</strong> Environmental Management 86, 282e290.<br />
Ruckerl, R., Ibald-Mulli, A., Koenig, W., Schneider, A., Woelke, G., Cyrys, J.,<br />
He<strong>in</strong>rich, J., Marder, V., Frampton, M., Wichmann, H.E., Peters, A., 2006. Air<br />
pollution and markers <strong>of</strong> <strong>in</strong>flammation and coagulation <strong>in</strong> patients with<br />
coronary heart disease. American Journal <strong>of</strong> Respiratory and Critical Care<br />
Medic<strong>in</strong>e 173, 432e441.<br />
Sakurai, H., Tobias, K., Park, D., Zarl<strong>in</strong>g, K.S., Docherty, D., Kittelson, D.B.,<br />
McMurry, P.H., Zeimann, P.J., 2003. On-l<strong>in</strong>e measurements <strong>of</strong> diesel nanoparticle<br />
composition and volatility. Atmospheric Environment 37, 1199e1210.<br />
Saxe, H., Larsen, T., 2004. Air pollution from ships <strong>in</strong> three Danish ports. Atmospheric<br />
Environment 38, 4057e4067.<br />
Schauer, J.J., Hildermann, L.M., Mazurek, M.A., Cass, G.R., Simoneit, B.R.T., 1996.<br />
Source apportionment <strong>of</strong> airborne particulate matter us<strong>in</strong>g organic compounds<br />
as tracers. Atmospheric Environment 30, 3837e3855.<br />
Schwartz, J., 1994. PM 10 , ozone, and hospital admissions for <strong>the</strong> elderly <strong>in</strong> M<strong>in</strong>neapolis-St.<br />
Paul. Archives <strong>of</strong> Environmental Health 49, 366e374.<br />
Schwartz, J., 2000. Daily deaths are associated with combustion particles ra<strong>the</strong>r than<br />
SO 2 <strong>in</strong> Philadelphia. Occupational and Environmental Medic<strong>in</strong>e 57, 692e697.<br />
Schwikowski, M., Seibert, P., Baltensperger, U., Gaggeler, H.W., 1995. A study <strong>of</strong> an<br />
outstand<strong>in</strong>g Saharan dust event at <strong>the</strong> high-alp<strong>in</strong>e site Jungfraujoch,<br />
Switzerland. Atmospheric Environment 29, 1829e1842.<br />
Seaton, A., MacNee, N., Donaldson, K., Godden, D., 1995. Particulate air pollution and<br />
acute health effects. Lancet 345, 176e178.<br />
Seaton, A., Soutar, A., Crawford, V., Elton, R., McNerlan, S., Cherrie, J., Watt, M., Agius, R.,<br />
Stourt, R., 1999. Particulate air pollution and <strong>the</strong> blood. Thorax 54, 1027e1032.<br />
Secker, D.R., Kaye, P.H., Hirst, E., 2001. Real-time observation <strong>of</strong> <strong>the</strong> change <strong>in</strong> light<br />
scatter<strong>in</strong>g from droplets with <strong>in</strong>creas<strong>in</strong>g deformity. Optics Express 8, 290e295.<br />
Se<strong>in</strong>feld, J.H., Pandis, S.N., 2006. Atmospheric Chemistry and Physics, from Air<br />
Pollution to Climate Change. John Wiley, New York, 1203 pp.<br />
Shi, J.P., Evans, D.E., Khan, A.A., Harrison, R.M., 2001. Sources and concentration <strong>of</strong><br />
<strong>nanoparticles</strong> (
18<br />
P. Kumar et al. / Atmospheric Environment xxx (2010) 1e18<br />
Vardoulakis, S., Fisher, B.R.A., Pericleous, K., Gonzalez-Flesca, N., 2003. Modell<strong>in</strong>g air<br />
quality <strong>in</strong> street canyons: a <strong>review</strong>. Atmospheric Environment 37, 155e182.<br />
Vardoulakis, S., Valiantis, M., Milner, J., ApSimon, H., 2007. Operational air pollution<br />
modell<strong>in</strong>g <strong>in</strong> <strong>the</strong> UK e street canyon applications and challenges. Atmospheric<br />
Environment 41, 4622e4637.<br />
Vignati, E., 1999. Modell<strong>in</strong>g Interactions Between Aerosols and Gaseous Compounds<br />
<strong>in</strong> <strong>the</strong> Polluted Mar<strong>in</strong>e Atmosphere. PhD <strong>the</strong>sis. Riso National Laboratory,<br />
Denmark Report: Riso-R-1163(EN).<br />
Waggoner, A.P., Weiss, R.E., Ahlquist, N.C., Covert, D.S., Will, S., Charlson, R.J., 1981.<br />
Optical characteristic <strong>of</strong> atmospheric aerosols. Atmospheric Environment 15,<br />
1891e1909.<br />
Wahl<strong>in</strong>, P., Palmgren, F., Van D<strong>in</strong>genen, R., 2001. Experimental studies <strong>of</strong> ultraf<strong>in</strong>e<br />
particles <strong>in</strong> streets and <strong>the</strong> relationship <strong>of</strong> traffic. Atmospheric Environment 35,<br />
S63eS69.<br />
Wang, S.C., Flagan, R.C., 1989. Scann<strong>in</strong>g Electrical Mobility Spectrometer. Division <strong>of</strong><br />
Eng<strong>in</strong>eer<strong>in</strong>g and Applied Science, California Institute <strong>of</strong> Technology, Pasadena,<br />
CA 91125, pp. 138e178.<br />
Wehner, B., Birmili, W., Gnauk, T., Wiedensohler, A., 2002. Particle number size<br />
distributions <strong>in</strong> a street canyon and <strong>the</strong>ir transformation <strong>in</strong>to <strong>the</strong> <strong>urban</strong> air<br />
background: measurements and a simple model study. Atmospheric Environment<br />
36, 2215e2223.<br />
Wehner, B., Philipp<strong>in</strong>, S., Wiedensohler, A., Scheer, V., Vogt, R., 2004. Variability <strong>of</strong><br />
non-volatile fractions <strong>of</strong> atmospheric aerosol particles with traffic <strong>in</strong>fluence.<br />
Atmospheric Environment 38, 6081e6090.<br />
Wehner, B., Uhrner, U., von Löwis, S., Zall<strong>in</strong>ger, M., Wiedensohler, A., 2009. Aerosol<br />
number size distributions with<strong>in</strong> <strong>the</strong> exhaust plume <strong>of</strong> a diesel and a gasol<strong>in</strong>e<br />
passenger car under on-road conditions and determ<strong>in</strong>ation <strong>of</strong> emission factors.<br />
Atmospheric Environment 43, 1235e1245.<br />
Wichmann, H.E., Spix, C., Tuch, T., Wolke, G., Peters, A., He<strong>in</strong>rich, J., Kreyl<strong>in</strong>g, W.G.,<br />
Heyder, J., 2000. Daily mortality and f<strong>in</strong>e and ultraf<strong>in</strong>e particles <strong>in</strong> Erfurt,<br />
Germany. Part e I: role <strong>of</strong> particle number and mass. Research Report (Health<br />
Effect Institute) 98, 5e86.<br />
Wiedensohler, A., Lütkemeier, E., Feldpausch, M., Helsper, C., 1986. Investigation <strong>of</strong><br />
<strong>the</strong> bipolar charge distribution at various gas conditions. Journal <strong>of</strong> Aerosol<br />
Science 17, 413e416.<br />
Xia, T., Li, N., Nel, A.E., 2009. Potential health impact <strong>of</strong> <strong>nanoparticles</strong>. Annual<br />
Review <strong>of</strong> Public Health 30, 137e150.<br />
Zhang, K.M., Wexler, A.S., 2002. Model<strong>in</strong>g <strong>the</strong> number distributions <strong>of</strong> <strong>urban</strong> and regional<br />
aerosols: <strong>the</strong>oretical foundations. Atmospheric Environment 36, 1863e1874.<br />
Zhang, K.M., Wexler, A.S., Zhu, Y.F., H<strong>in</strong>ds, W.C., Sioutas, C., 2004. Evolution <strong>of</strong><br />
particle number distribution near roadways e part II: <strong>the</strong> ‘Road-to-Ambient’<br />
process. Atmospheric Environment 38, 6655e6665.<br />
Please cite this article <strong>in</strong> press as: Kumar, P., et al., A <strong>review</strong> <strong>of</strong> <strong>the</strong> <strong>characteristics</strong> <strong>of</strong> <strong>nanoparticles</strong> <strong>in</strong> <strong>the</strong> <strong>urban</strong> atmosphere and <strong>the</strong>..., Atmospheric<br />
Environment (2010), doi:10.1016/j.atmosenv.2010.08.016