Annual report financial statements - Meridian Energy
Annual report financial statements - Meridian Energy
Annual report financial statements - Meridian Energy

Create successful ePaper yourself
Turn your PDF publications into a flip-book with our unique Google optimized e-Paper software.
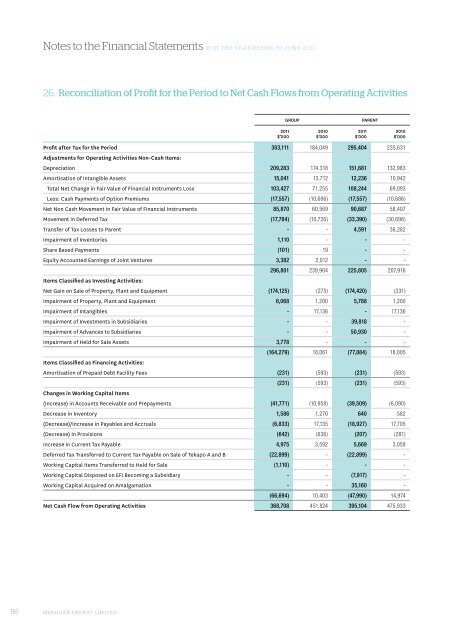
Notes to the Financial Statements FOR THE YEAR ENDED 30 JUNE 2011<br />
26. Reconciliation of Profit for the Period to Net Cash Flows from Operating Activities<br />
GROUP<br />
PARENT<br />
Profit after Tax for the Period 303,111 184,049 295,404 235,631<br />
Adjustments for Operating Activities Non-Cash Items:<br />
Depreciation 209,283 174,318 151,681 132,983<br />
Amortisation of Intangible Assets 15,041 13,712 12,236 10,942<br />
Total Net Change in Fair Value of Financial Instruments Loss 103,427 71,255 108,244 69,093<br />
Less: Cash Payments of Option Premiums (17,557) (10,686) (17,557) (10,686)<br />
Net Non Cash Movement in Fair Value of Financial Instruments 85,870 60,569 90,687 58,407<br />
Movement in Deferred Tax (17,784) (10,726) (33,390) (30,698)<br />
Transfer of Tax Losses to Parent - - 4,591 36,282<br />
Impairment of Inventories 1,110 - - -<br />
Share Based Payments (101) 19 - -<br />
Equity Accounted Earnings of Joint Ventures 3,382 2,012 - -<br />
296,801 239,904 225,805 207,916<br />
Items Classified as Investing Activities:<br />
Net Gain on Sale of Property, Plant and Equipment (174,125) (275) (174,420) (331)<br />
Impairment of Property, Plant and Equipment 6,068 1,200 5,788 1,200<br />
Impairment of Intangibles - 17,136 - 17,136<br />
Impairment of Investments in Subsidiaries - - 39,818 -<br />
Impairment of Advances to Subsidiaries - - 50,930 -<br />
Impairment of Held for Sale Assets 3,778 - - -<br />
(164,279) 18,061 (77,884) 18,005<br />
Items Classified as Financing Activities:<br />
Amortisation of Prepaid Debt Facility Fees (231) (593) (231) (593)<br />
(231) (593) (231) (593)<br />
Changes in Working Capital Items<br />
(Increase) in Accounts Receivable and Prepayments (41,771) (10,958) (39,509) (6,090)<br />
Decrease in Inventory 1,586 1,270 640 582<br />
(Decrease)/Increase in Payables and Accruals (6,833) 17,135 (18,927) 17,705<br />
(Decrease) in Provisions (642) (636) (207) (281)<br />
Increase in Current Tax Payable 4,975 3,592 5,669 3,058<br />
Deferred Tax Transferred to Current Tax Payable on Sale of Tekapo A and B (22,899) - (22,899) -<br />
Working Capital Items Transferred to Held for Sale (1,110) - - -<br />
Working Capital Disposed on EFI Becoming a Subsidiary - - (7,917) -<br />
Working Capital Acquired on Amalgamation - - 35,160 -<br />
(66,694) 10,403 (47,990) 14,974<br />
Net Cash Flow from Operating Activities 368,708 451,824 395,104 475,933<br />
2011<br />
$’000<br />
2010<br />
$’000<br />
2011<br />
$’000<br />
2010<br />
$’000<br />
56 MERIDIAN ENERGY LIMITED