Towards Operational Excellence and Financial Sustainability
Towards Operational Excellence and Financial Sustainability
Towards Operational Excellence and Financial Sustainability

Create successful ePaper yourself
Turn your PDF publications into a flip-book with our unique Google optimized e-Paper software.
These consolidated fi nancial statements are originally issued in Indonesian language.<br />
PT INDOCEMENT TUNGGAL PRAKARSA Tbk. AND SUBSIDIARIES<br />
NOTES TO THE CONSOLIDATED FINANCIAL STATEMENTS<br />
Years ended December 31, 2004 <strong>and</strong> 2003<br />
(Expressed in rupiah, unless otherwise stated)<br />
s. Segment Reporting<br />
The Company <strong>and</strong> Subsidiaries’ businesses are grouped into three major operating businesses: cement, ready mix<br />
concrete <strong>and</strong> other businesses. <strong>Financial</strong> information on business segments is presented in Note 17.<br />
A business segment is a distinguishable component based on the industry or group of products or services <strong>and</strong> is subject<br />
to risks <strong>and</strong> returns that are different from those of other segments.<br />
t. Stock Issuance Cost<br />
Based on the decision letter No. KEP-06/PM/2000 dated March 13, 2000 of the Chairman of Bapepam, all expenses<br />
related to the issuance of equity securities should be offset against additional paid-in capital.<br />
u. Net Earnings per Share<br />
Basic earnings per share is computed by dividing net earnings by the weighted average number of shares outst<strong>and</strong>ing<br />
during the year, which is 3,681,231,699 shares in 2004 <strong>and</strong> 3,681,229,010 shares in 2003.<br />
In accordance with PSAK No. 56, “Earnings per Share”, the Company did not consider the dilutive effects of its outst<strong>and</strong>ing<br />
warrants issued in computing earnings per share since the exercise price of the outst<strong>and</strong>ing warrants is higher than the<br />
market price of the Company’s shares listed on the stock exchange.<br />
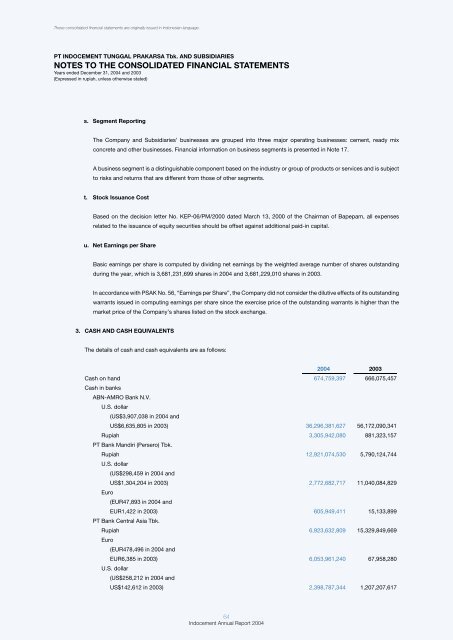
3. CASH AND CASH EQUIVALENTS<br />
The details of cash <strong>and</strong> cash equivalents are as follows:<br />
2004 2003<br />
Cash on h<strong>and</strong> 674,759,397 666,075,457<br />
Cash in banks<br />
ABN-AMRO Bank N.V.<br />
U.S. dollar<br />
(US$3,907,038 in 2004 <strong>and</strong><br />
US$6,635,805 in 2003) 36,296,381,627 56,172,090,341<br />
Rupiah 3,305,942,080 881,323,157<br />
PT Bank M<strong>and</strong>iri (Persero) Tbk.<br />
Rupiah 12,921,074,530 5,790,124,744<br />
U.S. dollar<br />
(US$298,459 in 2004 <strong>and</strong><br />
US$1,304,204 in 2003) 2,772,682,717 11,040,084,829<br />
Euro<br />
(EUR47,893 in 2004 <strong>and</strong><br />
EUR1,422 in 2003) 605,949,411 15,133,899<br />
PT Bank Central Asia Tbk.<br />
Rupiah 6,923,632,809 15,329,849,669<br />
Euro<br />
(EUR478,496 in 2004 <strong>and</strong><br />
EUR6,385 in 2003) 6,053,961,240 67,958,280<br />
U.S. dollar<br />
(US$258,212 in 2004 <strong>and</strong><br />
US$142,612 in 2003) 2,398,787,344 1,207,207,617<br />
64<br />
Indocement Annual Report 2004