An acoustic Doppler velocimeter (ADV) for the ... - LTHE
An acoustic Doppler velocimeter (ADV) for the ... - LTHE
An acoustic Doppler velocimeter (ADV) for the ... - LTHE

You also want an ePaper? Increase the reach of your titles
YUMPU automatically turns print PDFs into web optimized ePapers that Google loves.
1564 N. Gratiot et al. / Continental Shelf Research 20 (2000) 1551}1567<br />
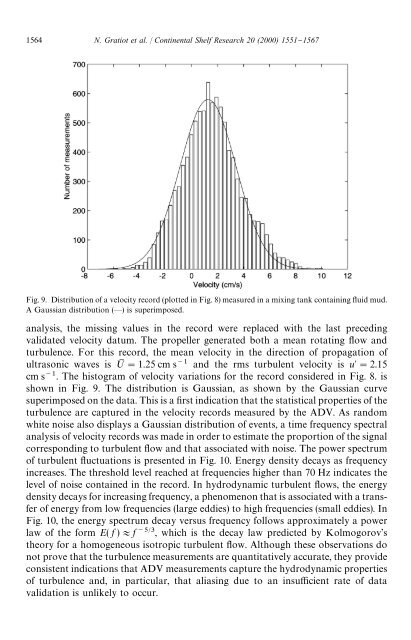
Fig. 9. Distribution of a velocity record (plotted in Fig. 8) measured in a mixing tank containing #uid mud.<br />
A Gaussian distribution (*) is superimposed.<br />
analysis, <strong>the</strong> missing values in <strong>the</strong> record were replaced with <strong>the</strong> last preceding<br />
validated velocity datum. The propeller generated both a mean rotating #ow and<br />
turbulence. For this record, <strong>the</strong> mean velocity in <strong>the</strong> direction of propagation of<br />
ultrasonic waves is ;M "1.25 cm s and <strong>the</strong> rms turbulent velocity is u"2.15<br />
cm s. The histogram of velocity variations <strong>for</strong> <strong>the</strong> record considered in Fig. 8. is<br />
shown in Fig. 9. The distribution is Gaussian, as shown by <strong>the</strong> Gaussian curve<br />
superimposed on <strong>the</strong> data. This is a "rst indication that <strong>the</strong> statistical properties of <strong>the</strong><br />
turbulence are captured in <strong>the</strong> velocity records measured by <strong>the</strong> <strong>ADV</strong>. As random<br />
white noise also displays a Gaussian distribution of events, a time frequency spectral<br />
analysis of velocity records was made in order to estimate <strong>the</strong> proportion of <strong>the</strong> signal<br />
corresponding to turbulent #ow and that associated with noise. The power spectrum<br />
of turbulent #uctuations is presented in Fig. 10. Energy density decays as frequency<br />
increases. The threshold level reached at frequencies higher than 70 Hz indicates <strong>the</strong><br />
level of noise contained in <strong>the</strong> record. In hydrodynamic turbulent #ows, <strong>the</strong> energy<br />
density decays <strong>for</strong> increasing frequency, a phenomenon that is associated with a transfer<br />
of energy from low frequencies (large eddies) to high frequencies (small eddies). In<br />
Fig. 10, <strong>the</strong> energy spectrum decay versus frequency follows approximately a power<br />
law of <strong>the</strong> <strong>for</strong>m E( f )+f , which is <strong>the</strong> decay law predicted by Kolmogorov's<br />
<strong>the</strong>ory <strong>for</strong> a homogeneous isotropic turbulent #ow. Although <strong>the</strong>se observations do<br />
not prove that <strong>the</strong> turbulence measurements are quantitatively accurate, <strong>the</strong>y provide<br />
consistent indications that <strong>ADV</strong> measurements capture <strong>the</strong> hydrodynamic properties<br />
of turbulence and, in particular, that aliasing due to an insu$cient rate of data<br />
validation is unlikely to occur.