Student Admissions, Outcomes, and Other Data - Argosy University
Student Admissions, Outcomes, and Other Data - Argosy University
Student Admissions, Outcomes, and Other Data - Argosy University

Create successful ePaper yourself
Turn your PDF publications into a flip-book with our unique Google optimized e-Paper software.
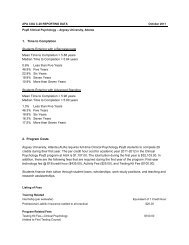
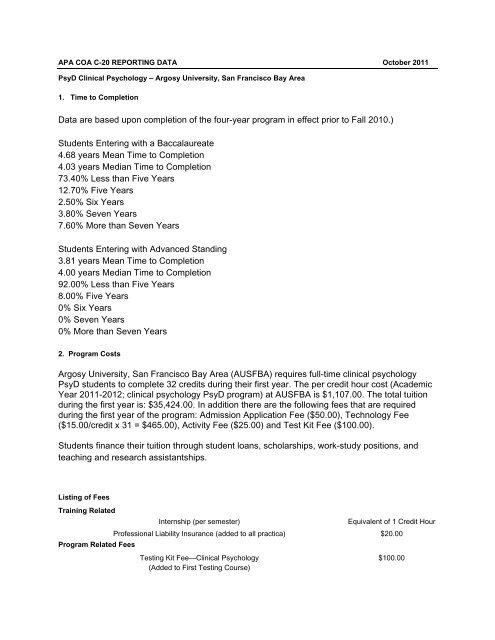
APA COA C-20 REPORTING DATA October 2011<br />
PsyD Clinical Psychology – <strong>Argosy</strong> <strong>University</strong>, San Francisco Bay Area<br />
1. Time to Completion<br />
<strong>Data</strong> are based upon completion of the four-year program in effect prior to Fall 2010.)<br />
<strong>Student</strong>s Entering with a Baccalaureate<br />
4.68 years Mean Time to Completion<br />
4.03 years Median Time to Completion<br />
73.40% Less than Five Years<br />
12.70% Five Years<br />
2.50% Six Years<br />
3.80% Seven Years<br />
7.60% More than Seven Years<br />
<strong>Student</strong>s Entering with Advanced St<strong>and</strong>ing<br />
3.81 years Mean Time to Completion<br />
4.00 years Median Time to Completion<br />
92.00% Less than Five Years<br />
8.00% Five Years<br />
0% Six Years<br />
0% Seven Years<br />
0% More than Seven Years<br />
2. Program Costs<br />
<strong>Argosy</strong> <strong>University</strong>, San Francisco Bay Area (AUSFBA) requires full-time clinical psychology<br />
PsyD students to complete 32 credits during their first year. The per credit hour cost (Academic<br />
Year 2011-2012; clinical psychology PsyD program) at AUSFBA is $1,107.00. The total tuition<br />
during the first year is: $35,424.00. In addition there are the following fees that are required<br />
during the first year of the program: Admission Application Fee ($50.00), Technology Fee<br />
($15.00/credit x 31 = $465.00), Activity Fee ($25.00) <strong>and</strong> Test Kit Fee ($100.00).<br />
<strong>Student</strong>s finance their tuition through student loans, scholarships, work-study positions, <strong>and</strong><br />
teaching <strong>and</strong> research assistantships.<br />
Listing of Fees<br />
Training Related<br />
Internship (per semester)<br />
Equivalent of 1 Credit Hour<br />
Professional Liability Insurance (added to all practica) $20.00<br />
Program Related Fees<br />
Testing Kit Fee—Clinical Psychology<br />
(Added to First Testing Course)<br />
$100.00
<strong>Other</strong> <strong>Student</strong> Charges<br />
Admission Application Fee 1 $50.00<br />
Technology Fee (per credit) $15.00<br />
<strong>Student</strong> Activity Fee 2 --All Graduate Programs (annual) $25.00<br />
Graduation/End of Program Processing Fee 3 $175.00<br />
Add/Drop Fee 4 $50.00<br />
Installment Plan Fee (per semester) $35.00<br />
Late Registration Fee $50.00<br />
Late Payment Fee $25.00<br />
Returned Check Fee $35.00<br />
ID/Security Card Replacement Fee $10.00<br />
Transcript Fee<br />
No Charge<br />
Express Transcript 5 $20.00<br />
1 Non-refundable, except in California <strong>and</strong> Arizona.<br />
2 <strong>Student</strong>s enrolled in no greater than one credit each term are exempt from the <strong>Student</strong> Activity Fee.<br />
3 Graduation/End of Program Processing Fee is assessed to all degree seeking students upon completion of their<br />
program of study <strong>and</strong> prior to the receipt of a diploma.<br />
4 <strong>Student</strong>s who elect to change their schedule after registration may do so by completing a Course Add/Drop Request<br />
Form. The Course Add/Drop Fee is assessed for each request form submitted to the <strong>Student</strong> Services Office once<br />
the term has started. Multiple changes may be submitted on one form.<br />
5 An Express Transcript Fee is charged for transcripts requested to be sent via an overnight carrier.<br />
3. Internships<br />
<strong>Argosy</strong> <strong>University</strong>, SFBA<br />
Internship Placement<br />
Based on students applying for internships for the last seven academic years:<br />
Application for Training Year: 2010-2011 2009-2010 2008-2009 2007-2008 2006-2007 2005-2006 2004-2005<br />
Number of <strong>Student</strong>s Who<br />
Applied for Internship:<br />
52 66 41 45 35 30 19<br />
Number <strong>and</strong> Percent Who<br />
Obtained an Internship:<br />
52<br />
(100%)<br />
66<br />
(100%)<br />
41<br />
(100%)<br />
45<br />
(100%)<br />
33<br />
(94%)<br />
28<br />
(93%)<br />
18<br />
(95%)<br />
Number <strong>and</strong> Percent Who<br />
Received Funded Internships:<br />
38<br />
(73%)<br />
41<br />
(62%)<br />
18<br />
(44%)<br />
16<br />
(36%)<br />
16<br />
(46%)<br />
12<br />
(40%)<br />
6<br />
(32%)<br />
Number <strong>and</strong> Percent Who<br />
Received Unfunded<br />
Internships:<br />
14<br />
(27%)<br />
25<br />
(38%)<br />
23<br />
(56%)<br />
29<br />
(64%)<br />
17<br />
(49%)<br />
16<br />
(53%)<br />
12<br />
(63%)
Number <strong>and</strong> Percent Who<br />
received APA or CPA -<br />
Accredited Internships:<br />
2<br />
(4%)<br />
3<br />
(5%)<br />
1<br />
(2%)<br />
9<br />
(20%)<br />
7<br />
(20%)<br />
6<br />
(20%)<br />
2<br />
(11%)<br />
Number <strong>and</strong> Percent Who<br />
Received non-accredited<br />
APPIC member internships<br />
12<br />
(23%)<br />
12<br />
(18%)<br />
9<br />
(22%)<br />
6<br />
(13%)<br />
4<br />
(11%)<br />
2<br />
(7%)<br />
1<br />
(5%)<br />
Number <strong>and</strong> Percent Who<br />
Received non-accredited<br />
CAPIC member internships<br />
38<br />
(73%)<br />
50<br />
(76%)<br />
31<br />
(76%)<br />
29<br />
(64%)<br />
21<br />
(60%)<br />
18<br />
(60%)<br />
15<br />
(79%)<br />
Number <strong>and</strong> Percent Who<br />
obtained 2-year half- time<br />
internships<br />
18<br />
(34%)<br />
17<br />
(26%)<br />
14<br />
(34%)<br />
12<br />
(27%)<br />
12<br />
(34%)<br />
9<br />
(30%)<br />
8<br />
(42%)<br />
*Consistent with CoA’s Implementing Regulation C‐20, the percentages were calculated using the total number of students<br />
applying for internship that year (as opposed to the percentage of the students who obtained internship).<br />
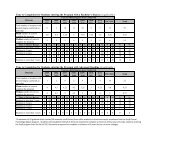
4. Attrition<br />
The table below lists the cohort attrition for each class in accordance with the American<br />
Psychological Association’s Commission of Accreditation (CoA) Implementing Regulations (C-<br />
20: Disclosure of Education/Training <strong>Outcomes</strong> <strong>and</strong> Information). It is important to note that<br />
cohort attrition is not the same as annual attrition (the percentage of students who either<br />
withdraw or are dismissed in a year). Also, this table provides attrition information about each<br />
class at a moment in time, <strong>and</strong> does not (except arguably for the information for the class with 7<br />
years information) provide total cohort attrition (the attrition rate for the total class across the<br />
total time the class is in the program).<br />
Year of first<br />
enrollment<br />
2010 C-20 Attrition Rate for <strong>Argosy</strong> <strong>University</strong>, SFBA<br />
Number of<br />
students enrolled<br />
Number <strong>and</strong><br />
percentage who<br />
graduated with<br />
doctorate<br />
Number <strong>and</strong><br />
percentage of<br />
students still<br />
enrolled in<br />
program<br />
Number <strong>and</strong><br />
percentage of<br />
students no longer<br />
enrolled for any<br />
reason other than<br />
graduation<br />
2003-2004 43 25 58% 7 16% 11 26%<br />
2004-2005 61 31 51% 18 30% 12 20%<br />
2005-2006 66 29 44% 24 36% 13 20%<br />
2006-2007 56 1 2% 46 82% 9 16%<br />
2007-2008 70 0 0% 61 87% 10 14%<br />
2008-2009 61 0 0% 48 79% 14 23%
2009-2010 43 0 0% 40 93% 3 7%<br />
5. Licensure *<br />
Number of graduates 2-10 years post-graduation (2000-2008) = 122<br />
Number of graduates with known licensure status = 109<br />
Number of graduates licensed as psychologists = 86<br />
Percentage of graduates licensed = 70%**<br />
Percentage of graduates with known status licensed = 79%<br />
* Based upon data collected through January 2011<br />
** According to the APA Implementing Regulations (C-20) accredited doctoral programs’<br />
licensure rate must be calculated by dividing the number of graduates who became licensed<br />
psychologists in the 8 year span from 2 to 10 years ago by the number of doctoral degrees<br />
awarded by the program over that same period; graduates whose status is unknown are<br />
counted as unlicensed.<br />
For <strong>Argosy</strong> <strong>University</strong>, San Francisco Bay Area, we have 122 graduates between 2000 <strong>and</strong><br />
2008. We know the licensure status of 109 of our graduates <strong>and</strong> of those 109, 86 are licensed.<br />
According to the APA formula this results in a licensure rate of 70%. The percent licensed from<br />
known graduates is 79% (86 of the 109 graduates whose licensure status is known).