Ophir Energy plc Annual Report and Accounts 2011
Ophir Energy plc Annual Report and Accounts 2011
Ophir Energy plc Annual Report and Accounts 2011

You also want an ePaper? Increase the reach of your titles
YUMPU automatically turns print PDFs into web optimized ePapers that Google loves.
88<br />
<strong>Ophir</strong> <strong>Energy</strong> <strong>plc</strong> <strong>Annual</strong> <strong>Report</strong> <strong>2011</strong><br />
Notes to the financial statements continued<br />
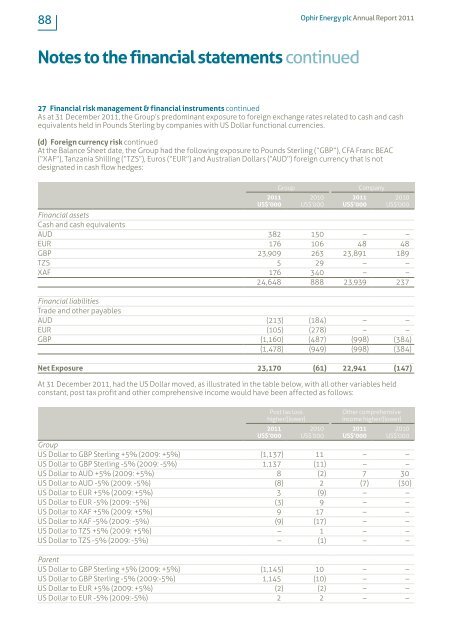
27 Financial risk management & financial instruments continued<br />
As at 31 December <strong>2011</strong>, the Group’s predominant exposure to foreign exchange rates related to cash <strong>and</strong> cash<br />
equivalents held in Pounds Sterling by companies with US Dollar functional currencies.<br />
(d) Foreign currency risk continued<br />
At the Balance Sheet date, the Group had the following exposure to Pounds Sterling (“GBP”), CFA Franc BEAC<br />
(“XAF”), Tanzania Shilling (“TZS”), Euros (“EUR”) <strong>and</strong> Australian Dollars (“AUD”) foreign currency that is not<br />
designated in cash flow hedges:<br />
Group<br />
<strong>2011</strong><br />
US$’000<br />
2010<br />
US$’000<br />
<strong>2011</strong><br />
US$’000<br />
Company<br />
2010<br />
US$’000<br />
Financial assets<br />
Cash <strong>and</strong> cash equivalents<br />
AUD 382 150 – –<br />
EUR 176 106 48 48<br />
GBP 23,909 263 23,891 189<br />
TZS 5 29 – –<br />
XAF 176 340 – –<br />
24,648 888 23,939 237<br />
Financial liabilities<br />
Trade <strong>and</strong> other payables<br />
AUD (213) (184) – –<br />
EUR (105) (278) – –<br />
GBP (1,160) (487) (998) (384)<br />
(1,478) (949) (998) (384)<br />
Net Exposure 23,170 (61) 22,941 (147)<br />
At 31 December <strong>2011</strong>, had the US Dollar moved, as illustrated in the table below, with all other variables held<br />
constant, post tax profit <strong>and</strong> other comprehensive income would have been affected as follows:<br />
Post tax loss<br />
higher/(lower)<br />
<strong>2011</strong><br />
US$’000<br />
2010<br />
US$’000<br />
Other comprehensive<br />
income higher/(lower)<br />
<strong>2011</strong><br />
US$’000<br />
2010<br />
US$’000<br />
Group<br />
US Dollar to GBP Sterling +5% (2009: +5%) (1,137) 11 – –<br />
US Dollar to GBP Sterling -5% (2009: -5%) 1,137 (11) – –<br />
US Dollar to AUD +5% (2009: +5%) 8 (2) 7 30<br />
US Dollar to AUD -5% (2009: -5%) (8) 2 (7) (30)<br />
US Dollar to EUR +5% (2009: +5%) 3 (9) – –<br />
US Dollar to EUR -5% (2009: -5%) (3) 9 – –<br />
US Dollar to XAF +5% (2009: +5%) 9 17 – –<br />
US Dollar to XAF -5% (2009: -5%) (9) (17) – –<br />
US Dollar to TZS +5% (2009: +5%) – 1 – –<br />
US Dollar to TZS -5% (2009: -5%) – (1) – –<br />
Parent<br />
US Dollar to GBP Sterling +5% (2009: +5%) (1,145) 10 – –<br />
US Dollar to GBP Sterling -5% (2009:-5%) 1,145 (10) – –<br />
US Dollar to EUR +5% (2009: +5%) (2) (2) – –<br />
US Dollar to EUR -5% (2009:-5%) 2 2 – –