Equity Valuation and Analysis - Mark Moore
Equity Valuation and Analysis - Mark Moore
Equity Valuation and Analysis - Mark Moore

Create successful ePaper yourself
Turn your PDF publications into a flip-book with our unique Google optimized e-Paper software.
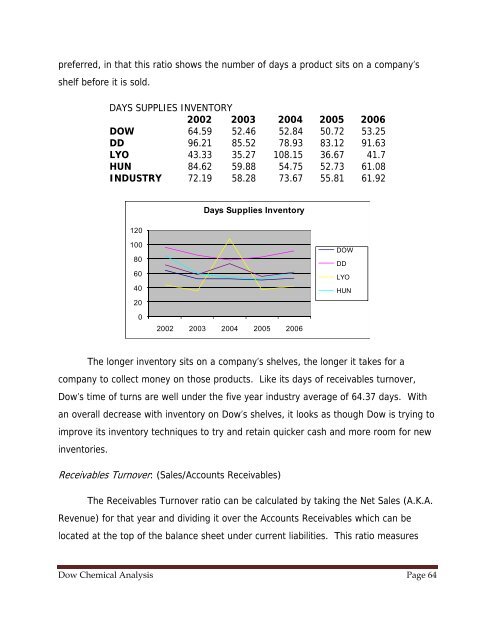
preferred, in that this ratio shows the number of days a product sits on a company’s<br />
shelf before it is sold.<br />
DAYS SUPPLIES INVENTORY<br />
2002 2003 2004 2005 2006<br />
DOW 64.59 52.46 52.84 50.72 53.25<br />
DD 96.21 85.52 78.93 83.12 91.63<br />
LYO 43.33 35.27 108.15 36.67 41.7<br />
HUN 84.62 59.88 54.75 52.73 61.08<br />
INDUSTRY 72.19 58.28 73.67 55.81 61.92<br />
120<br />
Days Supplies Inventory<br />
100<br />
80<br />
60<br />
40<br />
20<br />
DOW<br />
DD<br />
LYO<br />
HUN<br />
0<br />
2002 2003 2004 2005 2006<br />
The longer inventory sits on a company’s shelves, the longer it takes for a<br />
company to collect money on those products. Like its days of receivables turnover,<br />
Dow’s time of turns are well under the five year industry average of 64.37 days. With<br />
an overall decrease with inventory on Dow’s shelves, it looks as though Dow is trying to<br />
improve its inventory techniques to try <strong>and</strong> retain quicker cash <strong>and</strong> more room for new<br />
inventories.<br />
Receivables Turnover: (Sales/Accounts Receivables)<br />
The Receivables Turnover ratio can be calculated by taking the Net Sales (A.K.A.<br />
Revenue) for that year <strong>and</strong> dividing it over the Accounts Receivables which can be<br />
located at the top of the balance sheet under current liabilities. This ratio measures<br />
Dow Chemical <strong>Analysis</strong> Page 64