APP Sustainability Report 2008-2009 - Asia Pulp and Paper
APP Sustainability Report 2008-2009 - Asia Pulp and Paper
APP Sustainability Report 2008-2009 - Asia Pulp and Paper

Create successful ePaper yourself
Turn your PDF publications into a flip-book with our unique Google optimized e-Paper software.
Sustainable Products<br />
Sustainable Products<br />
Table 21 - Water Quality: Effluent discharged<br />
Key Parameters<br />
The site’s wastewater discharge, at 52<br />
m 3 per AD tonne in <strong>2008</strong> <strong>and</strong> 51 m 3 per<br />
AD tonne in <strong>2009</strong>, represents a generally<br />
satisfactory performance, when compared<br />
against World Bank / IFC Guideline values for<br />
bleached kraft pulp mills of 50 m 3 of effluent<br />
discharged per AD tonne of pulp.<br />
River Water Quality<br />
Our river water quality monitoring<br />
programme, undertaken both upstream<br />
of our raw water intake <strong>and</strong> downstream<br />
of our discharge point in accordance with<br />
our RPL statutory monitoring obligations,<br />
did not detect any significant level of<br />
non-compliance with local regulatory<br />
st<strong>and</strong>ards, other than for high BOD values.<br />
The quality of water in the Pengabuan river<br />
is influenced by activities upstream from<br />
the Lontar Papyrus site, <strong>and</strong> BOD readings<br />
in excess of regulatory st<strong>and</strong>ards are<br />
generally encountered at the point where<br />
our raw water is drawn. This prevailing poor<br />
river water quality makes it all the more<br />
important that our wastewater does not<br />
contribute further to the existing pollution<br />
load.<br />
<strong>2008</strong> <strong>2009</strong> Local St<strong>and</strong>ard <strong>2008</strong> <strong>2009</strong> WB / IFC<br />
St<strong>and</strong>ard<br />
(mg/l, except pH)<br />
Emissions to Atmosphere<br />
Stack air quality monitoring<br />
The mill’s statutory obligations, as defined its<br />
AMDAL / RPL / RKL authorisations, identify<br />
36 point source locations within the plant<br />
which must be periodically monitored <strong>and</strong><br />
the data reported. All specified emission<br />
points are monitored monthly <strong>and</strong> the<br />
results submitted to KLH semi-annually.<br />
Lontar Papyrus mill’s monitoring data<br />
indicates, as reported in our 6-monthly RPL<br />
submissions, that atmospheric emissions<br />
from our processes did not exceed statutory<br />
limits in either <strong>2008</strong> or <strong>2009</strong>. The mill did not<br />
exceed any of the limit values set by local<br />
regulatory st<strong>and</strong>ards for all emission points<br />
measured.<br />
Ambient Air Quality Monitoring<br />
Ambient air quality monitoring specified in<br />
our RPL was fully complied with in both <strong>2008</strong><br />
<strong>and</strong> <strong>2009</strong>, <strong>and</strong> indicated fully satisfactory air<br />
quality in the vicinity of our mill. Ambient<br />
air quality within our site was similarly<br />
monitored <strong>and</strong> found to be fully satisfactory.<br />
(kg/ADT, except pH)<br />
BOD 40.55 43.90 100 1.67 1.79 1<br />
COD 245.07 252.70 300 10.28 10.22 20<br />
TSS 49.79 58.40 100 2.13 2.39 1.5<br />
AOX 5.25 5.18 – 0.22 0.21 0.25<br />
pH 7.49 7.05 6 – 9 6 – 9<br />
Table 22 - Recovery + Multi-fuel Boiler Stack Air Emissions – Aggregated Values<br />
Ozone Depleting Substances<br />
Lontar Papyrus has monitored its ODS<br />
consumption since 1996, through its<br />
ISO14001:2004 Environmental Monitoring<br />
System, <strong>and</strong> is seeking ways to replace any<br />
freon refrigerants with more environmentally<br />
friendly ones.<br />
The use of freon in the mill now is purely<br />
for re-charging existing air conditioning <strong>and</strong><br />
chiller units in buildings <strong>and</strong> in the process<br />
operations. We aim to phase out the use<br />
of all freon on-site, by 2030. The annual<br />
consumption of freon was reduced by over<br />
60 percent, from 5,973 kg in <strong>2008</strong> to 2,186<br />
kg in <strong>2009</strong>.<br />
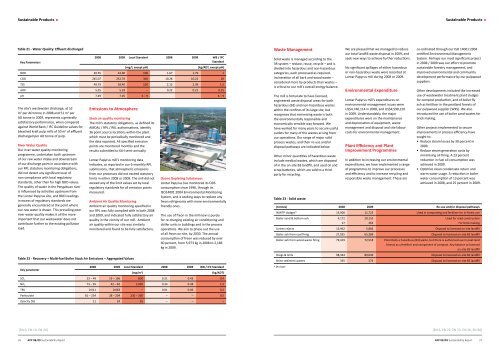
Waste Management<br />
Solid waste is managed according to the<br />
3R system – reduce, reuse, recycle – <strong>and</strong> is<br />
divided into hazardous <strong>and</strong> non-hazardous<br />
categories, each processed as required.<br />
Incineration of all bark <strong>and</strong> wood waste –<br />
considered more by-products than wastes –<br />
is critical to our mill’s overall energy balance.<br />
The mill is fortunate to have licensed,<br />
engineered waste disposal areas for both<br />
hazardous (B3) <strong>and</strong> non-hazardous wastes<br />
within the confines of its large site, but<br />
recognises that minimizing waste is both<br />
the environmentally responsible <strong>and</strong><br />
economically sensible way forward. We<br />
have worked for many years to secure useful<br />
outlets for many of the wastes arising from<br />
our operations. Our range of major solid<br />
process wastes, <strong>and</strong> their re-use <strong>and</strong>/or<br />
disposal pathways are indicated below.<br />
Other minor quantities of hazardous waste<br />
include medical wastes, which are disposed<br />
of in the on-site B3 l<strong>and</strong>fill, <strong>and</strong> used oil <strong>and</strong><br />
scrap batteries, which are sold to a third<br />
party for recycling.<br />
Table 23 - Solid waste<br />
We are pleased that we managed to reduce<br />
our total l<strong>and</strong>fill waste disposal in <strong>2009</strong>, <strong>and</strong><br />
seek new ways to achieve further reductions.<br />
No significant spillages of either hazardous<br />
or non-hazardous waste were recorded at<br />
Lontar Papyrus mill during <strong>2008</strong> or <strong>2009</strong>.<br />
Environmental Expenditure<br />
Lontar Papyrus mill’s expenditures on<br />
environmental management issues were<br />
US$4,740,114 in <strong>2008</strong>, <strong>and</strong> US$4,598,210<br />
in <strong>2009</strong>. Underst<strong>and</strong>ably, the major<br />
expenditures were on the maintenance<br />
<strong>and</strong> depreciation of equipment, waste<br />
management <strong>and</strong> disposal <strong>and</strong> site labour<br />
costs for environmental management.<br />
Plant Efficiency <strong>and</strong> Plant<br />
Improvement Programmes<br />
In addition to increasing our environmental<br />
expenditures, we have implemented a range<br />
of programmes to improve our processes<br />
<strong>and</strong> efficiency <strong>and</strong> to increase recycling <strong>and</strong><br />
responsible waste management. These are<br />
co-ordinated through our ISO 14001:2004<br />
certified Environmental Management<br />
System. Perhaps our most significant project<br />
in <strong>2008</strong> / <strong>2009</strong> was our effort to promote<br />
sustainable forestry management, <strong>and</strong><br />
improved environmental <strong>and</strong> community<br />
development performance by our pulpwood<br />
suppliers.<br />
Other developments included the increased<br />
use of wastewater treatment plant sludges<br />
for compost production, <strong>and</strong> of boiler fly<br />
ash as fertiliser in the peatl<strong>and</strong> forests of<br />
our pulpwood supplier (WKS). We also<br />
introduced the use of boiler s<strong>and</strong> wastes for<br />
brick making.<br />
Other projects implemented to secure<br />
improvements in process efficiency have<br />
sought to:<br />
• Reduce steam losses by 30 percent in<br />
<strong>2009</strong>.<br />
• Reduce steam generation costs by<br />
minimising oil firing. A 23 percent<br />
reduction in fuel oil consumption was<br />
achieved in <strong>2009</strong>.<br />
• Optimize clean condensate return <strong>and</strong><br />
warm water usage. A reduction in boiler<br />
water consumption of 13 percent was<br />
achieved in <strong>2008</strong>, <strong>and</strong> 25 percent in <strong>2009</strong>.<br />
(tonnes) <strong>2008</strong> <strong>2009</strong> Re-use <strong>and</strong>/or disposal pathways<br />
WWTP sludges* 13,900 11,725 Used in composting <strong>and</strong> fertiliser for in-forest use<br />
Boiler s<strong>and</strong> & bottom ash 4,172<br />
27<br />
20,153<br />
263<br />
Used for road construction<br />
For brick making<br />
Screen rejects 15,962 5,882 Disposal to licensed on-site l<strong>and</strong>fill<br />
Boiler ash from coal firing 27,955 65,388 Disposal to licensed on-site B3 l<strong>and</strong>fill<br />
Boiler ash from wood-waste firing 79,419 72,518 Potentially a hazardous (B3) waste, but there is authorised use in peat-l<strong>and</strong><br />
forests as a fertiliser <strong>and</strong> component of compost. Any balance to licensed<br />
on-site B3 l<strong>and</strong>fill<br />
Dregs & Grits 98,344 89,046 Disposal to licensed on-site B3 l<strong>and</strong>fill<br />
Brine sediment wastes 335 273 Disposal to licensed on-site B3 l<strong>and</strong>fill<br />
Key parameter<br />
<strong>2008</strong> <strong>2009</strong> Local St<strong>and</strong>ard <strong>2008</strong> <strong>2009</strong> WB / IFC St<strong>and</strong>ard<br />
(mg/m 3 )<br />
(kg/ADT)<br />
* Dry base<br />
SO 2<br />
23 – 49 19 – 106 800 0.21 0.43 0.4<br />
NO 2<br />
73 – 95 42 – 82 1,000 0.34 0.38 1.5<br />
TRS 0.011 0.063 – 0.01 0.06 0.2<br />
Particulate 81 – 254 28 – 204 230 – 260 – – 0.5<br />
Opacity (%) 11 24 35 – – –<br />
[EN 9, EN 19, EN 20]<br />
[EN 6, EN 22, EN 23, EN 26, EN 30]<br />
36 <strong>APP</strong> 08/09 <strong>Sustainability</strong> <strong>Report</strong> <strong>APP</strong> 08/09 <strong>Sustainability</strong> <strong>Report</strong> 37