APP Sustainability Report 2008-2009 - Asia Pulp and Paper
APP Sustainability Report 2008-2009 - Asia Pulp and Paper
APP Sustainability Report 2008-2009 - Asia Pulp and Paper

Create successful ePaper yourself
Turn your PDF publications into a flip-book with our unique Google optimized e-Paper software.
Sustainable Products<br />
Sustainable Products<br />
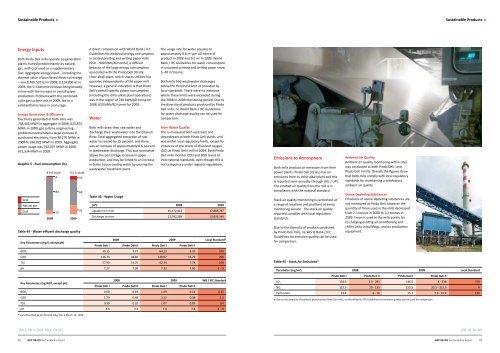
Energy Inputs<br />
Both Pindo Deli mills operate co-generation<br />
plants, fueled predominantly by natural<br />
gas, with coal used as a supplementary<br />
fuel. Aggregate energy input – including the<br />
thermal value of purchased electrical energy<br />
– was 8,760,507 GJ in <strong>2008</strong>, 9,224,200 GJ in<br />
<strong>2009</strong>, the 5.3 percent increase being broadly<br />
in line with the increase in overall paper<br />
production. Problems with the combinedcycle<br />
gas turbine unit in <strong>2009</strong>, led to a<br />
substantial increase in coal usage.<br />
Energy Generation & Efficiency<br />
Electricity generated at both sites was<br />
758,405 MWh in aggregate in <strong>2008</strong>, 625,875<br />
MWh in <strong>2009</strong>; gas turbine engineering<br />
problems necessitated a large increase in<br />
purchased electricity, from 98,270 MWh in<br />
<strong>2008</strong> to 266,822 MWh in <strong>2009</strong>. Aggregate<br />
power usage was 742,037 MWh in <strong>2008</strong>,<br />
672,534 MWh in <strong>2009</strong>.<br />
Graphic 5 - Fuel consumption (%)<br />
Grid<br />
Natural gas<br />
Coal<br />
8.8 G Joule 9.2 G Joule<br />
4<br />
10<br />
84 65<br />
25<br />
12<br />
<strong>2008</strong> <strong>2009</strong><br />
Table 44 - Water effluent discharge quality<br />
Key Parameters (mg/l, except pH)<br />
A direct comparison with World Bank / IFC<br />
Guidelines for electrical energy consumption<br />
in coated printing <strong>and</strong> writing paper mills<br />
(650 – 900 kWh/AD tonne) is difficult<br />
because of the large energy consumption<br />
associated with the Pindo Deli (II) site<br />
chlor-alkali plant, which shares utilities but<br />
operates independently of the paper mill.<br />
However, a general indication is that Pindo<br />
Deli’s overall specific power consumption<br />
(including the chlor-alkali plant operations)<br />
was in the region of 740 kWh/AD tonne for<br />
<strong>2008</strong>, 620 kWh/AD tonne for <strong>2009</strong>.<br />
Water<br />
Both mills draw their raw water <strong>and</strong><br />
discharge their wastewater into the Citarum<br />
River. Total aggregated extraction of raw<br />
water increased by 15 percent, <strong>and</strong> there<br />
was an increase of approximately 8.6 percent<br />
in wastewater discharge. This was somewhat<br />
above the percentage increase in paper<br />
production, <strong>and</strong> may be linked to an increase<br />
in boiler house cooling water by-passing the<br />
wastewater treatment plant.<br />
Table 43 - Water Usage<br />
The usage rate for water equates to<br />
approximately 8.6 m 3 per AD tonne of<br />
product in <strong>2008</strong> <strong>and</strong> 9.1 m 3 in <strong>2009</strong>. World<br />
Bank / IFC Guidelines for water consumption<br />
in uncoated printing <strong>and</strong> writing paper show<br />
5- 40 m 3 /tonne.<br />
Both mills had wastewater discharges<br />
below the threshold limit as provided by<br />
local st<strong>and</strong>ards. There were no instances<br />
where these limits were exceeded during<br />
the <strong>2008</strong> to <strong>2009</strong> monitoring period. Due to<br />
the diversity of products produced by Pindo<br />
Deli mills, no World Bank / IFC Guidelines<br />
for water discharge quality can be used for<br />
comparison.<br />
River Water Quality<br />
This is measured both upstream <strong>and</strong><br />
downstream at both Pindo Deli plants, <strong>and</strong><br />
was within local regulatory limits, except for<br />
instances of low levels of dissolved oxygen<br />
(DO) at Pindo Deli I mill in <strong>2009</strong>. Both Pindo<br />
Deli mills monitor COD <strong>and</strong> BOD levels to<br />
international st<strong>and</strong>ards, even though this is<br />
not compulsory under regional regulations.<br />
(m 3 ) <strong>2008</strong> <strong>2009</strong><br />
Uptake from river 15,172,412 17,869,787<br />
Discharge to river 12,742,284 13,839,340<br />
<strong>2008</strong> <strong>2009</strong> Local St<strong>and</strong>ard*<br />
Pindo Deli I Pindo Deli II Pindo Deli I Pindo Deli II<br />
Emissions to Atmosphere<br />
Both mills produce air emissions from their<br />
power plants. Pindo Deli (II) also has air<br />
emissions from its chlor-alkali plant <strong>and</strong> this<br />
is reported semi-annually through UKL / UPL.<br />
The emitted air quality from the mill is in<br />
compliance with the national st<strong>and</strong>ard.<br />
Stack air quality monitoring is carried out at<br />
a range of locations <strong>and</strong> positions at every<br />
monitoring session. The stack air quality<br />
reported complies with local regulatory<br />
st<strong>and</strong>ards.<br />
Due to the diversity of products produced<br />
by Pindo Deli mills, no World Bank / IFC<br />
Guidelines for emission quality can be used<br />
for comparison.<br />
Ambient Air Quality<br />
Ambient air quality monitoring within sites<br />
was conducted at both Pindo Deli I <strong>and</strong><br />
Pindo Deli II mills. Overall, the figures show<br />
that both mills comply with local regulatory<br />
st<strong>and</strong>ards for maintaining a satisfactory<br />
ambient air quality.<br />
Ozone Depleting Substances<br />
Emissions of ozone-depleting substances are<br />
not monitored at Pindo Deli, however the<br />
quantity of freon used in the mills decreased<br />
from 2.3 tonnes in <strong>2008</strong> to 1.2 tonnes in<br />
<strong>2009</strong>. Freon is used in the mills purely for<br />
re-charging existing air conditioning <strong>and</strong><br />
chiller units in buildings, <strong>and</strong> on production<br />
equipment.<br />
BOD 5<br />
39.15 7.77 64.23 6.10 100<br />
COD 116.73 18.85 148.97 15.79 200<br />
TSS 57.90 14.25 62.34 7.78 100<br />
pH 7.27 7.30 7.32 7.60 6 – 9<br />
Key Parameters (kg/ADT, except pH)<br />
<strong>2008</strong> <strong>2009</strong> WB / IFC St<strong>and</strong>ard<br />
Pindo Deli I Pindo Deli II Pindo Deli I Pindo Deli II<br />
BOD 5<br />
0.60 0.19 1.09 0.14 0.25<br />
COD 1.79 0.48 2.52 0.38 1.5<br />
TSS 0.90 0.10 1.07 0.09 0.4<br />
Table 45 - Stack Air Emissions*<br />
Parameter (mg/m 3 ) <strong>2008</strong> <strong>2009</strong> Local St<strong>and</strong>ard<br />
Pindo Deli I Pindo Deli II Pindo Deli I Pindo Deli II<br />
SO 2<br />
154.5 3.5 - 281 146.5 4 - 338 750<br />
NO 2<br />
132.5 20 - 135 155.5 35.5 - 312.5 #<br />
Particulate 23.4 6 - 16 15.1 7.3 - 22.4 150<br />
• Due to the diversity of products produced by Pindo Deli mills, no World Bank / IFC Guidelines for emission quality can be used for comparison<br />
pH 7.3 7.3 7.3 7.6 6 – 9<br />
* Local St<strong>and</strong>ard as per SK-Gub Jabar No. 6 March 13, 1999<br />
[EN 3, EN 4, EN 8, EN 9, EN 21] [EN 19, EN 20}<br />
48 <strong>APP</strong> 08/09 <strong>Sustainability</strong> <strong>Report</strong> <strong>APP</strong> 08/09 <strong>Sustainability</strong> <strong>Report</strong> 49