APP Sustainability Report 2008-2009 - Asia Pulp and Paper
APP Sustainability Report 2008-2009 - Asia Pulp and Paper
APP Sustainability Report 2008-2009 - Asia Pulp and Paper

Create successful ePaper yourself
Turn your PDF publications into a flip-book with our unique Google optimized e-Paper software.
Sustainable Products<br />
Sustainable Products<br />
<strong>Paper</strong> Production – Raw Materials<br />
Input<br />
Purchased <strong>Pulp</strong><br />
There was a 9.7 percent increase in the total<br />
amount of pulp used in the mill from <strong>2008</strong><br />
to <strong>2009</strong>. The largest increases were in the<br />
consumption of imported PEFC-certified<br />
NBKP <strong>and</strong> local non-controversial LBKP.<br />
The Ecolabel certification received during<br />
the reporting period enabled Tjiwi Kimia to<br />
deliver paper products made with PEFCcertified<br />
pulp <strong>and</strong> customer dem<strong>and</strong> for<br />
these products – <strong>and</strong> our need for PEFCcertified<br />
NBKP – rose accordingly in <strong>2009</strong>.<br />
The total breakdown of purchased pulp can<br />
be seen in the table below:<br />
Table 49 - Raw material inputs - Purchased pulp<br />
(ADT) <strong>2008</strong> <strong>2009</strong><br />
Recycled Materials<br />
All paper mills reincorporate subst<strong>and</strong>ard<br />
paper production or “broke” into their<br />
products, so that it is not lost from the<br />
system. Tjiwi Kimia mill is also able to<br />
produce a substitute for virgin pulp by deinking<br />
pre- <strong>and</strong> post-consumer wastepaper.<br />
About 4 percent of the mill’s total fibre usage<br />
was de-inked pulp in <strong>2008</strong> / <strong>2009</strong>, with the<br />
quantity expected to grow over time.<br />
Fillers<br />
Fillers are insoluble, inorganic minerals,<br />
added to our papers to confer opacity <strong>and</strong><br />
brightness, or coated onto the surface to<br />
produce a smooth <strong>and</strong> receptive surface for<br />
high-quality printing. Typically, fillers amount<br />
to some 30 percent of the composition of<br />
printing <strong>and</strong> copier papers <strong>and</strong> constitute<br />
more than 70 percent of the weight of any<br />
mineral surface coatings applied. Fillers<br />
are now predominantly calcium carbonate<br />
based, but some continue to use china clay.<br />
LBKP NBKP BCTMP LBKP NBKP BCTMP<br />
Local Certified (LEI) – – – 7,684 – –<br />
Local Non-controversial<br />
83,341 – – 246,306 – –<br />
(NCONT)<br />
Local Verified Legal Origin<br />
664,316 – – 461,650 – –<br />
(VLO)<br />
Import Certified (PEFC / FSC) 4,538 65,366 1,084 23,643 145,794 14,542<br />
Import Verified (NCONT / CW) – – 2,021 – – –<br />
Total 752,195 65,366 3,105 739,283 145,794 14,542<br />
Table 50 - Recycled material volumes<br />
(ADT) <strong>2008</strong> <strong>2009</strong><br />
De-inking pulp 32,366 25,578<br />
Waste <strong>Paper</strong> (Post / pre consumer) 942 638<br />
Mill Broke 44,589 40,875<br />
Total usage of fillers at Tjiwi Kimia mill was<br />
381,048 tonnes in <strong>2008</strong>, 370,279 tonnes in<br />
<strong>2009</strong>.<br />
Starch<br />
Starch is used both to improve internal<br />
strength of the paper sheet <strong>and</strong>, in modified<br />
from, to enhance its surface properties.<br />
Usage in <strong>2008</strong> was 61,764 tonnes <strong>and</strong>, in<br />
<strong>2009</strong>, 61,210 tonnes.<br />
Other Chemicals <strong>and</strong> Process Aids<br />
A range of chemicals are used, either as<br />
components of the paper or to improve<br />
the drainage, operational efficiency <strong>and</strong><br />
cleanliness of the paper machines. These<br />
materials include sizes (for ink hold-out),<br />
retention aids <strong>and</strong> biocides, <strong>and</strong> adhesives<br />
<strong>and</strong> inks in the converting units. Other<br />
chemicals are needed for raw water <strong>and</strong><br />
wastewater treatment processes, boiler<br />
water treament <strong>and</strong> a range of miscellaneous<br />
site uses. The total amount of chemicals<br />
used in paper production <strong>and</strong> site services<br />
at Tjiwi Kimia was 541,318 tonnes in <strong>2008</strong>,<br />
652,693 tonnes in <strong>2009</strong>.<br />
Energy Inputs<br />
All of Tjiwi Kimia’s fuel inputs are fossilbased.<br />
The predominant fuel used by the mill<br />
is Indonesian coal, sourced in Kalimantan.<br />
The mill’s energy inputs during <strong>2008</strong> <strong>and</strong><br />
<strong>2009</strong> were as shown in the table, below.<br />
Minor quantities – some 4,000 tonnes – of<br />
wastewater treatment plant sludge were<br />
incinerated in <strong>2009</strong>, <strong>and</strong> this may increase,<br />
over time.<br />
Graphic 6 - Fuel consumption (%)<br />
Diesel Oil<br />
Marine<br />
Fuel Oil<br />
Coal<br />
Sludge<br />
Natural<br />
Gas<br />
20.1 G Joule 20.8 G Joule<br />
1<br />
1<br />
1<br />
0.5<br />
96<br />
0<br />
2<br />
<strong>2008</strong> <strong>2009</strong><br />
96<br />
0.5<br />
2<br />
Table 51 - Wastewater Discharge Monitoring Results<br />
Key Parameters<br />
Electricity generated on-site, in the mill’s cogeneration<br />
units, was as follows:<br />
Graphic 7 - Electricity consumption (MWh)<br />
1,294,939 1,293,140<br />
<strong>2008</strong> <strong>2009</strong><br />
A direct comparison with World Bank / IFC<br />
Guidelines for electrical energy consumption<br />
in coated printing <strong>and</strong> writing paper mills<br />
(650 – 900 kWh/AD tonne) is difficult<br />
because of the large energy consumption<br />
associated with the site’s chlor-alkali<br />
plants, which share utilities but operate<br />
independently of the paper mill. However, a<br />
general indication is that Tjiwi Kimia’s overall<br />
power consumption (including chlor-alkali<br />
plant operations) was in the region of 980<br />
kWh/AD tonne for both <strong>2008</strong> <strong>and</strong> <strong>2009</strong>.<br />
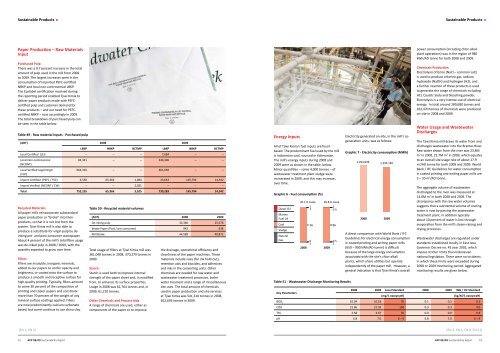
Chemicals Production<br />
Electrolysis of brine (NaCl – common salt)<br />
is used to produce chlorine gas, sodium<br />
hydroxide (NaOH) <strong>and</strong> hydrogen (H2), <strong>and</strong><br />
a further reaction of these products is used<br />
to generate the range of chemicals including<br />
HCl, Caustic Soda <strong>and</strong> bleaching powder.<br />
Electrolysis is a very intense use of electrical<br />
energy. In total around 280,680 tonnes <strong>and</strong><br />
262,470 tonnes of chemicals were produced<br />
on-site in <strong>2008</strong> <strong>and</strong> <strong>2009</strong>.<br />
Water Usage <strong>and</strong> Wastewater<br />
Discharges<br />
The Tjiwi Kimia mill draws its water from <strong>and</strong><br />
discharges wastewater into the Brantas River.<br />
Raw water drawn from the river was 23.8M<br />
m 3 in <strong>2008</strong>, 22.7M m 3 in <strong>2009</strong>, which equates<br />
to an overall site usage rate of about 17.9<br />
m 3 /AD tonne for both <strong>2008</strong> <strong>and</strong> <strong>2009</strong>. World<br />
Bank / IFC Guidelines for water consumption<br />
in coated printing <strong>and</strong> writing paper mills are<br />
5 – 20 m 3 /AD tonne.<br />
The aggregate volume of wastewater<br />
discharged to the river was measured at<br />
14.0M m 3 in both <strong>2008</strong> <strong>and</strong> <strong>2009</strong>. The<br />
discrepancy with the raw water volumes<br />
suggests that a substantial volume of cooling<br />
water is now by-passing the wastewater<br />
treatment plant, in addition typically<br />
about 10 percent of water is lost through<br />
evaporation from the mill’s steam-raising <strong>and</strong><br />
drying processes.<br />
Wastewater discharges are regulated under<br />
st<strong>and</strong>ards established locally, in East Java<br />
Governor Decree no. 45 year 2002, which<br />
impose stricter limits than Indonesian<br />
national legislation. There were no incidents<br />
in which these limits were exceeded during<br />
<strong>2008</strong> or <strong>2009</strong> monitoring period. Aggregated<br />
monitoring results are given below.<br />
<strong>2008</strong> <strong>2009</strong> Local St<strong>and</strong>ard <strong>2008</strong> <strong>2009</strong> WB / IFC St<strong>and</strong>ard<br />
(mg/l, except pH)<br />
(kg/ADT, except pH)<br />
BOD 5<br />
10.04 10.18 70 0.1 0.1 0.2<br />
COD 21.86 21.59 150 0.3 0.3 4.0<br />
TSS 2.58 3.67 70 0.0 0.0 0.3<br />
pH 6.8 7.0 6 – 9 6.8 7.0 6 – 9<br />
[EN 1, EN 2] [EN 3, EN 4, EN 8, EN 21]<br />
52 <strong>APP</strong> 08/09 <strong>Sustainability</strong> <strong>Report</strong> <strong>APP</strong> 08/09 <strong>Sustainability</strong> <strong>Report</strong> 53