2012 Financial Statements - Workers' Compensation Board
2012 Financial Statements - Workers' Compensation Board
2012 Financial Statements - Workers' Compensation Board

You also want an ePaper? Increase the reach of your titles
YUMPU automatically turns print PDFs into web optimized ePapers that Google loves.
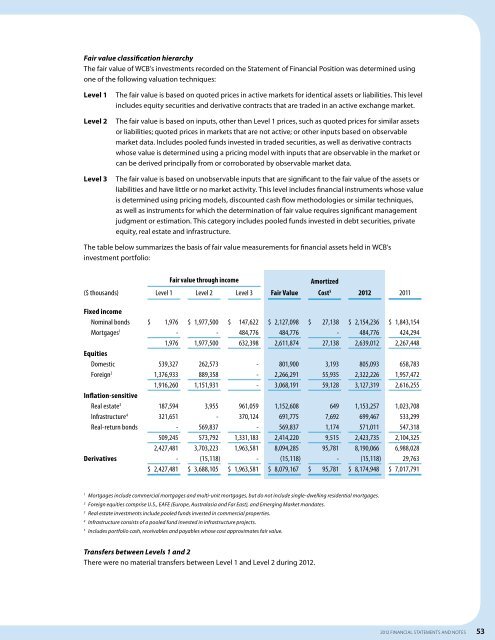
Fair value classification hierarchy<br />
The fair value of WCB’s investments recorded on the Statement of <strong>Financial</strong> Position was determined using<br />
one of the following valuation techniques:<br />
Level 1<br />
Level 2<br />
Level 3<br />
The fair value is based on quoted prices in active markets for identical assets or liabilities. This level<br />
includes equity securities and derivative contracts that are traded in an active exchange market.<br />
The fair value is based on inputs, other than Level 1 prices, such as quoted prices for similar assets<br />
or liabilities; quoted prices in markets that are not active; or other inputs based on observable<br />
market data. Includes pooled funds invested in traded securities, as well as derivative contracts<br />
whose value is determined using a pricing model with inputs that are observable in the market or<br />
can be derived principally from or corroborated by observable market data.<br />
The fair value is based on unobservable inputs that are significant to the fair value of the assets or<br />
liabilities and have little or no market activity. This level includes financial instruments whose value<br />
is determined using pricing models, discounted cash flow methodologies or similar techniques,<br />
as well as instruments for which the determination of fair value requires significant management<br />
judgment or estimation. This category includes pooled funds invested in debt securities, private<br />
equity, real estate and infrastructure.<br />
The table below summarizes the basis of fair value measurements for financial assets held in WCB’s<br />
investment portfolio:<br />
($ thousands)<br />
Fair value through income<br />
Level 1 Level 2 Level 3<br />
Fair Value<br />
Amortized<br />
Cost 5<br />
<strong>2012</strong><br />
2011<br />
Fixed income<br />
Nominal bonds<br />
Mortgages 1<br />
Equities<br />
Domestic<br />
Foreign 2<br />
Inflation-sensitive<br />
Real estate 3<br />
Infrastructure 4<br />
Real-return bonds<br />
Derivatives<br />
$ 1,976<br />
-<br />
1,976<br />
539,327<br />
1,376,933<br />
1,916,260<br />
187,594<br />
321,651<br />
-<br />
509,245<br />
2,427,481<br />
-<br />
$ 2,427,481<br />
$ 1,977,500<br />
-<br />
1,977,500<br />
262,573<br />
889,358<br />
1,151,931<br />
3,955<br />
-<br />
569,837<br />
573,792<br />
3,703,223<br />
(15,118)<br />
$ 3,688,105<br />
$ 147,622<br />
484,776<br />
632,398<br />
-<br />
-<br />
-<br />
961,059<br />
370,124<br />
-<br />
1,331,183<br />
1,963,581<br />
-<br />
$ 1,963,581<br />
$ 2,127,098<br />
484,776<br />
2,611,874<br />
801,900<br />
2,266,291<br />
3,068,191<br />
1,152,608<br />
691,775<br />
569,837<br />
2,414,220<br />
8,094,285<br />
(15,118)<br />
$ 8,079,167<br />
$ 27,138<br />
-<br />
27,138<br />
3,193<br />
55,935<br />
59,128<br />
649<br />
7,692<br />
1,174<br />
9,515<br />
95,781<br />
-<br />
$ 95,781<br />
$ 2,154,236<br />
484,776<br />
2,639,012<br />
805,093<br />
2,322,226<br />
3,127,319<br />
1,153,257<br />
699,467<br />
571,011<br />
2,423,735<br />
8,190,066<br />
(15,118)<br />
$ 8,174,948<br />
$ 1,843,154<br />
424,294<br />
2,267,448<br />
658,783<br />
1,957,472<br />
2,616,255<br />
1,023,708<br />
533,299<br />
547,318<br />
2,104,325<br />
6,988,028<br />
29,763<br />
$ 7,017,791<br />
1<br />
Mortgages include commercial mortgages and multi-unit mortgages, but do not include single-dwelling residential mortgages.<br />
2<br />
Foreign equities comprise U.S., EAFE (Europe, Australasia and Far East), and Emerging Market mandates.<br />
3<br />
Real estate investments include pooled funds invested in commercial properties.<br />
4<br />
Infrastructure consists of a pooled fund invested in infrastructure projects.<br />
5<br />
Includes portfolio cash, receivables and payables whose cost approximates fair value.<br />
Transfers between Levels 1 and 2<br />
There were no material transfers between Level 1 and Level 2 during <strong>2012</strong>.<br />
<strong>2012</strong> FINANCIAL STATEMENTS and notes 53