2012 Financial Statements - Workers' Compensation Board
2012 Financial Statements - Workers' Compensation Board
2012 Financial Statements - Workers' Compensation Board

Create successful ePaper yourself
Turn your PDF publications into a flip-book with our unique Google optimized e-Paper software.
Changes in current assumptions<br />
For the <strong>2012</strong> valuation, two of the key long-term economic assumptions were changed — the assumptions<br />
for the real rate of return and health care escalation. The annual real rate of return for the 2011 valuation<br />
was set at 2 per cent up to 2015 and 3 per cent thereafter, reflecting low bond market yields. The short-term<br />
period has been extended to include 2016 as market yields have remained essentially the same. Following<br />
an extensive study conducted in <strong>2012</strong>, the health care escalation assumption was reduced to 5 per cent per<br />
annum, the long-term general inflation rate plus 2.5 per cent. These assumption changes decreased the<br />
liability by $194.8 million.<br />
Various other actuarial assumptions were also changed based on extensive studies completed in <strong>2012</strong> and<br />
those changes decreased the liabilities by $110.5 million.<br />
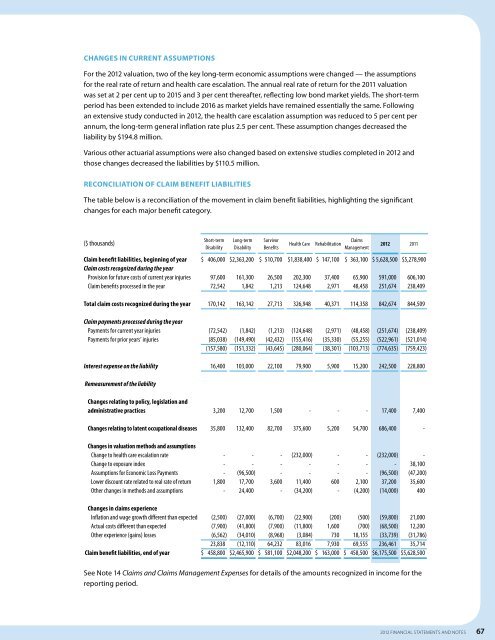
Reconciliation of claim benefit liabilities<br />
The table below is a reconciliation of the movement in claim benefit liabilities, highlighting the significant<br />
changes for each major benefit category.<br />
($ thousands)<br />
Short-term<br />
Disability<br />
Long-term<br />
Disability<br />
Survivor<br />
Benefits<br />
Health Care<br />
Rehabilitation<br />
Claims<br />
Management<br />
<strong>2012</strong> 2011<br />
Claim benefit liabilities, beginning of year<br />
Claim costs recognized during the year<br />
Provision for future costs of current year injuries<br />
Claim benefits processed in the year<br />
$ 406,000<br />
97,600<br />
72,542<br />
$ 2,363,200<br />
161,300<br />
1,842<br />
$ 510,700<br />
26,500<br />
1,213<br />
$ 1,838,400<br />
202,300<br />
124,648<br />
$ 147,100<br />
37,400<br />
2,971<br />
$ 363,100<br />
65,900<br />
48,458<br />
$ 5,628,500<br />
591,000<br />
251,674<br />
$ 5,278,900<br />
606,100<br />
238,409<br />
Total claim costs recognized during the year<br />
170,142<br />
163,142<br />
27,713<br />
326,948<br />
40,371<br />
114,358<br />
842,674<br />
844,509<br />
Claim payments processed during the year<br />
Payments for current year injuries<br />
Payments for prior years’ injuries<br />
(72,542)<br />
(85,038)<br />
(157,580)<br />
(1,842)<br />
(149,490)<br />
(151,332)<br />
(1,213)<br />
(42,432)<br />
(43,645)<br />
(124,648)<br />
(155,416)<br />
(280,064)<br />
(2,971)<br />
(35,330)<br />
(38,301)<br />
(48,458)<br />
(55,255)<br />
(103,713)<br />
(251,674)<br />
(522,961)<br />
(774,635)<br />
(238,409)<br />
(521,014)<br />
(759,423)<br />
Interest expense on the liability<br />
16,400<br />
103,000<br />
22,100<br />
79,900<br />
5,900<br />
15,200<br />
242,500<br />
228,800<br />
Remeasurement of the liability<br />
Changes relating to policy, legislation and<br />
administrative practices<br />
3,200<br />
12,700<br />
1,500<br />
-<br />
-<br />
-<br />
17,400<br />
7,400<br />
Changes relating to latent occupational diseases<br />
35,800<br />
132,400<br />
82,700<br />
375,600<br />
5,200<br />
54,700<br />
686,400<br />
-<br />
Changes in valuation methods and assumptions<br />
Change to health care escalation rate<br />
Change to exposure index<br />
Assumptions for Economic Loss Payments<br />
Lower discount rate related to real rate of return<br />
Other changes in methods and assumptions<br />
-<br />
-<br />
-<br />
1,800<br />
-<br />
-<br />
-<br />
(96,500)<br />
17,700<br />
24,400<br />
-<br />
-<br />
-<br />
3,600<br />
-<br />
(232,000)<br />
-<br />
-<br />
11,400<br />
(34,200)<br />
-<br />
-<br />
-<br />
600<br />
-<br />
-<br />
-<br />
-<br />
2,100<br />
(4,200)<br />
(232,000)<br />
-<br />
(96,500)<br />
37,200<br />
(14,000)<br />
-<br />
38,100<br />
(47,200)<br />
35,600<br />
400<br />
Changes in claims experience<br />
Inflation and wage growth different than expected<br />
Actual costs different than expected<br />
Other experience (gains) losses<br />
Claim benefit liabilities, end of year<br />
(2,500)<br />
(7,900)<br />
(6,562)<br />
23,838<br />
$ 458,800<br />
(27,000)<br />
(41,800)<br />
(34,010)<br />
(12,110)<br />
$ 2,465,900<br />
(6,700)<br />
(7,900)<br />
(8,968)<br />
64,232<br />
$ 581,100<br />
(22,900)<br />
(11,800)<br />
(3,084)<br />
83,016<br />
$ 2,048,200<br />
(200)<br />
1,600<br />
730<br />
7,930<br />
$ 163,000<br />
(500)<br />
(700)<br />
18,155<br />
69,555<br />
$ 458,500<br />
(59,800)<br />
(68,500)<br />
(33,739)<br />
236,461<br />
$ 6,175,500<br />
21,000<br />
12,200<br />
(31,786)<br />
35,714<br />
$ 5,628,500<br />
See Note 14 Claims and Claims Management Expenses for details of the amounts recognized in income for the<br />
reporting period.<br />
<strong>2012</strong> FINANCIAL STATEMENTS and notes 67