2012 Financial Statements - Workers' Compensation Board
2012 Financial Statements - Workers' Compensation Board
2012 Financial Statements - Workers' Compensation Board
You also want an ePaper? Increase the reach of your titles
YUMPU automatically turns print PDFs into web optimized ePapers that Google loves.
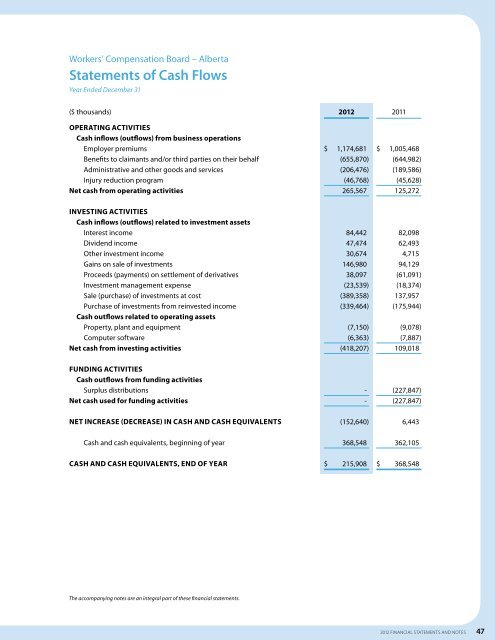
Workers’ <strong>Compensation</strong> <strong>Board</strong> – Alberta<br />
<strong>Statements</strong> of Cash Flows<br />
Year Ended December 31<br />
($ thousands) <strong>2012</strong> 2011<br />
OPERATING ACTIVITIES<br />
Cash inflows (outflows) from business operations<br />
Employer premiums<br />
Benefits to claimants and/or third parties on their behalf<br />
Administrative and other goods and services<br />
Injury reduction program<br />
Net cash from operating activities<br />
$ 1,174,681<br />
(655,870)<br />
(206,476)<br />
(46,768)<br />
265,567<br />
$ 1,005,468<br />
(644,982)<br />
(189,586)<br />
(45,628)<br />
125,272<br />
INVESTING ACTIVITIES<br />
Cash inflows (outflows) related to investment assets<br />
Interest income<br />
Dividend income<br />
Other investment income<br />
Gains on sale of investments<br />
Proceeds (payments) on settlement of derivatives<br />
Investment management expense<br />
Sale (purchase) of investments at cost<br />
Purchase of investments from reinvested income<br />
Cash outflows related to operating assets<br />
Property, plant and equipment<br />
Computer software<br />
Net cash from investing activities<br />
84,442<br />
47,474<br />
30,674<br />
146,980<br />
38,097<br />
(23,539)<br />
(389,358)<br />
(339,464)<br />
(7,150)<br />
(6,363)<br />
(418,207)<br />
82,098<br />
62,493<br />
4,715<br />
94,129<br />
(61,091)<br />
(18,374)<br />
137,957<br />
(175,944)<br />
(9,078)<br />
(7,887)<br />
109,018<br />
FUNDING ACTIVITIES<br />
Cash outflows from funding activities<br />
Surplus distributions<br />
Net cash used for funding activities<br />
-<br />
-<br />
(227,847)<br />
(227,847)<br />
NET INCREASE (Decrease) IN CASH AND CASH EQUIVALENTS<br />
(152,640)<br />
6,443<br />
Cash and cash equivalents, beginning of year<br />
368,548<br />
362,105<br />
CASH AND CASH EQUIVALENTS, END OF YEAR<br />
$ 215,908<br />
$ 368,548<br />
The accompanying notes are an integral part of these financial statements.<br />
<strong>2012</strong> FINANCIAL STATEMENTS and notes 47


