PARISH CHURCHES? how do we keep our - Ecclesiological Society
PARISH CHURCHES? how do we keep our - Ecclesiological Society
PARISH CHURCHES? how do we keep our - Ecclesiological Society

You also want an ePaper? Increase the reach of your titles
YUMPU automatically turns print PDFs into web optimized ePapers that Google loves.
HOW DO WE KEEP OUR <strong>PARISH</strong> <strong>CHURCHES</strong>? • CHURCH BUILDINGS AND THEIR CARERS 19<br />
Attendance '000s<br />
1800<br />
1600<br />
1400<br />
1200<br />
1000<br />
800<br />
600<br />
400<br />
200<br />
0<br />
1606<br />
1542<br />
1243<br />
1241<br />
968<br />
273<br />
1180<br />
921<br />
259<br />
1965 1970 1975 1980 1985 1990 1995 2000 2005<br />
1143<br />
917<br />
226<br />
938<br />
781<br />
157<br />
total adults children<br />
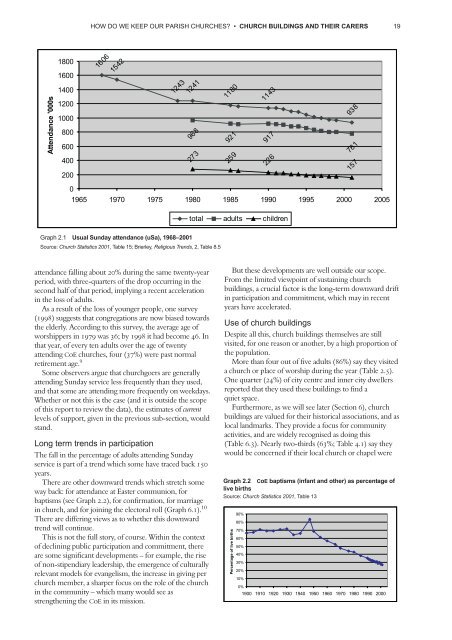
Graph 2.1 Usual Sunday attendance (uSa), 1968–2001<br />
S<strong>our</strong>ce: Church Statistics 2001, Table 15; Brierley, Religious Trends, 2, Table 8.5<br />
attendance falling about 20% during the same t<strong>we</strong>nty-year<br />
period, with three-quarters of the drop occurring in the<br />
second half of that period, implying a recent acceleration<br />
in the loss of adults.<br />
As a result of the loss of younger people, one survey<br />
(1998) suggests that congregations are now biased towards<br />
the elderly. According to this survey, the average age of<br />
worshippers in 1979 was 36; by 1998 it had become 46. In<br />
that year, of every ten adults over the age of t<strong>we</strong>nty<br />
attending CoE churches, f<strong>our</strong> (37%) <strong>we</strong>re past normal<br />
retirement age. 9<br />
Some observers argue that churchgoers are generally<br />
attending Sunday service less frequently than they used,<br />
and that some are attending more frequently on <strong>we</strong>ekdays.<br />
Whether or not this is the case (and it is outside the scope<br />
of this report to review the data), the estimates of current<br />
levels of support, given in the previous sub-section, would<br />
stand.<br />
Long term trends in participation<br />
The fall in the percentage of adults attending Sunday<br />
service is part of a trend which some have traced back 150<br />
years.<br />
There are other <strong>do</strong>wnward trends which stretch some<br />
way back: for attendance at Easter communion, for<br />
baptisms (see Graph 2.2), for con#rmation, for marriage<br />
in church, and for joining the electoral roll (Graph 6.1). 10<br />
There are differing views as to whether this <strong>do</strong>wnward<br />
trend will continue.<br />
This is not the full story, of c<strong>our</strong>se. Within the context<br />
of declining public participation and commitment, there<br />
are some signi#cant developments – for example, the rise<br />
of non-stipendiary leadership, the emergence of culturally<br />
relevant models for evangelism, the increase in giving per<br />
church member, a sharper focus on the role of the church<br />
in the community – which many would see as<br />
strengthening the CoE in its mission.<br />
But these developments are <strong>we</strong>ll outside <strong>our</strong> scope.<br />
From the limited viewpoint of sustaining church<br />
buildings, a crucial factor is the long-term <strong>do</strong>wnward drift<br />
in participation and commitment, which may in recent<br />
years have accelerated.<br />
Use of church buildings<br />
Despite all this, church buildings themselves are still<br />
visited, for one reason or another, by a high proportion of<br />
the population.<br />
More than f<strong>our</strong> out of #ve adults (86%) say they visited<br />
a church or place of worship during the year (Table 2.5).<br />
One quarter (24%) of city centre and inner city d<strong>we</strong>llers<br />
reported that they used these buildings to #nd a<br />
quiet space.<br />
Furthermore, as <strong>we</strong> will see later (Section 6), church<br />
buildings are valued for their historical associations, and as<br />
local landmarks. They provide a focus for community<br />
activities, and are widely recognised as <strong>do</strong>ing this<br />
(Table 6.3). Nearly two-thirds (63%; Table 4.1) say they<br />
would be concerned if their local church or chapel <strong>we</strong>re<br />
Graph 2.2 CoE baptisms (infant and other) as percentage of<br />
live births<br />
S<strong>our</strong>ce: Church Statistics 2001, Table 13<br />
Percentage of live births<br />
90%<br />
80%<br />
70%<br />
60%<br />
50%<br />
40%<br />
30%<br />
20%<br />
10%<br />
0%<br />
1900 1910 1920 1930 1940 1950 1960 1970 1980 1990 2000