PARISH CHURCHES? how do we keep our - Ecclesiological Society
PARISH CHURCHES? how do we keep our - Ecclesiological Society
PARISH CHURCHES? how do we keep our - Ecclesiological Society

You also want an ePaper? Increase the reach of your titles
YUMPU automatically turns print PDFs into web optimized ePapers that Google loves.
HOW DO WE KEEP OUR <strong>PARISH</strong> <strong>CHURCHES</strong>? • CHURCH BUILDINGS AND THEIR CARERS 25<br />
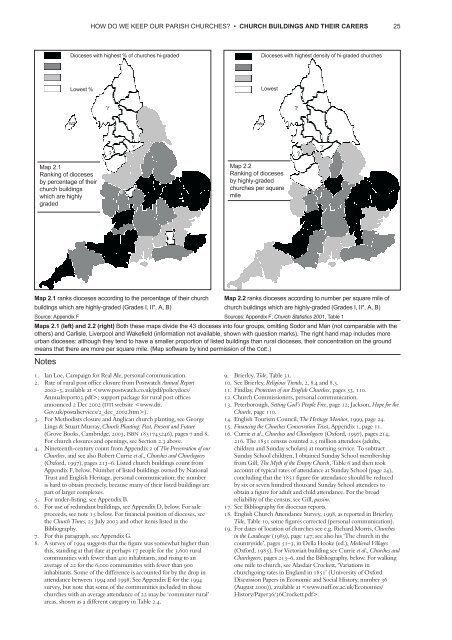
Dioceses with highest % of churches hi-graded<br />
Dioceses with highest density of hi-graded churches<br />
Lo<strong>we</strong>st %<br />
Lo<strong>we</strong>st<br />
Map 2.1<br />
Ranking of dioceses<br />
by percentage of their<br />
church buildings<br />
which are highly<br />
graded<br />
Map 2.2<br />
Ranking of dioceses<br />
by highly-graded<br />
churches per square<br />
mile<br />
Map 2.1 ranks dioceses according to the percentage of their church Map 2.2 ranks dioceses according to number per square mile of<br />
buildings which are highly-graded (Grades I, II*, A, B)<br />
church buildings which are highly-graded (Grades I, II*, A, B)<br />
S<strong>our</strong>ce: Appendix F<br />
S<strong>our</strong>ces: Appendix F; Church Statistics 2001, Table 1<br />
Maps 2.1 (left) and 2.2 (right) Both these maps divide the 43 dioceses into f<strong>our</strong> groups, omitting So<strong>do</strong>r and Man (not comparable with the<br />
others) and Carlisle, Liverpool and Wakefield (information not available, s<strong>how</strong>n with question marks). The right hand map includes more<br />
urban dioceses: although they tend to have a smaller proportion of listed buildings than rural dioceses, their concentration on the ground<br />
means that there are more per square mile. (Map software by kind permission of the CoE.)<br />
Notes<br />
1. Ian Loe, Campaign for Real Ale, personal communication.<br />
2. Rate of rural post of#ce closure from Postwatch Annual Report<br />
2002–3, available at ; support package for rural post of#ces<br />
announced 2 Dec 2002 (DTI <strong>we</strong>bsite ).<br />
3. For Methodists closure and Anglican church planting, see George<br />
Lings & Stuart Murray, Church Planting: Past, Present and Future<br />
(Grove Books, Cambridge, 2003, ISBN 1851745246), pages 7 and 8.<br />
For church closures and openings, see Section 2.3 above.<br />
4. Nineteenth-century count from Appendix 2 of The Preservation of <strong>our</strong><br />
Churches, and see also Robert Currie et al., Churches and Churchgoers<br />
(Oxford, 1997), pages 213–6. Listed church buildings count from<br />
Appendix F, below. Number of listed buildings owned by National<br />
Trust and English Heritage, personal communication; the number<br />
is hard to obtain precisely, because many of their listed buildings are<br />
part of larger complexes.<br />
5. For under-listing, see Appendix B.<br />
6. For use of redundant buildings, see Appendix D, below. For sale<br />
proceeds, see note 15 below. For #nancial position of dioceses, see<br />
the Church Times, 25 July 2003 and other items listed in the<br />
Bibliography.<br />
7. For this paragraph, see Appendix G.<br />
8. A survey of 1994 suggests that the #gure was somewhat higher than<br />
this, standing at that date at perhaps 17 people for the 3,600 rural<br />
communities with fe<strong>we</strong>r than 400 inhabitants, and rising to an<br />
average of 22 for the 6,000 communities with fe<strong>we</strong>r than 900<br />
inhabitants. Some of the difference is accounted for by the drop in<br />
attendance bet<strong>we</strong>en 1994 and 1998. See Appendix E for the 1994<br />
survey, but note that some of the communities included in those<br />
churches with an average attendance of 22 may be ‘commuter rural’<br />
areas, s<strong>how</strong>n as a different category in Table 2.4.<br />
9. Brierley, Tide, Table 31.<br />
10. See Brierley, Religious Trends, 2, 8.4 and 8.5.<br />
11. Findlay, Protection of <strong>our</strong> English Churches, pages 53, 110.<br />
12. Church Commissioners, personal communication.<br />
13. Peterborough, Setting God’s People Free, page 12; Jackson, Hope for the<br />
Church, page 110.<br />
14. English T<strong>our</strong>ism Council, The Heritage Monitor, 1999, page 24.<br />
15. Financing the Churches Conservation Trust, Appendix 1, page 11.<br />
16. Currie et al., Churches and Churchgoers (Oxford, 1997), pages 214,<br />
216. The 1851 census counted 2.5 million attendees (adults,<br />
children and Sunday scholars) at morning service. To subtract<br />
Sunday School children, I obtained Sunday School membership<br />
from Gill, The Myth of the Empty Church, Table 6 and then took<br />
account of typical rates of attendance at Sunday School (page 24),<br />
concluding that the 1851 #gure for attendance should be reduced<br />
by six or seven hundred thousand Sunday School attendees to<br />
obtain a #gure for adult and child attendance. For the broad<br />
reliability of the census, see Gill, passim.<br />
17. See Bibliography for diocesan reports.<br />
18. English Church Attendance Survey, 1998, as reported in Brierley,<br />
Tide, Table 10, some #gures corrected (personal communication).<br />
19. For dates of location of churches see e.g. Richard Morris, Churches<br />
in the Landscape (1989), page 147; see also his ‘The church in the<br />
countryside’, pages 51–3, in Della Hooke (ed.), Medieval Villages<br />
(Oxford, 1985). For Victorian building see Currie et al., Churches and<br />
Churchgoers, pages 213–6, and the Bibliography, below. For walking<br />
one mile to church, see Alasdair Crockett, ‘Variations in<br />
churchgoing rates in England in 1851’ (University of Oxford<br />
Discussion Papers in Economic and Social History, number 36<br />
(August 2000)), available at .