PARISH CHURCHES? how do we keep our - Ecclesiological Society
PARISH CHURCHES? how do we keep our - Ecclesiological Society
PARISH CHURCHES? how do we keep our - Ecclesiological Society

You also want an ePaper? Increase the reach of your titles
YUMPU automatically turns print PDFs into web optimized ePapers that Google loves.
<strong>how</strong> <strong>do</strong> <strong>we</strong> <strong>keep</strong> <strong>our</strong><br />
<strong>PARISH</strong> <strong>CHURCHES</strong>?<br />
Trevor Cooper
How <strong>do</strong> <strong>we</strong> <strong>keep</strong> <strong>our</strong><br />
<strong>PARISH</strong> <strong>CHURCHES</strong>?<br />
Trevor Cooper<br />
with speeches by<br />
the Rt Hon & Rt Revd Richard Chartres, Bishop of Lon<strong>do</strong>n<br />
and<br />
Dr Simon Thurley, Chief Executive, English Heritage<br />
The <strong>Ecclesiological</strong> <strong>Society</strong> • 2004<br />
John Piper: Why <strong>do</strong> you suppose that <strong>we</strong> all like churches so much?<br />
John Betjeman: Because they’re there whatever happens, aren’t they? *<br />
CONTENTS<br />
SUMMARY: How <strong>do</strong> <strong>we</strong> <strong>keep</strong> <strong>our</strong> parish churches? 3<br />
BUILDING BRIDGES 5<br />
The Bishop of Lon<strong>do</strong>n<br />
SPEECH 9<br />
The Chief Executive, English Heritage<br />
HOW DO WE KEEP OUR <strong>PARISH</strong> <strong>CHURCHES</strong>? 13<br />
Trevor Cooper<br />
*Quoted by Stephen Friar in the introduction to his Sutton Companion to Churches, 2nd edn (Stroud, 2003, ISBN 0750934743)
© The contributors. All rights reserved.<br />
First published 2004 by<br />
The <strong>Ecclesiological</strong> <strong>Society</strong><br />
c/o The <strong>Society</strong> of Antiquaries of Lon<strong>do</strong>n<br />
Burlington House<br />
Piccadilly<br />
Lon<strong>do</strong>n W1V 0HS<br />
www.ecclsoc.org<br />
email: churches@ecclsoc.org<br />
Printed in Great Britain by Pennine Printing Services Ltd, Ripponden, West Yorkshire.<br />
ISBN 0 946823 16 2<br />
The views expressed here are solely those of the individual authors, and should not be taken to represent those of the<br />
<strong>Ecclesiological</strong> <strong>Society</strong> or its of#cers. The <strong>Society</strong> disclaims responsibility for any injury to persons or property resulting<br />
from any material published in this publication.<br />
Photocopying You may photocopy or otherwise reproduce all or part of the report entitled ‘How <strong>do</strong> <strong>we</strong> <strong>keep</strong> <strong>our</strong><br />
churches?’ (pages 13–72) and its summary (pages 3–4), for purposes of study and discussion (but not for pro#t). The<br />
s<strong>our</strong>ce must be acknowledged, for example by retaining the header to each page.<br />
Further copies Copies may be <strong>do</strong>wnloaded free of charge from the <strong>Ecclesiological</strong> <strong>Society</strong> <strong>we</strong>bsite, address above.<br />
Printed copies may be purchased from the <strong>Society</strong>, PO Box 287, New Malden, KT34YT. If possible, please send payment<br />
with y<strong>our</strong> order; cheques should be made payable to the <strong>Ecclesiological</strong> <strong>Society</strong>. The prices, including postage within the<br />
UK, are: one copy £6.50; three copies £15.00; six copies £25.00. Thereafter, £3 per additional copy. For postage costs<br />
outside the UK, please contact the <strong>Society</strong> at the above address or by email.<br />
Thanks The <strong>Ecclesiological</strong> <strong>Society</strong> is grateful to the Rt Hon and Rt Revd Richard Chartres and Dr Simon Thurley for<br />
permission to publish their speeches, given in September 2003. Inclusion should not be taken to imply that either of<br />
them necessarily agree with the other contents of this publication.<br />
The <strong>Ecclesiological</strong> <strong>Society</strong> is the society for all those who love churches. It was founded in 1879, acting as a successor<br />
to the Cambridge Camden <strong>Society</strong> of 1839. The <strong>Society</strong> has a lively programme, including lectures, an annual<br />
conference, and visits to a range of locations in Great Britain. Members receive the <strong>Society</strong>’s periodical, Ecclesiology Today,<br />
three times a year. From time to time the <strong>Society</strong> publishes monographs, of which this volume is an example.<br />
Membership is open to all, and new members are always <strong>we</strong>lcome. For further details, see <strong>our</strong> <strong>we</strong>bsite, or write to us at<br />
PO Box 287, New Malden, KT34YT.<br />
Cover illustrations<br />
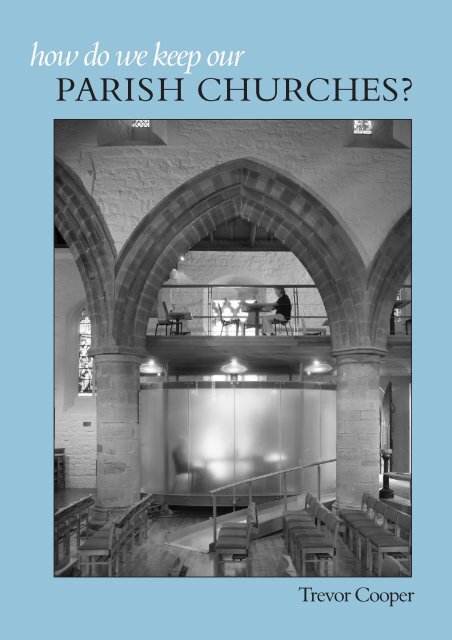
Front cover The front cover s<strong>how</strong>s All Saints, Hereford. This medieval building, listed Grade II*, is a <strong>do</strong>minant<br />
presence in the townscape, the church spire and the cathedral facing each other <strong>do</strong>wn Broad Street. The church preserves<br />
important furnishings, including a #ne set of stalls with misericords. The interior has undergone a dramatic and exciting<br />
conversion, introducing a restaurant at the <strong>we</strong>stern end and in a gallery, but the new elements not only respect the<br />
historic fabric and furnishings, but also maintain the sense of a building still dedicated for worship. The cover photograph<br />
looks south across the nave, with the restaurant gallery above. (RRA Architects (<strong>we</strong>bsite includes<br />
other photographs of the church); cover photograph by kind permission of Martine Hamilton Knight<br />
.)<br />
Rear cover The two illustrations on the #rst row of the rear cover are of the Church of the Good Shepherd,<br />
Carshalton Beeches, south Lon<strong>do</strong>n. This 1930 building, which is Grade II listed, was designed by Martin Travers and<br />
T. F. W. Grant in the style of a Spanish mission chapel. Betjeman had a strong affection for it, one of his poems referring<br />
to ‘the Travers baroque lime-washed in light’. This is a lively and energetic church, and to provide room for its wide<br />
range of activities it has added an extension whose style and detailing match the original work, as can be seen from the<br />
#rst photograph. Inside there is a lobby/lounge (second photograph), small garden c<strong>our</strong>tyard (glimpsed in the second<br />
photograph), kitchen, toilets, chapel, and a range of meeting rooms. (Architect: Carden & Godfrey; photographs by kind<br />
permission of the church.)<br />
On the second and third row are three church buildings described on page 42: Holy Trinity, Haddenham, new<br />
meeting room screened off in the north aisle (by kind permission of Dr Digi); St Aidan’s, Cleethorpes, computer<br />
training room on an upper storey (by kind permission of the Churches Regional Commission for Yorkshire and the<br />
Humber); two photos of St Paul’s, Walsall (now The Crossing), s<strong>how</strong>ing retail outlets on the ground $oor level and<br />
the ‘Upper Room’ worship area (by kind permission of the church).
3<br />
How <strong>do</strong> <strong>we</strong> <strong>keep</strong> <strong>our</strong> parish churches?<br />
Summary<br />
The following is a summary of ‘How <strong>do</strong> <strong>we</strong><br />
<strong>keep</strong> <strong>our</strong> parish churches?’, which will be<br />
found in full on page 13. The author, Trevor<br />
Cooper, is currently Chairman of the Council<br />
of the <strong>Ecclesiological</strong> <strong>Society</strong>, but his views<br />
should not be taken to represent those of the<br />
<strong>Society</strong> or its of#cers.<br />
THERE ARE ABOUT16,000 CHURCH OF ENGLAND<br />
churches – more churches than petrol stations.<br />
More than 12,000 are listed, with two-thirds of<br />
these being in the highest grades, Grade I or II*. This is by<br />
far the largest estate of listed buildings in the country.<br />
This huge portfolio of buildings is kept by the efforts<br />
of church congregations: in essence small, independent,<br />
groups of volunteers. Bet<strong>we</strong>en them they have been<br />
spending more than £80m a year on repairs, only about<br />
£30m of which has come from grants – the remainder is<br />
from their own pockets or their efforts at fund-raising.<br />
How <strong>we</strong>ll <strong>do</strong>es this work? And will it – can it – continue?<br />
A word of explanation. This article is about Church of<br />
England (CoE) churches, so the word ‘church’ will be<br />
used to refer to Anglican parish churches, parochial<br />
chapels, mission churches, etc. in England. Greater<br />
churches, such as abbeys and cathedrals, fall outside <strong>our</strong><br />
scope, as <strong>do</strong> churches of other denominations.<br />
Some CoE congregations are thriving. In 2001 some<br />
2,600 parishes (20%) had over one hundred adults<br />
attending Sunday services. On the other hand, roughly<br />
800 parishes (6%) had ten adults or fe<strong>we</strong>r worshipping on<br />
Sunday, representing an estimated 1,000 church buildings<br />
(there are #ve church buildings for every f<strong>our</strong> parishes).<br />
The CoE continues to plant new churches, and provide<br />
church buildings for growing centres of population, and<br />
in the last thirty years approximately 530 new churches<br />
have been built. Ho<strong>we</strong>ver, in common with almost all<br />
Christian denominations, Sunday attendance has been<br />
falling signi#cantly. During the same thirty-year period,<br />
all-age attendance at CoE churches has dropped by about<br />
40%, though the overall number of church buildings has<br />
been cut by much less than a tenth. The option taken by<br />
other networks, such as pubs and banks, of simply closing<br />
under-used buildings is not so easily available to the CoE.<br />
In one diocese, for which <strong>we</strong> happen to have #gures,<br />
only 37% of church seats are used on a Sunday. If this is<br />
typical, then across the board the CoE could remove f<strong>our</strong><br />
thousand church buildings from use, one quarter of its<br />
stock, and its average usage of seats on a typical Sunday<br />
would still only rise to about 50%. This is, of c<strong>our</strong>se, a<br />
grossly over-simpli#ed calculation, but it gives some<br />
measure of the extent to which the CoE has more<br />
buildings than it needs to house its regular Sunday<br />
worshippers.<br />
Many church buildings serve very thin populations.<br />
Almost two-thirds of those attending church (61%) <strong>do</strong> so<br />
in just one #fth (21%) of church buildings. Given that the<br />
location of approximately two-thirds of churches was<br />
decided before the Industrial Revolution, it is not<br />
surprising that many church buildings today are not close<br />
to centres of population. The 2000 smallest rural parishes<br />
have an average population of about 200 people each, so<br />
that 12% of church buildings are today in communities<br />
with less than 1% of the population.<br />
In urban areas, the population served by each church<br />
building can be much greater, but levels of churchgoing<br />
are lo<strong>we</strong>r, so that inner city and city centre churches have<br />
average levels of support only two or three times greater<br />
than rural areas, despite their much larger and more<br />
expensive buildings.<br />
Despite these dif#culties, CoE congregations spend<br />
about £80m per year on repairs, an average expenditure of<br />
about £5,000 per parish church per year. Is this enough?<br />
The evidence is <strong>we</strong>ak, but may indicate that there is<br />
currently a degree of underspend, though many churches<br />
overall are probably in reasonable or good condition.<br />
More research is needed on this important topic.<br />
Although the average spend on repairs each year is<br />
approximately £5,000 per church, in 2001 nearly f<strong>our</strong><br />
#fths of churches either spent nothing at all or spent less<br />
than £5,000. Only 2% of churches spent more than<br />
£50,000 in that year. It is this very small number of<br />
high-spending churches in any particular year who raise<br />
the average to £5,000 per church. Any one church may go<br />
for years on end without needing to spend much on<br />
repairs. This pattern of occasional, unpredictable, very<br />
expensive events must be dif#cult for small voluntary<br />
organizations (congregations) to handle: should they hire<br />
a youth worker, or put aside money for unknown future<br />
repairs which may never be needed?
4 TREVOR COOPER • HOW DO WE KEEP OUR <strong>PARISH</strong> <strong>CHURCHES</strong>? • 2004 • www.ecclsoc.org<br />
Of the £80m spent on repairs, more than half (60%),<br />
representing some £50m per year, is found by parishes<br />
themselves, rather than from grants. State funding is<br />
mainly available in the form of VAT refunds and repair<br />
grants. English Heritage/Heritage Lottery Fund <strong>do</strong>minate<br />
the #eld, granting £21m in the most recent full year. Their<br />
grants are oversubscribed by a factor of about two. Any<br />
withdrawal by these bodies would have a major impact.<br />
The CoE is not rich; indeed, many dioceses are in<br />
dif#cult #nancial circumstances. How <strong>do</strong> parishes #nd the<br />
money for their share of repairs? As expected, parish<br />
incomes differ enormously. About 1,500 parishes have<br />
unrestricted ordinary income of less than £5,000 per<br />
annum. For these parishes, and for many others, paying<br />
large repair bills from income is not possible.<br />
In order to organise large<br />
repairs, congregations need to<br />
be able to raise money<br />
directly, to organise<br />
themselves to apply for grants<br />
– not made easier by the<br />
variety of application methods<br />
– and to manage the repairs.<br />
One limiting factor is<br />
therefore organisational<br />
capacity, which is less likely to<br />
be found in smaller<br />
congregations.<br />
Looking ahead, the available information suggests a rate<br />
of closure (‘redundancy’) of at least 60 churches per year<br />
on average for the foreseeable future – at least equal to the<br />
previous highest rate, seen for a few years only in the<br />
1980s. Many of these new redundancies will be buildings<br />
of the highest quality. With its grant reduced by 5% in real<br />
terms, the Churches Conservation Trust, which was set<br />
up to preserve such buildings, will be unable to absorb<br />
them.<br />
More positively, there is evidence (mostly anec<strong>do</strong>tal)<br />
that congregations are increasingly receiving support of<br />
one type or another, as they continue to reach into their<br />
wider communities, though some of these activities are<br />
less practicable for smaller congregations.<br />
For example, many church buildings are used for<br />
purposes other than worship, to provide income or as a<br />
means of serving the community. A majority of the<br />
general public support this type of use. Indeed, more than<br />
eight million people say they have been to a concert or<br />
similar event in a church or other place of worship in the<br />
past year, about the same as attendance at West End<br />
theatres by UK residents. One half (49%) of rural church<br />
buildings (about 4,000) host such events (note that most<br />
rural churches <strong>do</strong> not have church halls). Congregations<br />
are adding facilities to church buildings, but it is a slow<br />
process: at the current rate, it will be the end of this<br />
century before all rural churches have toilets. Urban<br />
churches have better facilities.<br />
Church volunteers of all denominations make a very<br />
large contribution – probably worth bet<strong>we</strong>en £500m and<br />
£750m per year – to community activity, much of which<br />
bene#ts those who <strong>do</strong> not attend church services.<br />
Eight million people have been to a<br />
concert or similar event in a<br />
church or other place of worship in<br />
the past year, about the same as<br />
attendance at West End<br />
theatres by UK residents<br />
Buildings are an integral part of this activity, but it is not<br />
clear the extent to which historic church buildings bene#t<br />
from the available funding streams. Some churches,<br />
particularly in urban areas, are converting their premises<br />
in active support of local regeneration.<br />
Another s<strong>our</strong>ce of support is t<strong>our</strong>ism, driven by the<br />
growing interest in heritage. It seems likely that church<br />
buildings play both a direct and a supporting role in the<br />
t<strong>our</strong>ism industry, and this may have signi#cant economic<br />
value, though no-one has yet carried out the necessary<br />
analysis. Ho<strong>we</strong>ver churches are probably not capturing<br />
their fair share of the value they are generating.<br />
Friends groups can also lend support to church<br />
buildings. About 3% of churches have set up separate<br />
Friends groups, and the number is increasing. There is no<br />
full-time national of#cer for<br />
church t<strong>our</strong>ism or for<br />
Friends groups.<br />
The Government has not<br />
articulated an explicit policy<br />
towards church buildings,<br />
but it <strong>do</strong>es place value on<br />
the historic environment in<br />
general, especially when<br />
utilised for social and<br />
economic <strong>we</strong>ll-being. Public<br />
opinion values church<br />
buildings: in a recent poll, six out of ten people (63%) said<br />
that they would be concerned if their local church or<br />
chapel <strong>we</strong>re no longer there, and f<strong>our</strong> out of ten (42%)<br />
thought the government should support the buildings.<br />
Overall, there may be room for developing the<br />
partnership bet<strong>we</strong>en government in all its aspects and<br />
religious groups, including the CoE. For example, listed<br />
church buildings both contribute to t<strong>our</strong>ism and (along<br />
with unlisted ones) provide the base for community<br />
activity and the creation of ‘social capital’; these are<br />
important aspects of government policy. Unfortunately,<br />
<strong>how</strong>ever, it is the church buildings with the smallest<br />
congregations which are most at risk, and would also #nd<br />
it hardest to develop new partnerships.<br />
It is not the purpose of this paper to make<br />
recommendations, but it is suggested that focused<br />
research is needed to understand some speci#c issues<br />
better. Additionally several ways to help churches have<br />
emerged directly from the facts presented here. Most of<br />
these require funding, though in some cases the amounts<br />
are relatively small.<br />
Ho<strong>we</strong>ver, these suggestions alone are by no means<br />
suf#cient to resolve all the issues. Indeed, my personal<br />
view is that there is a real risk of large-scale church closure<br />
in the medium term, and <strong>we</strong> should begin now to explore<br />
new approaches to avoiding redundancy, and new ways of<br />
handling it when it occurs. If <strong>we</strong> wait, I fear <strong>we</strong> may be<br />
taken by surprise.<br />
Recently the CoE agreed a signi#cant policy statement,<br />
A Future for Church Buildings, which will lead to speci#c<br />
proposals for action. In the foreword of this policy<br />
statement the Bishop of Lon<strong>do</strong>n alludes to ‘a new way<br />
forward’. The time is surely ripe.
5<br />
Building bridges<br />
A speech by the Bishop of Lon<strong>do</strong>n<br />
The following speech was given by the Bishop<br />
of Lon<strong>do</strong>n, the Rt Hon and Rt Revd Richard<br />
Chartres, on 9 September 2003, at the annual<br />
conference of Diocesan Advisory Committees<br />
(DACs). The <strong>Ecclesiological</strong> <strong>Society</strong> is grateful<br />
for permission to publish this speech. Its<br />
inclusion should not be taken to indicate<br />
agreement by the Bishop with the other<br />
contents of this booklet.<br />
This critical tradition is an authentic third way bet<strong>we</strong>en<br />
the two fashionable positions which although super#cially<br />
opposed, both proceed from a disengagement from the<br />
conversation bet<strong>we</strong>en generations. This disengagement is<br />
obvious in the taste for modernisation unrelated to any of<br />
the co-ordinates which might tell us whether <strong>we</strong> are<br />
making progress or not. But disengagement from the<br />
living stream of human and spiritual experience is also at<br />
the root of trying to preserve some expression of the past<br />
as it was the day before yesterday, without the bene#t of<br />
the conversation bet<strong>we</strong>en generations which has been<br />
characteristic of previous cultures. This critical tradition<br />
which informs the work of DACs is light years away from<br />
any uncritical traditionalism which privileges the past over<br />
the present.<br />
In the most successful realm of modern culture, there is<br />
a strong sense of tradition. Science is not individualistic<br />
and to talk of the scienti#c community transcending<br />
political boundaries is not entirely sentimental.<br />
Tradition is a living stream which animates church<br />
buildings and gives them a different quality from the<br />
deserted shrines of dead religions.<br />
We are all involved at present in an effort to help <strong>our</strong><br />
partners and critics to understand the nature of <strong>our</strong> work<br />
and to appreciate the extraordinary achievements of<br />
thousands of volunteers, not least those who serve on the<br />
DACs of the country in cherishing, for the whole<br />
community, <strong>our</strong> ecclesiastical buildings. As a result they<br />
must be in a better state of repair today than they have<br />
been for a Millennium.<br />
I <strong>do</strong> not underestimate the sheer sacri#ce which many<br />
members of DACs make, to contribute to <strong>our</strong> common<br />
effort from their particular expertise. Our own DAC has<br />
200 active cases which certainly belies the common<br />
WE LIVE AT A TIME OF CONTRADICTION<br />
and opportunity. An uncritical deference to the<br />
idea of modernisation and scepticism about the<br />
value of past experience co-exists uneasily with a museum<br />
and heritage culture which sometimes seeks to<br />
freeze-frame what survives from previous generations.<br />
Both these attitudes pose a problem for those who<br />
serve on DACs and who are charged with the<br />
responsibility of caring for <strong>our</strong> buildings, respecting the<br />
memories which they store and working with local<br />
partners in ful#lling the #rst of#ce of a church which is to<br />
be, as the Measure states, ‘a local centre of worship and<br />
mission’. DACs are interpreters and bearers of tradition.<br />
perception of a moribund church. I know one DAC<br />
member who frankly says that he is only able to serve<br />
because of the tolerance of his business partners. I have<br />
seen the professionalism of DACs, all through the country,<br />
advance markedly throughout the last decade, inspiring a<br />
new professionalism in many parishes. Parishes now often<br />
prepare for the visits of DAC envoys with meticulous care.<br />
So realistic was the cardboard mock-up of some proposed<br />
new seating in one church that one DAC representative<br />
was induced to try it out unaware of is ersatz character and<br />
was cast to the ground amidst cries of alarm from the<br />
model makers.<br />
Conferences like this are opportunities to share<br />
discoveries and good practice, to marvel at fresh uses for<br />
the new technology like Southwark’s admirable use of the<br />
<strong>we</strong>b to s<strong>how</strong> off its stock of churches.<br />
It is clear, <strong>how</strong>ever, that <strong>we</strong> need to explain <strong>our</strong>selves<br />
more clearly and to seek for new allies in making <strong>our</strong><br />
contribution to the health of the community as a whole.<br />
We are rightly sad when an individual loses their memory<br />
because individual identity seems to be impaired with that<br />
loss. Any society that loses its memory faces disorientation<br />
and a real confusion about what it is to live <strong>we</strong>ll.<br />
Let me brief you about the contribution which the<br />
bodies I chair are making to a campaign which I hope you<br />
will actively support.<br />
I have the privilege of being involved in two groupings,<br />
the Church Heritage Forum and the Cathedrals and<br />
Churches Division. The latter brings together the staff<br />
and representatives of the Council for the Care of<br />
Churches and the Cathedrals Fabric Commission. The<br />
former involves in addition partners from the Redundant<br />
Churches Division of the Church Commissioners, the<br />
Advisory Board for Redundant Churches, the Churches
6 THE BISHOP OF LONDON • BUILDING BRIDGES<br />
Conservation Trust and also representatives of the<br />
Registrars, Ecclesiastical Judges, Diocesan Secretaries,<br />
Archdeacons with the Secretary of the Churches Main<br />
Committee which is an ecumenical body charged with<br />
monitoring government legislation and representing the<br />
common interests of the church on matters like tax and<br />
charity law. We all seem to get on very <strong>we</strong>ll.<br />
These bodies shaped a <strong>do</strong>cument entitled A Future for<br />
Church Buildings which was debated by the General Synod<br />
at one of the less contentious debates in July. The<br />
reference number is GS1514 and it is available from<br />
Church House Bookshop.<br />
The debate was very<br />
enc<strong>our</strong>aging and the vote to<br />
en<strong>do</strong>rse <strong>our</strong> report was 262 to<br />
2. This was a modest<br />
beginning to a campaign with<br />
the particular aim of helping<br />
everyone in positions of<br />
responsibility within the<br />
church to speak with one<br />
voice. Bishops in the past have sometimes been suspected<br />
(unjustly in most cases) of being fully paid up members of<br />
the Goth and Vandal tendency. There was a time when<br />
one campaigner suggested that more lethal than the<br />
Luftwaffe to the future of the churches of the City of<br />
Lon<strong>do</strong>n was the Bishop. It is vital that <strong>we</strong> both value the<br />
huge achievements of previous generations, celebrate the<br />
work of countless volunteers and in contemporary<br />
circumstances look to <strong>how</strong> <strong>we</strong> can make common cause<br />
with other stakeholders potential or actual in securing the<br />
future of such an important community asset, the<br />
supreme treasury of English vernacular art and memory.<br />
It is extremely enc<strong>our</strong>aging to see among the<br />
participants in the Conference, allies from English<br />
Heritage and the Amenity Societies. English Heritage and<br />
the Heritage Lottery Fund have bet<strong>we</strong>en them pledged<br />
£30 million for repair grants this year. This is the highest<br />
total ever and <strong>we</strong> are very grateful. Discussions on a fresh<br />
approach have already begun with a number of<br />
Government Departments with an interest in the matter.<br />
The spirit of those discussions has been constructive but I<br />
<strong>do</strong> not underestimate the cragginess of the mountain <strong>we</strong><br />
have to climb.<br />
There is hardly a parish in the entire country where this<br />
is not a pressing issue and not only among church<br />
attenders. The response to the long running VAT<br />
campaign and the concern expressed, more recently,<br />
following the proposal to introduce a new and onerous<br />
licensing regime for church buildings, s<strong>how</strong> that those<br />
who care actively for <strong>our</strong> church buildings enjoy support,<br />
not only from the 37 million people in the country who<br />
described themselves as Christians in the recent census,<br />
but also from those who, while not necessarily believers<br />
themselves, appreciate the contribution made by <strong>our</strong><br />
buildings to the artistic and cultural life of the country.<br />
We are responsible for an inheritance of Churches and<br />
Cathedrals, which are part of the living history of England<br />
and properly belong to the whole community.<br />
The Church of England is in<br />
financial terms the<br />
most disestablished church<br />
in Western Europe<br />
Among <strong>our</strong> 13,000 listed ecclesiastical buildings <strong>we</strong> care<br />
for about a half of all Grade I buildings in England.<br />
There are many individuals and bodies beyond the<br />
church, which have a proper interest in <strong>how</strong> <strong>we</strong> discharge<br />
<strong>our</strong> responsibilities. We operate in a highly regulated<br />
environment under close scrutiny and <strong>we</strong> are often<br />
regarded in some sense as a public utility. In reality of<br />
c<strong>our</strong>se <strong>we</strong> are #nanced as a charity largely from voluntary<br />
<strong>do</strong>nations.<br />
The Eckstein report 1999), which was produced to<br />
provide some statistical basis for the VAT campaign, did a<br />
survey of the average annual<br />
cost of repairs to church<br />
buildings at that time. This<br />
evidence corrected by more<br />
recent enquiries like the<br />
Archdeacon of Middlesex’s<br />
articles for 2002 suggest that<br />
the cost of repairing church<br />
buildings over the coming<br />
#ve years will not be less<br />
than three-quarters of a billion pounds. We have<br />
indications that grants from various public s<strong>our</strong>ces may be<br />
as much as two hundred and #fty million leaving us with<br />
a contribution of half a billion to #nd from private<br />
<strong>do</strong>nations, principally of c<strong>our</strong>se the faithful.<br />
We have to communicate the fact of the cost-effective<br />
way in which the Church of England cares for such a large<br />
part of the community’s cultural inheritance, the huge<br />
achievements of tens of thousands of volunteers and the<br />
generosity of worshippers. The results of this effort can be<br />
seen in the state of most of <strong>our</strong> cathedrals and churches,<br />
which can challenge comparison with the more lavishly<br />
funded regimes on the Continent of Europe.<br />
I have said it before and I shall continue to say it until<br />
every child in the land acknowledges it as an evident fact<br />
that the Church of England is in #nancial terms the most<br />
disestablished church in Western Europe.<br />
I had the privilege of joining German partners at the<br />
Berlin Kirchentag recently and was handed an analysis<br />
prepared by the Evangelical Church in Germany of <strong>how</strong><br />
that church is #nanced. In 2001 no less than 4 billion<br />
euros was derived from church tax while there <strong>we</strong>re<br />
further subsidies to re$ect the con#scation of church<br />
lands in the early nineteenth century and other s<strong>our</strong>ces of<br />
direct state aid. This is not of c<strong>our</strong>se the total yield from<br />
church tax; just that element which goes to the Evangelical<br />
Church. This level of support enables the church to <strong>do</strong> a<br />
great deal of useful work of c<strong>our</strong>se and to employ<br />
approaching 800,000 in a variety of social projects.<br />
In France, as is <strong>we</strong>ll known, despite the total divorce<br />
bet<strong>we</strong>en church and state, all ecclesiastical buildings<br />
before 1904, are maintained by Paris or municipal<br />
authorities.<br />
Are <strong>we</strong> jealous? Are <strong>we</strong> whinging? No, I hear you roar.<br />
We are proud of <strong>our</strong> voluntary character and <strong>we</strong> know that<br />
the effort of looking after <strong>our</strong> churches and cathedrals can<br />
often bring bene#ts in quickening church community life.
THE BISHOP OF LONDON • BUILDING BRIDGES 7<br />
But facts must be faced. The historic asset base of the<br />
Church of England administered by the Church<br />
Commissioners is restricted to a modest contribution to<br />
the joint church-state Churches Conservation Trust,<br />
which looks after churches no longer needed for regular<br />
worship.<br />
The #nancial revolution through which <strong>we</strong> are passing,<br />
in which increasing responsibilities are falling to dioceses<br />
and parishes, makes a re-assessment of the asymmetrical<br />
relationship bet<strong>we</strong>en church attenders and the wider<br />
community with respect to maintaining such a vital part of<br />
the nation’s inheritance of art and culture, urgent.<br />
No one would argue that Christian work, the<br />
propagation of the gospel or the care of the clergy should<br />
fall as a charge on the public purse. Although I was<br />
fascinated to note that the Italian State has just agreed to<br />
pay clergy pensions on the basis of the public service the<br />
clergy give to the wider<br />
community in that country. I<br />
<strong>do</strong> think, <strong>how</strong>ever, that a<br />
re-adjustment of<br />
responsibilities for<br />
maintaining the historic<br />
fabric of such a vital aspect of<br />
English popular culture is<br />
just and reasonable.<br />
Churches have a key part<br />
to play in various aspects of the present Government’s<br />
agenda. There is clearly an educational role and many<br />
places like Southwark Cathedral and Canterbury have<br />
recently completed new educational centres.<br />
There is a role in urban regeneration. St John’s Hoxton<br />
in Hackney, one of Britain’s poorest boroughs, has<br />
received a good deal of publicity as it brings together new<br />
facilities for the community including an employment<br />
project for the disabled and a facility for families under<br />
stress. This has been accommodated in a building<br />
refurbished with English Heritage advice and assistance. A<br />
somewhat genteel Edwardian Apocalypse painting on the<br />
ceiling has been restored. The activity itself together with<br />
superb leadership from priest and lay people alike has<br />
re-vivi#ed the worshipping community, which has been<br />
enabled to re-engage with its neighb<strong>our</strong>s.<br />
T<strong>our</strong>ism is one of the most signi#cant economic<br />
activities in the country and a huge employer. In a recent<br />
debate in the House of Lords, I was able to say some very<br />
obvious things about the contribution of places like York<br />
Minster to the regional economy. I was puzzled by the<br />
suggestion from other speakers that this was a novel<br />
perspective. There was no denying the goodwill <strong>how</strong>ever,<br />
and the minister replying to the debate drew attention to<br />
the meeting bet<strong>we</strong>en the of#cers of the Cathedrals and<br />
Churches division and representatives of a number of<br />
Government departments, which happened earlier in the<br />
summer.<br />
We are going to need Government understanding and<br />
support and never more so than in the next few months. I<br />
have already referred to the long running VAT campaign.<br />
We are especially grateful to the Chancellor for the<br />
scheme he announced in 2001 which has yielded now<br />
I <strong>do</strong> not believe that there are any<br />
quick fix, one size fits all global<br />
solutions which have any hope of<br />
being successful<br />
£11 million in repayments of VAT to parishes undertaking<br />
repairs on listed buildings. This was only ever meant to be<br />
an interim measure while the European Commission<br />
revie<strong>we</strong>d the sixth VAT Directive. The Commission’s<br />
proposals have now been published and the news is not<br />
good. They have rejected pleas for a reduced VAT regime<br />
on repairs and even worse, they have noted that the UK<br />
alone among member states has zero rated alterations to<br />
historic buildings. They argue that it would be logical to<br />
end this exception, making the standard rate the norm.<br />
Churches and other historic buildings under these<br />
proposals would face a 17.5% tax on alteration schemes,<br />
often vital to enhanced community use.<br />
The Government has already said that the interim VAT<br />
scheme will continue until the VAT rate review is<br />
completed. The decision will ultimately be taken by the<br />
Council of Ministers and it is up to us in conjunction with<br />
other allies to demonstrate<br />
what a depth of feeling there<br />
is about this subject<br />
countrywide.<br />
VAT reform is one part of<br />
the general funding picture<br />
and money as <strong>we</strong> all know<br />
from <strong>our</strong> experience with<br />
schools and other public<br />
institutions is very tight.<br />
Entering into new arrangements is going to require<br />
imagination and will be very dif#cult. Expectations will<br />
have to be managed. Our cause will be immeasurably<br />
strengthened if <strong>we</strong> speak with a common voice and if <strong>we</strong><br />
are prepared for adventurous solutions.<br />
I <strong>do</strong> not believe that there are any quick #x, one size #ts<br />
all global solutions which have any hope of being<br />
successful. We need to be clear sighted about the huge task<br />
of changing perceptions. We need to educate <strong>our</strong>selves so<br />
that <strong>we</strong> can present the case sympathetically to potential<br />
allies who are nearly always astonished when the facts are<br />
relayed to them. We need to be prepared for experiments.<br />
I think that the brief <strong>we</strong> are considering needs to be<br />
developed further in devising fresh vehicles which can<br />
help us in appropriate places to enter into partnerships<br />
with other potential stake holders. It could be that <strong>we</strong><br />
need to think seriously about building on the work <strong>do</strong>ne<br />
by some of the present church conservation bodies to<br />
create a National Trust for Churches which could enlist<br />
other partners and sponsors and give them real po<strong>we</strong>r<br />
with responsibility as an alternative to redundancy. The<br />
Churches Conservation Trust has <strong>do</strong>ne hugely important<br />
work since its inception but it is obvious with the freezing<br />
of its Government funding and the dif#culties in #nding<br />
more money from the Church Commissioners s<strong>our</strong>ces<br />
that the Trust’s capacity to absorb further churches in any<br />
numbers is severely limited.<br />
It is very enc<strong>our</strong>aging to see <strong>how</strong> many dioceses are<br />
engaging with this challenge in an imaginative way. The<br />
diocese of Manchester led a few years ago with a project<br />
undertaken in conjunction with English Heritage, looking<br />
at the historic and architectural signi#cance of each church<br />
building within a designated area and assessing them with
8 THE BISHOP OF LONDON • BUILDING BRIDGES<br />
reference to their role in the pastoral strategy of the<br />
church. Unsurprisingly there was not a complete #t<br />
bet<strong>we</strong>en heritage and pastoral considerations but<br />
understanding was deepened and the problems to be<br />
addressed <strong>we</strong>re crystallized. Chelmsford has recently<br />
completed a careful audit and Norwich is in the process of<br />
a similar exercise which has revealed both realism and<br />
enthusiasm for the task ahead.<br />
In parallel with these local initiatives the review of the<br />
Pastoral and Dioceses Measure is underway. One of the<br />
clearest messages from the consultations has been the<br />
preference for extended use<br />
rather than redundancy and<br />
the imperative of<br />
simplifying procedures<br />
which can lead to change.<br />
This was a message which<br />
was echoed in the July<br />
Synod loud and clear. We<br />
are operating in the context<br />
of a Government Review of<br />
the legislation affecting the<br />
historic environment<br />
generally. Churches are not speci#cally included at this<br />
stage although the Government has made it clear in line<br />
with the response to John Newman’s examination of the<br />
Ecclesiastical Exemption in 1997, that it <strong>do</strong>es propose to<br />
have another look at the separate church system. We need<br />
therefore to scrutinize particularly carefully the operation<br />
of <strong>our</strong> own controls.<br />
In July there was a debate initiated by the Archdeacon<br />
of Malmesbury’s motion proposing legislation to achieve a<br />
radical revision of the faculty system, to remove controls<br />
on any matters which would not require listed building<br />
consent had the churches concerned been secular<br />
buildings. There was considerable support for this motion<br />
which expressed a degree of frustration in the Synod over<br />
the operation of the present system. In the event the<br />
proposal was defeated but only by one vote.<br />
Y<strong>our</strong> Chairman, the Dean of Carlisle and now Bishop<br />
designate of So<strong>do</strong>r and Man, mitres off to him, put<br />
forward some alternative proposals which the Division<br />
The success of the campaign<br />
will depend on changing<br />
perceptions about the huge<br />
contribution already being made by<br />
thousands of volunteers to the<br />
cultural life of the nation<br />
will be pursuing, to respond positively to the demand for<br />
simpli#cation. In particular within the boundaries of<br />
existing legislation, there is work on the more consistent<br />
use of de minimis lists and negotiation with those with a<br />
statutory right to be consulted about the kind of cases that<br />
are really signi#cant to them.<br />
The detailed work is vitally important and it is good that<br />
<strong>we</strong> have of#cers at every level who combine knowledge<br />
with commitment to the spiritual task of the church. The<br />
success of the campaign, <strong>how</strong>ever, will depend on<br />
changing perceptions about the huge contribution already<br />
being made by thousands of<br />
volunteers to the cultural life<br />
of the nation and the<br />
imperative of sustaining their<br />
achievements in new #nancial<br />
and social circumstances. This<br />
will require boldness is<br />
devising new ways in which<br />
<strong>we</strong> can invite other<br />
stakeholders to take their<br />
share of responsibility for the<br />
ecclesiastical heritage on the<br />
basis in appropriate places of yielding exclusive control.<br />
With the closure of so many other public buildings and<br />
not least places of worship especially in the countryside,<br />
the parish church is very often left as, what it was in the<br />
beginning, the place where the community gathers. To<br />
realize this vision will need more ecumenical seriousness,<br />
an openness to other groups who share <strong>our</strong> passion for a<br />
cohesive and $<strong>our</strong>ishing local community life and new<br />
legal vehicles for sharing responsibility.<br />
I hope and pray that y<strong>our</strong> meeting together will be an<br />
opportunity to promote <strong>our</strong> common concern, to pool<br />
ideas for the campaign ahead and to emerge strengthened<br />
by the formidable sight which greets any speaker in this<br />
hall, a conclave of the learned and talented members of<br />
the nation’s DACs.
9<br />
Speech<br />
by Dr Simon Thurley, Chief Executive of English Heritage<br />
The following speech was given by Dr<br />
Thurley, Chief Executive of English Heritage,<br />
on 11 September 2003, at the annual<br />
conference of Diocesan Advisory Committees<br />
(DACs). The <strong>Ecclesiological</strong> <strong>Society</strong> is grateful<br />
for permission to publish this speech. Its<br />
inclusion should not be taken to indicate<br />
agreement by Dr Thurley with the other<br />
contents of this booklet.<br />
Mine heritage is unto me as a lion in the forest;<br />
it crieth against me, therefore have I hated it.<br />
J<br />
EREMIAH WAS NOT, OF COURSE, ACTUALLY<br />
talking about what <strong>we</strong> now know as <strong>our</strong> ‘heritage’,<br />
but I thought it sounded like the exasperated<br />
sentiment expressed by some church people today. Yet,<br />
as <strong>we</strong> all know only too <strong>we</strong>ll, this frustration is more than<br />
evenly balanced by a huge amount of sympathy and love<br />
for historic places of worship within and beyond<br />
congregations, that can become equally vociferous in<br />
defending the preservation of England’s parish churches.<br />
But why <strong>do</strong> people care about preservation so much?<br />
Is it an innate conservatism, a deep-seated respect for the<br />
past combined with a fear for the future? Is it theological<br />
respect for the beauty of holiness? Is it sentimentality? Do<br />
<strong>we</strong> actually agree on what the ‘heritage of places of<br />
worship’ really means? Or should <strong>we</strong> accept that it can<br />
mean different things to different people?<br />
I think it is vital that <strong>we</strong> make an effort to #nd out, or at<br />
least create the means to de#ne, such signi#cance, because<br />
that must be the starting point for managing the precious<br />
stock of historic churches that have come <strong>do</strong>wn to us. As<br />
nearly everyone here works within the Church of<br />
England, I shall drop the politically correct term ‘places of<br />
worship’ and say churches, but I am actually thinking of<br />
the entire range of ecclesiastical buildings, including those<br />
of the non-Christian faiths and modern, yet-to-be listed<br />
buildings. For although the urge to protect more recent<br />
buildings might be differently motivated to that used to<br />
defend the ubiquitous medieval rural parish church, the<br />
outcome is the same. It is what I have termed the virtuous<br />
circle. If people understand their building, they will value<br />
it; by valuing it, they will want to look after it; in caring for<br />
it, they will help others enjoy it. From enjoyment of the<br />
historic environment comes a greater thirst to understand<br />
it and the circle begins again.<br />
We already have a great army of carers – including of<br />
c<strong>our</strong>se all of you sitting here – as <strong>we</strong>ll as a great <strong>we</strong>alth of<br />
knowledge that ranges from experts on speci#c aspects of<br />
churches, right through to the kind soul who will sit in<br />
the church on a Sunday afternoon to give whoever enters<br />
a potted history of the building. But what about using the<br />
church and so ensuring its future?<br />
My starting point is a personal and a professional belief<br />
in the fundamental importance of England’s churches.<br />
These buildings are frequently at the geographical,<br />
spiritual, visual and historic centre of <strong>our</strong> towns and<br />
villages. With their graveyards, rectories, vicarages and<br />
parish halls they embody the social memory of<br />
communities. They are the only place where the lives of<br />
ordinary people are celebrated in gravestones, monuments<br />
and the registers of births marriages and deaths. They are<br />
buildings created by the communities in which they lie for<br />
the people who live there. They are also of c<strong>our</strong>se<br />
frequently the most beautiful buildings in their locality<br />
displaying craftsmanship in wood, stone and metalwork of<br />
a quality that few secular buildings can aspire too. Their<br />
artistic worth is almost as important as their social and<br />
historic value. But most of all they are living communities<br />
of like-minded people practising an ancient faith that is<br />
still a po<strong>we</strong>rful force in the modern world. They are<br />
buildings put up over the last thousand years still broadly<br />
used for the same purpose; there are few structures that<br />
can claim to have had such continuous use. I probably<br />
didn’t need to say all that as I guess that most of you will<br />
agree with my views...butIwanted to make it clear<br />
where I was coming from.<br />
I also hardly need to say that these precious buildings<br />
are under threat. Much of what the Archbishops’<br />
Commission on Redundant Churches, the Bridges report,<br />
said in 1960 sounds familiar today. I am not quite<br />
convinced of the Churches Conservation Trust’s view,<br />
expressed in its last annual report, that the next wave of<br />
redundancies will lead to ‘the loss of outstanding<br />
ecclesiastical buildings second only to that which occurred<br />
during the Reformation’. But I am certainly convinced by<br />
their wish to start to discuss it now. That debate should<br />
not be about what to <strong>do</strong> with churches that have become<br />
redundant, but more importantly what is needed to be<br />
<strong>do</strong>ne now to <strong>keep</strong> living parish churches alive and used, to<br />
prevent them becoming surplus to requirements.
10 DR SIMON THURLEY, CHIEF EXECUTIVE, ENGLISH HERITAGE • SPEECH<br />
This is an important debate for the Church of England<br />
and of c<strong>our</strong>se conservation bodies like us. We put huge<br />
res<strong>our</strong>ces into churches. Not only the £10m from <strong>our</strong><br />
grants budget and the infrastructure needed to distribute<br />
the £20m from the Heritage Lottery Fund, but the<br />
expertise of <strong>our</strong> inspectors, architects and engineers. It is a<br />
multi, multi million pound investment, and <strong>we</strong> at EH<br />
need to be clear where<br />
taxpayers money is going<br />
and what <strong>we</strong> are trying to<br />
achieve with it.<br />
I would guess that most<br />
parishes come into contact<br />
with English Heritage<br />
through faculty applications<br />
rather than grants and, if <strong>we</strong><br />
are lucky, through<br />
pre-application discussions.<br />
Too often <strong>we</strong> (and sometimes y<strong>our</strong>selves) are then<br />
accused of blocking the real work of the church, its<br />
pastoral care, worship and mission, by insisting on the<br />
retention of some furniture or wanting to preserve intact<br />
speci#c aspects or spaces of the listed building. English<br />
Heritage staff in turn are sometimes bewildered by the<br />
arguments congregations put forward about their<br />
perception of worship and mission. We have been told<br />
that lo<strong>we</strong>ring the to<strong>we</strong>r parapets, which would omit some<br />
fairly expensive stonework, was ‘pastorally necessary’ and<br />
that although they have managed not to dissolve in the<br />
rain to get to church, parishioners cannot walk a few feet<br />
in the open air to reach their coffee after the service in an<br />
adjacent, but unlinked, hall. We need to know more about<br />
each other’s motives for a<strong>do</strong>pting the arguments that <strong>we</strong><br />
make. The revised Faculty Rules requiring Statements of<br />
Need and Signi#cance are, <strong>we</strong> believe, a <strong>we</strong>lcome step in<br />
the right direction. They are taking time to bed in and I<br />
would like to hear y<strong>our</strong> views on their usefulness and<br />
effect on y<strong>our</strong> work. Our impression is that surprisingly,<br />
the Statement of Need is often <strong>we</strong>ak on facts but strong<br />
on contentions – “<strong>we</strong> think it is necessary, so it must be”,<br />
whereas the Statements of Signi#cance are good at listing<br />
facts – “this is 13th century, that is 1892” – but poor on<br />
synthesis and certainly poor on assessing just what is<br />
signi#cant, what really matters to the congregation about<br />
their church.<br />
To some extent <strong>we</strong> have <strong>our</strong>selves to blame. The actual<br />
grading of listed churches is pretty accurate, but the list<br />
description is hopeless at telling the owner why it is listed<br />
and at that grade. Yes, there are long established criteria,<br />
and their fairly consistent application makes the system<br />
reliable. But who has read those criteria and even more to<br />
the point, who has read a list description and understood<br />
from it the value and signi#cance of the church it<br />
describes in such dry detail?<br />
I recently visited a Church at Wigmore in<br />
Herefordshire. It is a Grade I church, handsomely sited<br />
and at the heart of a village with a ruined castle. A perfect<br />
English vision. But entering it there was virtually nothing<br />
inside, no monuments, pews, hardly a pulpit and no<br />
stained glass. The signi#cance of that building was its<br />
Alongside the re-evaluation of the<br />
intrinsic merits of a church, its<br />
context within the community it<br />
serves needs to be established ...<br />
landscape value and the authenticity of its external walls,<br />
not in its internal arrangements. As far as heritage is<br />
concerned, the interior could bear considerable alteration<br />
and re-ordering despite its designation as Grade I.<br />
The Heritage Protection Review currently being<br />
undertaken by the Department of Culture, Media and<br />
Sport (DCMS) with <strong>our</strong> assistance is looking to create a<br />
system of designation that<br />
gives more than a technical<br />
description and begins to focus<br />
on signi#cance. I want English<br />
Heritage to work out with the<br />
Church <strong>how</strong> <strong>we</strong> can create a<br />
planning tool of real use to us<br />
to work with in the future. But<br />
more importantly, <strong>we</strong> need to<br />
work out <strong>how</strong> <strong>we</strong> can actually<br />
help the daily worshipper and<br />
user of the church to understand just what it is about the<br />
building that they cherish and enjoy – what drives them to<br />
care for it. Only then can <strong>we</strong> hope that the changes that<br />
they aspire to will enhance what they value and not<br />
destroy it. We are looking to start some pilot schemes<br />
shortly, which will need to involve some of you at<br />
diocesan level, as <strong>we</strong>ll as in the parishes. If <strong>we</strong> can develop<br />
a new kind of description and designation, then<br />
Statements of Signi#cance should not just be easier to<br />
write, but they will actually become an essential part of the<br />
parish’s own thinking, to belong to them. We will need to<br />
hold training events to harness all that interest and<br />
knowledge as <strong>we</strong>ll, because although <strong>our</strong> staff at English<br />
Heritage might be the architectural or archaeological<br />
experts, there is a lot of localised interest and value that <strong>we</strong><br />
cannot know about and need to be told. Those early<br />
t<strong>we</strong>ntieth-century pews might not look too special to us in<br />
artistic terms, but because they <strong>we</strong>re made by a particular<br />
person or family locally, they have real signi#cance within<br />
the parish – and all hell would be let loose if someone<br />
suggests they get replaced.<br />
By describing statements of signi#cance as a ‘planning<br />
tool’, I mean that <strong>we</strong> want a <strong>do</strong>cument of value to you and<br />
all those charged with statutory duties of care and<br />
something that will be an aid to strategic planning within<br />
the area or even within the diocese. As I have already<br />
suggested there are many highly-graded churches that<br />
could have quite major changes made to them without<br />
affecting their essential signi#cance. On the other hand,<br />
<strong>we</strong> should remember that there are many Grade II<br />
churches with really valuable or complete interiors that<br />
are the reason for listing and so they should not be lightly<br />
<strong>do</strong>ne away with. Alongside the re-evaluation of the<br />
intrinsic merits of a church, its context within the<br />
community it serves needs to be established, whether its<br />
origins are lost in the mists of time or it is designed by the<br />
same architect who created the housing immediately<br />
around it. The wider value also needs stating and English<br />
Heritage is looking to research at least a few of the most<br />
contentious areas in the near future to better inform<br />
assessment and conservation planning.
DR SIMON THURLEY, CHIEF EXECUTIVE, ENGLISH HERITAGE • SPEECH 11<br />
Richard Giles wrote in 1999 in his in$uential book<br />
Re-pitching the Tent ‘the vast majority of <strong>our</strong> parish<br />
churches will require radical re-ordering to refurbish and<br />
re-equip them for service in the next century....<br />
re-ordering is a continuous process and not a one-off<br />
event’. Surely this must be true. Even looking at the<br />
post-Reformation history of parish worship <strong>our</strong> churches<br />
bear physical witness to Laudianism, Puritanism, the<br />
ecclesiological movement and evangelicalism, to name but<br />
a few. We cannot expect a congregation to have the same<br />
needs today as they did in the 1840s. Liturgy, like any<br />
other form of etiquette is always is a state of subtle change.<br />
Today’s ordering certainly<br />
wasn’t yesterday’s and is very<br />
unlikely to be tomorrow’s.<br />
Assuming <strong>we</strong> accept this<br />
assertion, what <strong>do</strong>es it mean<br />
for <strong>our</strong> most important<br />
churches? Well it means that<br />
<strong>we</strong> must act from an<br />
informed base. We must<br />
understand what <strong>we</strong> have<br />
and avoid s<strong>we</strong>eping it away<br />
in an attempt to<br />
accommodate the latest fad. There are big gaps in <strong>our</strong><br />
knowledge. Where are the most important interiors of the<br />
post-medieval period in particular? Just <strong>how</strong> many<br />
eighteenth-century box pews survive and where are the<br />
best furniture ensembles of the major nineteenth-century<br />
architects? To ans<strong>we</strong>r these sorts of questions <strong>we</strong> need<br />
research and I would like to know from you what you<br />
think <strong>our</strong> research priorities might be. We <strong>do</strong>n’t have<br />
endless res<strong>our</strong>ces – none of us has – but <strong>we</strong> want to use<br />
what <strong>we</strong> have in the way of money and staff to its greatest<br />
advantage.<br />
Flexibility like ‘reversibility’ has become something of a<br />
<strong>we</strong>asel word in conservation circles, implying that any<br />
change can be justi#ed. But it is the right word to describe<br />
an approach that is looking for creative solutions to<br />
managing change, which is what I want to see English<br />
Heritage <strong>do</strong>ing in its approach to the whole of the historic<br />
environment. We must continue to defend what should<br />
be defended with all the vig<strong>our</strong> and expertise <strong>we</strong> can<br />
muster and there are clearly some churches that can only<br />
tolerate very limited change. That should not mean that<br />
they are shunted into the Churches Conservation Trust as<br />
museums. We all must help them develop their own<br />
‘worship and mission’ to suit their circumstances. By<br />
re#ning the designation system and creating a wider range<br />
of management regimes in its wake, <strong>we</strong> might hope to<br />
avoid the con$ict that such cases often cause and promote<br />
the responsible use of historic churches. But this has to be<br />
<strong>do</strong>ne by us working together, on a strategic level, and not<br />
piecemeal as now.<br />
De#ning the signi#cant is also vitally important to the<br />
strategy that the Archbishops’ Council is embarking on in<br />
the next year or so. A Future for Church Buildings<br />
successfully demonstrates something that is perhaps<br />
obvious to all of us who are working with churches, that<br />
they are core buildings to their communities, for a<br />
There are so many examples<br />
already of <strong>how</strong> ‘saving’ a church<br />
on the brink of extinction can<br />
galvanise a community<br />
and re-vitalise its use<br />
wonderful variety of reasons. If they are not now, then<br />
they could be with a little vision and development. The<br />
care and conservation of churches has perhaps become too<br />
wrapped up in itself and needs to be integrated back into<br />
the mainstream of parish and diocesan life as a positive<br />
rather than a negative blocker of the ‘real’ work of the<br />
church. There are so many examples already of <strong>how</strong><br />
‘saving’ a church on the brink of extinction can galvanise a<br />
community and re-vitalise its use. What A Future for<br />
Church Buildings promotes is not just relevant to the care of<br />
historic churches, it is really about the re-establishment of<br />
church buildings into community life. That is where the<br />
churches started and that is<br />
<strong>how</strong> they must be perceived<br />
if they are to survive, and dare<br />
I say it, if the church in this<br />
country is to survive. And<br />
crucially church buildings are<br />
an important part of the<br />
mission of the church – the<br />
fact that they raise such<br />
heated debate amongst those<br />
wanting to be rid of them<br />
surely demonstrates that. It is<br />
going to be essential to change perceptions of the value of<br />
the church’s architectural heritage within parts of the<br />
church – though it will not be easy and will require a<br />
change in culture as <strong>we</strong>ll as widespread good examples.<br />
Secular authorities, especially those with money to<br />
spend on infrastructure like the Regional Development<br />
Agencies, need to be convinced that the projects they are<br />
being approached about really <strong>do</strong> bene#t everyone and are<br />
not simply helping a few. Remember that the Chancellor<br />
of the Exchequer, Gor<strong>do</strong>n Brown justi#ed the<br />
introduction of the scheme to refund VAT paid on church<br />
repairs with the argument that churches <strong>we</strong>re bene#ting<br />
their wider community and so should have greater help<br />
from the nation. It has to be said that the ecclesiastical<br />
exemption has, until quite recently, divorced churches<br />
from the community’s elected representatives in the local<br />
authorities. Politicians may be wary of interfering with<br />
religious matters, but the result of the exemption is that<br />
they and their staff in planning departments know far too<br />
little of the needs of parish churches. Churches might<br />
argue that their decisions are better than those made by<br />
local authorities, and made by people with a higher level<br />
of knowledge, but what chance <strong>do</strong> local authorities have to<br />
understand and participate in y<strong>our</strong> decisions, when they<br />
have been shut out of the process for so long? There are<br />
lots of good examples of co-operative working, and some<br />
of the case studies in the Synod paper demonstrate that.<br />
But the anti-local authority culture is still very prevalent<br />
within the churches, sometimes based on experience but<br />
too often based on perceptions that have gained their own<br />
momentum over the years. English Heritage also despairs<br />
of some decisions made by some local authorities, just as<br />
<strong>we</strong> despair of some decisions made by some DACs. But<br />
both systems have much to commend them, not least the<br />
enthusiasm of the devoted staff involved. English Heritage<br />
is in the position to act as an honest broker, to make you
12 DR SIMON THURLEY, CHIEF EXECUTIVE, ENGLISH HERITAGE • SPEECH<br />
more familiar with each other, and <strong>we</strong> are prepared to<br />
work with you on this and the Strategy.<br />
It remains to be seen what changes will be made to the<br />
ecclesiastical exemption following the DCMS review of<br />
designation. Whatever is <strong>do</strong>ne must promote closer<br />
working bet<strong>we</strong>en churches and planning authorities. This<br />
is particularly important for the Church of England as it<br />
promotes the role its buildings play in the community at<br />
large. Any external agency with regional, national or<br />
European government money to spend will want to be<br />
assured that the democratically elected local authority is<br />
behind a project and happy with its environmental impact.<br />
The designation review must also make sure that<br />
decisions are taken by <strong>we</strong>ll-trained and properly res<strong>our</strong>ced<br />
people that understand archaeological and conservation<br />
issues and the needs of a worshipping community.<br />
Currently that cannot be said of many, if any local<br />
authorities. Certainly, in my view, the time is not ripe to<br />
dismantle exemption entirely, the skills to work it simply<br />
<strong>do</strong>n’t exist.<br />
Putting churches back in the heart of their<br />
communities underpins the concept of extended use. This<br />
concept emerging in the review of the Pastoral Measure is<br />
very <strong>we</strong>lcome, but complicates the legal status of churches<br />
in use and will make y<strong>our</strong> work on DACs more<br />
complicated. If more churches are to have ‘extended uses’<br />
then dioceses will need to have good access to professional<br />
planning advice. That ought not to be on a voluntary or<br />
delegated basis, but come from dedicated employed staff.<br />
The Church has been reluctant to engage conservationtrained<br />
planning staff, for understandable #nancial reasons<br />
and because it feels it has enough expertise in its voluntary<br />
DAC membership and by training of the existing DAC<br />
secretaries. English Heritage still believes that there is a<br />
need for dedicated professional staff perhaps shared by<br />
dioceses, to help you, as the work load and the<br />
complexities of the statutory systems increase. I am sure<br />
this is another area where <strong>we</strong> should work together and I<br />
want to have that debate with you again.<br />
Ho<strong>we</strong>ver, <strong>we</strong> <strong>do</strong> have con#dence in the faculty system<br />
working and will shortly be writing to all of you, the<br />
Archdeacons and Diocesan Registrars, withdrawing the<br />
so-called ‘future approval’ grant condition completely.<br />
Our predecessors rightly insisted on that grant condition,<br />
that requires parishes in receipt of grant aid to seek <strong>our</strong><br />
approval of major alterations in addition to any faculty,<br />
because <strong>we</strong> <strong>we</strong>re not part of the faculty processes and<br />
substantial sums of public money <strong>we</strong>re involved. The<br />
latest revision of the Rules and the much better working<br />
relationships that have developed bet<strong>we</strong>en DACs and<br />
English Heritage regional of#ces enc<strong>our</strong>age us now to<br />
aban<strong>do</strong>n that separate approval process. We very much<br />
hope that it will remove a perceived barrier in parishes<br />
about applying for grants from us. There is of c<strong>our</strong>se legal<br />
protection for taxpayers’ money built into the contract <strong>we</strong><br />
use for the current church grant scheme, that places the<br />
onus on the parish to ensure that they <strong>do</strong> not <strong>do</strong> anything<br />
to their church that will infringe that contract.<br />
We believe that <strong>we</strong> can still protect that public<br />
investment through <strong>our</strong> participation in the faculty<br />
jurisdiction process, but that will require y<strong>our</strong> continued<br />
co-operation. Grant-aided parishes should still involve us<br />
at an early stage of their planning for alterations, they will<br />
still need to ans<strong>we</strong>r the questions that accompany their<br />
faculty petition and DACs will still need to advise the<br />
Chancellor in the DAC Certi#cate on whether the<br />
proposals affect the character of the church as a listed<br />
building. I think <strong>we</strong> should also be looking at <strong>how</strong> <strong>we</strong> can<br />
improve <strong>our</strong> working relations with you, in particular the<br />
role of the DAC member appointed by the Bishop after<br />
consultation with English Heritage. Let me have y<strong>our</strong><br />
views later please.<br />
Finally, English Heritage as the sector leader must <strong>do</strong><br />
more to educate and train both practitioners in the historic<br />
environment sector, and the wider public as owners and<br />
users of England’s ecclesiastical heritage. Many of you<br />
already produce guidance notes, and the Council for the<br />
Care of Churches has an admirable series of technical<br />
information (some written by English Heritage staff).<br />
Today I am launching the second edition of New Work in<br />
Historic Places of Worship, that sets out English Heritage’s<br />
principles and reasoning behind <strong>our</strong> actions and advice. It<br />
is deliberately short and <strong>we</strong> hope suf#ciently nontechnical<br />
to allow the average churchwarden or clergyman<br />
to understand <strong>our</strong> likely position on changes to historic<br />
churches. The emphasis as in the #rst edition ten years<br />
ago, is on understanding what you have and establishing<br />
what you really need, before getting <strong>do</strong>wn to the design.<br />
Perhaps more explicit than ten years ago is <strong>our</strong> recognition<br />
of the importance of <strong>keep</strong>ing church buildings in use, and<br />
of the inevitability of changes, possibly unpalatable to us,<br />
that continued use is likely to bring. It has taken a little<br />
while for this guidance to emerge and I would be<br />
interested to hear what you have to say about its<br />
usefulness and what can be <strong>do</strong>ne to spread its messages<br />
wider. It will become available on the English Heritage<br />
<strong>we</strong>bsite and be regularly updated.<br />
I am very conscious that there is a lot to be <strong>do</strong>ne in the<br />
next few years to ensure the future of England’s parish<br />
churches, but where to start? There is huge enthusiasm,<br />
interest and sympathy for the cause, but too few of us and<br />
too little res<strong>our</strong>ces to draw on at present. I am con#dent<br />
that more money and in time, more trained people will<br />
become available and I am equally con#dent that English<br />
Heritage has a big role to play in ensuring this happens.<br />
But <strong>we</strong> must work with you and y<strong>our</strong> equivalents in the<br />
other denominations and especially, <strong>we</strong> need to win round<br />
the people in the pews to understand what it is about their<br />
church buildings that they want to <strong>keep</strong> and to enhance.<br />
Seminars, training days, lea$ets and other educational<br />
material will no <strong>do</strong>ubt go some way to help and the<br />
changes in designation and control systems will start to<br />
change the culture of statutory controls. But, as <strong>we</strong><br />
formulate <strong>our</strong> own plans for the future, work out what<br />
part <strong>we</strong> are to play in the partnership that is needed to<br />
nurture <strong>our</strong> ecclesiastical heritage, <strong>we</strong> need to stop talking<br />
and start listening. And that is what I propose to <strong>do</strong> now.
13<br />
How <strong>do</strong> <strong>we</strong> <strong>keep</strong> <strong>our</strong> parish churches?<br />
Trevor Cooper<br />
Summary ....................................... 3<br />
1 Introduction. .....................................15<br />
2 Church buildings and their carers .........................16<br />
2.1 The network of churches 16<br />
2.2 How many people feel responsible for church buildings? 17<br />
2.3 How is the network developing? 20<br />
2.4 How evenly spread is the task? 23<br />
3 Keeping church buildings in good repair .....................26<br />
3.1 Spending on parish churches 26<br />
3.2 What is the pattern of repairs? 29<br />
3.3 Where <strong>do</strong>es the repair spend of £86m per year come from? 30<br />
3.4 How easy is it for congregations to #nd their share of repairs? 32<br />
4 Using church buildings ...............................37<br />
4.1 Not just for worship? 37<br />
4.2 Simple additional uses 38<br />
4.3 Major conversions and regeneration 40<br />
4.4 The #nancial impact 41<br />
5 Case studies: three dioceses .............................44<br />
5.1 A rural diocese: Lincoln 44<br />
5.2 A largely urban diocese: Manchester 45<br />
5.3 A mixed diocese: Chelmsford 47<br />
6 Keeping church buildings in future ........................49<br />
6.1 Expectations of the future 49<br />
6.2 Shaping the future 50<br />
6.3 The view of the Government and its agencies 56<br />
7 Andso...?.......................................58<br />
Appendices ......................................60<br />
A The cost of church repairs 60<br />
B Churches requiring regrading 62<br />
C EH/HLF grants 63<br />
D The number and destination of redundant churches 64<br />
E Statistics for rural churches 65<br />
F The number of listed churches 66<br />
G Measuring support for Church of England church buildings 68<br />
Abbreviations, glossary, bibliography .......................71
PEOPLE’S MINDS MAY DIFFER, AND SOME THINGS I RECOMMEND<br />
may be right in themselves without being wise or practicable, and<br />
some that are wrong perhaps cannot be got rid of without more<br />
harm than will come of letting them be as they are;...above all, it is easy<br />
for me to say “this is right”, and “that is wrong”, who have nothing to <strong>do</strong><br />
with it, and can come by no blame or discredit by my advice...[perhaps]<br />
what I may talk about very safely as ‘Nobody knows who’, I should be very<br />
sorry to <strong>do</strong> if I happened to be an Archdeacon.<br />
J. M. Neale in somewhat subdued vein in the opening pages of his much-reprinted A Few Words to<br />
Churchwardens..., 8th edition, (Cambridge 1846), pages 3–4 (repunctuated), republished in Christopher<br />
Webster (ed.), ‘temples...worthy of His presence’: the Early Publications of the Cambridge Camden <strong>Society</strong>, (Reading,<br />
2003, ISBN 0954361520).
15<br />
1. Introduction<br />
Purpose of this report<br />
Recently the Economist ran a short piece, ‘Tithing trouble’<br />
(8 Nov 2003), on the Church of England (CoE). It<br />
pointed out that, during the last ten years, Sunday<br />
attendance at CoE churches fell by about 17%, and the<br />
number of clergy dropped by a similar amount. Yet the<br />
number of church buildings fell by less than 2%. Thus<br />
fe<strong>we</strong>r people are supporting the same number of church<br />
buildings.<br />
A more anec<strong>do</strong>tal piece in the Financial Times, ‘Church<br />
changes but the churches stay’ (29 Nov 2003), explored<br />
what this meant in a rural setting. The author described<br />
<strong>how</strong> a number of magni#cent churches, their to<strong>we</strong>rs<br />
<strong>do</strong>minant in the West Country landscape, <strong>we</strong>re being<br />
cared for by small congregations. He took the view that<br />
this was not sustainable in the longer term: the<br />
government should step in.<br />
These articles are serious j<strong>our</strong>nalism, yet the picture<br />
they paint is impressionistic, based necessarily on limited<br />
evidence. I say ‘necessarily’, because there has not been, so<br />
far as I know, any recent attempt to collect together the<br />
key facts and #gures regarding the up<strong>keep</strong> of parish<br />
church buildings. That is the purpose of this paper.<br />
It is intended to be factual and objective, and not to<br />
promote a particular point of view, except for the<br />
underlying assumption that many church buildings are of<br />
intrinsic value. It is not my intention to make<br />
recommendations: rather to contribute to a debate.<br />
The views expressed are my own, and should not<br />
be taken as representative of those of of#cers or<br />
members of the <strong>Ecclesiological</strong> <strong>Society</strong>.<br />
Scope<br />
For practical reasons, the report is limited to Anglican<br />
churches in England. It rules out larger church buildings,<br />
such as abbeys and cathedrals. It also excludes places of<br />
worship of other denominations. I have used the word<br />
‘church’ to mean ‘Anglican parish church, parochial<br />
chapel, mission church, etc. in England’, except in a very<br />
few places where I have made clear that it has a different<br />
meaning.<br />
Urban and rural churches<br />
Urban churches differ from rural ones, for example in<br />
typical size of congregation, role in the community, age<br />
and size of the church building, and average grade of<br />
listing. For various reasons, I found more detailed<br />
evidence about rural churches than urban ones.<br />
Unfortunately, this may give the impression that the<br />
former deserve more attention, when this is not the case.<br />
Corrections, comments and further information<br />
I actively <strong>we</strong>lcome comments and corrections. These<br />
should be sent to me c/o the <strong>Ecclesiological</strong> <strong>Society</strong> either<br />
by email or by letter, using the addresses on the rear of the<br />
title page. I am particularly interested in any evidence<br />
which con$icts with that presented here, ans<strong>we</strong>rs any of<br />
the questions I have raised, or introduces new aspects.<br />
Individual anec<strong>do</strong>tes are of less interest, unless they raise<br />
general issues.<br />
Corrections and new material will be published<br />
on the <strong>Society</strong>’s <strong>we</strong>bsite, . The<br />
<strong>we</strong>bsite also links directly to s<strong>our</strong>ce material on the <strong>we</strong>b,<br />
and it has background statistical data and graphs which<br />
there was not room to publish here.<br />
Acknowledgements<br />
I could not have pulled this paper together without the<br />
help of a large number of people, who gave generously of<br />
their time and expertise. For the most part, they are not<br />
mentioned by name, to avoid any confusion bet<strong>we</strong>en the<br />
assistance they gave me privately and the public stance of<br />
their organisation. They know who they are: I hope they<br />
know <strong>how</strong> grateful I am. Needless to say, any errors which<br />
remain are my responsibility.<br />
I also acknowledge the kindness of those who allo<strong>we</strong>d<br />
their work or publications to be extensively quoted,<br />
including various anonymous contributors, the Church<br />
Times, and Leslie Francis, Jeremy Martineau and Acora<br />
publishing, authors and publishers respectively of Rural<br />
Mission. I apologise if there has been any unintentional<br />
breach of copyright; if noti#ed, I will put the matter right<br />
in any future edition.<br />
The larger picture<br />
In preparing this article, I have been humbled by the<br />
struggle of those who every day have to balance pastoral<br />
needs with those of stone and mortar. I hope my<br />
somewhat cold-blooded focus on buildings will not lead<br />
anyone to suppose that I am ignorant of, or unconcerned<br />
by, the larger picture.<br />
Anonymous comments in boxes All<br />
anonymous comments are from different<br />
people, except in the case of two<br />
individuals, one appearing under the<br />
pseu<strong>do</strong>nym of ‘A student of rural<br />
churches’, the other as ‘A frequent visitor<br />
to churches’, each of whose comments are<br />
split bet<strong>we</strong>en two different boxes.<br />
Approximations and costs Figures in<br />
tables are rounded, where this makes it<br />
easier to see the overall pattern, so there<br />
will be rounding errors in some totals.<br />
The Building Index has been used to<br />
bring historical costs up to 2002 money.<br />
S<strong>our</strong>ces Notes at the end of each section<br />
normally give short references only; fuller<br />
bibliographic detail will be found in the<br />
Bibliography. Where statistics are not<br />
referenced, they are from Church Statistics<br />
2001, details of which will be found in the<br />
Bibliography.
16<br />
2. Church buildings and their carers<br />
2.1 The network of churches<br />
A large network<br />
The Church of England (CoE) possesses about 16,000<br />
church buildings. This is one of the largest national<br />
networks in England (Table 2.1). These buildings are<br />
spread over about 13,000 parishes.<br />
There are more than 8,600 stipendiary parochial clergy.<br />
In recent years the number of other people licensed to take<br />
church services has risen to overtake this, and now stands<br />
at about 10,500.<br />
Many distribution networks of comparable size are<br />
shrinking to meet changing circumstances. For example, it<br />
is estimated that some 250 pubs close every year. 1 Rural<br />
post of#ces have also been shutting <strong>do</strong>wn, more than 600<br />
during a recent two year period (2000–2002); to help<br />
safeguard their future, the government has now<br />
introduced a support package worth £150m per year. 2<br />
National networks of churches are also facing pressures.<br />
For example, bet<strong>we</strong>en 1990 and 2000, some 1,000<br />
Methodist churches closed, with the decline greatest in<br />
city centres. As <strong>we</strong> discuss later, the CoE is also under<br />
strain, though it has shut only about 250 buildings over<br />
the last ten years (fe<strong>we</strong>r than 2% of its buildings). In the<br />
same period, it opened about 70 new buildings, and<br />
planted about 200 new congregations. 3<br />
Listed buildings<br />
Approximately 8,000 church buildings are medieval, and<br />
probably some 6,000 date from the nineteenth century.<br />
(Here, as throughout, I am referring to CoE buildings,<br />
unless stated otherwise.) More than 12,000 are listed<br />
(Table 2.2). This is far and away the largest estate of listed<br />
buildings in the country. The number of listed buildings<br />
maintained by English Heritage (EH) and the National<br />
Trust combined is probably fe<strong>we</strong>r than one thousand. 4<br />
More than 4,000 church buildings are Grade I listed,<br />
meaning that they are ‘of exceptional interest’ (see Table<br />
2.2). This is about 45% of the country’s stock of buildings<br />
at this grade. A similar number are Grade II* (‘particularly<br />
important buildings of more than special interest’) and<br />
something under 4,000 are Grade II (‘special interest,<br />
warranting every effort to preserve them’). (There are a<br />
small number of churches listed at Grades A, B, C,an<br />
older version of the listing system, which I have included<br />
with the more modern grades in the table.)<br />
The percentage of listed churches probably understates<br />
the importance of church buildings. They often have local<br />
signi#cance over and above their historical and aesthetic<br />
quality, and in addition they are probably under-listed. 5<br />
Who is responsible?<br />
It is easy to overlook two other remarkable facts. First, that<br />
church buildings are still in use for their original purpose.<br />
Secondly, this huge portfolio of listed buildings relies<br />
on the efforts of small, independent, groups of<br />
Table 2.1<br />
Number of outlets of networks in the UK (1999)<br />
Approximate<br />
number of outlets<br />
Type of network<br />
in 1999<br />
Pubs 41,800<br />
Cash machines 28,200<br />
Primary Schools 23,100<br />
Post offices 18,000<br />
Anglican churches 16,300<br />
Banks and building societies 14,400<br />
Petrol stations 13,700<br />
General practitioners’ surgeries 11,000<br />
Libraries 4,900<br />
Police stations 2,000<br />
Benefit agency and Job Centres 1,400<br />
Hospitals with A&E facilities 250<br />
S<strong>our</strong>ce: Counter Revolution (PIU Report, 2000) available from<br />
<br />
volunteers, in the form of church congregations, with<br />
formal responsibility lying with the Parochial Church<br />
Council (PCC).<br />
The up<strong>keep</strong> of these listed buildings is thus in the<br />
hands of some 12,000 independent voluntary groups. No<br />
attempt at a diocesan strategy for church buildings will be<br />
fully effective unless parishes accede to it.<br />
Deciding to close a church<br />
In considering the future of church buildings, there are<br />
two factors which sometimes affect the behavi<strong>our</strong> of<br />
parishes and dioceses. First, parishes <strong>do</strong> not pay the<br />
salaries of their stipendiary clergy directly. Instead, they are<br />
asked to make an assessed contribution to a central fund<br />
Table 2.2<br />
Estimated number of CoE church buildings of each grade<br />
of listing (2003)<br />
All figures rounded<br />
Grade<br />
Estimated number of church<br />
buildings at given grade<br />
number %<br />
% which<br />
these<br />
churches<br />
represent of<br />
all listed<br />
buildings<br />
(both secular<br />
and religious)<br />
I or A 4,200 26% 45% of 9,300<br />
II* or B 4,200 26% 20% of 21,400<br />
II or C 3,800 24%<br />
Not listed 4,000 24%<br />
Total 16,200 100% = 16,200<br />
S<strong>our</strong>ce: first two columns, Appendix F (pro-rated up to allow for missing<br />
dioceses as described there); final column, listed buildings database<br />
(March 2004)
HOW DO WE KEEP OUR <strong>PARISH</strong> <strong>CHURCHES</strong>? • CHURCH BUILDINGS AND THEIR CARERS 17<br />
VOLUNTARY LABOUR<br />
There are over 32,000 churchwardens with direct<br />
responsibility for the care of church buildings. If these<br />
churchwardens alone spend one h<strong>our</strong> per <strong>we</strong>ek (an<br />
underestimate) in caring for churches, this amounts to<br />
over 1.5 million h<strong>our</strong>s per year.<br />
The Diocesan Advisory Committees and the other<br />
faculty authorities draw on around 1,000 individuals to<br />
serve as members and advisors. Many are experts of<br />
national, some of international, standing. Based on the<br />
time spent in preparing for and attending meetings, site<br />
visits and for other professional advice given, the bene#t<br />
in kind from their time is conservatively estimated at<br />
£6m per annum (based on RIBA scale of June 1999 for a<br />
senior architect and simple project to indicate ‘typical’<br />
professional fees).<br />
The National Trust has 38,000 volunteers who<br />
contribute over 2 million h<strong>our</strong>s of their time each year.<br />
S<strong>our</strong>ces: First two paragraphs almost verbatim from A Future for Church<br />
Buildings; final paragraph, National Trust <strong>we</strong>bsite <br />
from which salaries are paid. If a parish is unable or<br />
unwilling to ful#l this obligation, the diocese is restricted<br />
in the enforcement action it can take, especially in those<br />
cases (previously the norm, now rather more than a half)<br />
where the minister has tenure (‘freehold’), and can stay<br />
until he or she wishes to leave. Thus parishes are not<br />
always forced to face #nancial reality. This situation is<br />
changing as more and more clergy are appointed under<br />
contract (‘priests-in-charge’), rather than vacancies being<br />
#lled with freehold appointments.<br />
Secondly, when a church becomes redundant, the<br />
diocese takes over responsibility for <strong>keep</strong>ing the building<br />
wind and watertight, thus adding to its cost base, while it<br />
works through a time-consuming statutory process to<br />
remove the building from its books.<br />
Diocese may ultimately receive some of the sale<br />
proceeds from disposal of the church (discussed later,<br />
Section 2.3), but the amounts are relatively small and may<br />
<strong>we</strong>ll have required the expenditure of signi#cant<br />
management time, together with money on repairs,<br />
insurance, marketing and legal expenses. Many dioceses<br />
are in dif#cult #nancial circumstances, and are short of<br />
management res<strong>our</strong>ces, and may therefore sometimes feel<br />
inclined to stand back and allow very <strong>we</strong>ak congregations<br />
to soldier on. 6<br />
The statutory requirements for redundancy are<br />
currently under review, and some changes may be made<br />
to the process, though I suspect they will not affect the<br />
points made above.<br />
As <strong>we</strong> shall see in the following section, congregations<br />
have been shrinking. As a result, although a good many<br />
churches are full of life, some church buildings now have<br />
a small and sometimes diminishing band of volunteers to<br />
maintain them<br />
REDUNDANCY CASE STUDY from ESSEX<br />
By no means all cases of redundancy are as tricky as this one,<br />
where the church is a local landmark by an important architect.<br />
But the case <strong>do</strong>es indicate the effort which is sometimes involved<br />
in seeing a church through the redundancy process.<br />
A church built in 1850 in a small village on the outskirts<br />
of one of <strong>our</strong> major towns ceased to be used for worship<br />
in 1988. A Pastoral Scheme declared redundancy in<br />
1990. The building was in a severe state of disrepair and<br />
repair costs <strong>we</strong>re around £250,000. A marketing<br />
campaign produced no interest from prospective<br />
purchasers, the local borough council considered it too<br />
isolated for community use, the Church<br />
Commissioners did not consider it of suf#cient merit<br />
for the Churches Conservation Trust, but English<br />
Heritage, Essex County Council and the local borough<br />
council jointly commissioned a feasibility study by a<br />
practice of architects. This examined a range of<br />
possibilities including residential conversion, workshops<br />
and community purposes. Costs ranged from £800,000<br />
to over £1m. There <strong>we</strong>re no applicants to take this<br />
further.<br />
Then a local Arts Trust came forward with proposals<br />
for conversion of the church into artists’ studios and<br />
exhibition/teaching facilities. While applications <strong>we</strong>re<br />
made to various funding authorities, maintenance was<br />
still required from the diocese. This application<br />
eventually came to nothing. Ho<strong>we</strong>ver, in the meantime<br />
the Diocesan Board of Finance had spent over £10,000<br />
on essential repairs, had spent 70 working h<strong>our</strong>s on the<br />
case, the Church Commissioners’ staff time was 54<br />
h<strong>our</strong>s and the annual insurance premium is over £1,000<br />
per year.<br />
It is still possible (2003) there may be a public<br />
enquiry, the cost of which will fall on the Diocesan<br />
Board of Finance. As <strong>we</strong> write, the Victorian <strong>Society</strong>, the<br />
Ancient Monuments <strong>Society</strong>, SAVE Britain’s Heritage,<br />
and the National Buildings Preservation Trust, are all<br />
urging further consideration to prevent demolition of<br />
this church – and all this #fteen years after the church<br />
building was closed for worship!<br />
S<strong>our</strong>ce: extracted from Chelmsford, Review, amended slightly<br />
Since the above was written there have been further<br />
developments. There is currently a proposal for<br />
residential conversion tied in with enabling<br />
development on adjoining land which it is hoped will at<br />
long last secure the future of the building.<br />
S<strong>our</strong>ce: Church Commissioners, personal communication<br />
2.2 How many people feel responsible for<br />
church buildings?<br />
Measuring commitment<br />
What is the level of routine commitment to the church<br />
building. How many people give time or money to support<br />
and maintain it on a regular basis?<br />
Not surprisingly, existing measures <strong>we</strong>re not designed<br />
for <strong>our</strong> purpose. In particular, all of them refer to parishes,
18 TREVOR COOPER • HOW DO WE KEEP OUR <strong>PARISH</strong> <strong>CHURCHES</strong>? • 2004 • www.ecclsoc.org<br />
not buildings. This matters, because a large number of<br />
parishes have two buildings or more. There are<br />
approximately #ve church buildings for every f<strong>our</strong><br />
parishes. A sensible guess might be that there are about<br />
8,000 or 9,000 parishes looking after just one church<br />
building, and 3,000 or 4,000 parishes looking after two or<br />
more.<br />
In a multi-church parish, effort must be divided over<br />
more than one building. The available #gures <strong>do</strong> not<br />
allow for this and <strong>we</strong> cannot correct for it, because <strong>we</strong> <strong>do</strong><br />
not know which parishes to apply the correction to.<br />
There are other issues with the measures, discussed in<br />
Appendix G.<br />
Scale of commitment<br />
In what follows, I concentrate on adults rather than<br />
children, as it is the former who provide the time and<br />
money needed to support church buildings.<br />
One indication of commitment to a church building is<br />
attendance at Sunday worship. In 2001, the average<br />
Sunday attendance over the whole country was 75 adults<br />
per parish, 60 per church building. Many churches had<br />
more than this: some 20% of parishes, some 2,600 in all,<br />
had average attendances on Sunday of more than 100<br />
adults (Table 2.3). Of these, 500 parishes had attendance<br />
of more than 200 adults (not s<strong>how</strong>n in the table).<br />
On the other hand, 6% of parishes (approaching 800)<br />
had average Sunday attendance of ten adults or fe<strong>we</strong>r. As<br />
discussed in Appendix G, it is possible that this<br />
understates the number of parishes with this level of<br />
average Sunday attendance.<br />
Attendance #gures for a typical Sunday are indicative,<br />
but <strong>do</strong> not tell the whole story, because many churchgoers<br />
<strong>do</strong> not attend on every Sunday. The number of people<br />
feeling responsibility for the church building will<br />
therefore normally be greater than the number present on<br />
a typical Sunday.<br />
We have two other useful measures of commitment<br />
(discussed in Appendix G). Making certain assumptions,<br />
these imply that there are a minimum of 500 church<br />
buildings (and probably more) with ten or fe<strong>we</strong>r<br />
committed adults. On the next rung of the ladder, there<br />
are probably about 1,600 churches which will obtain<br />
routine support from bet<strong>we</strong>en eleven and t<strong>we</strong>nty adults. 7<br />
Depending on the size and condition of their church<br />
buildings, it will typically be the smaller congregations<br />
which are less likely to be able to maintain their church<br />
building in good repair over the longer term, and to be<br />
most susceptible to redundancy.<br />
Many (but certainly not all) of the smaller<br />
congregations are rural. One 1998 survey suggests that the<br />
average size of Sunday congregation in the estimated<br />
5,700 churches in rural areas (which excludes commuter<br />
rural areas) is about 14 people of all ages, much smaller<br />
than elsewhere (Table 2.4). 8<br />
Recent trends in attendance<br />
How <strong>do</strong> the attendance #gures compare with those in the<br />
past? Although there is room for discussion about the<br />
detail of the statistics, and <strong>our</strong> information is limited, the<br />
Table 2.3<br />
Adult average Sunday attendance (ASA) in<br />
CoE parishes (2001)<br />
(12,951 parishes; total adult ASA 868,000)<br />
All figures rounded<br />
Adult<br />
ASA Parishes with this attendance<br />
% Number<br />
1– 5 1 130<br />
6–10 5 650<br />
11–20 19 2500<br />
21–30 14 1800<br />
31–50 17 2200<br />
51 – 100 24 3100<br />
over 100 20 2600<br />
Total 100% = 12,951 12,951<br />
S<strong>our</strong>ce: CoE, personal communication<br />
general pattern is clear: in common with almost all church<br />
denominations, Sunday attendance has been falling<br />
signi#cantly. In the case of CoE churches, in the last thirty<br />
years Sunday attendance has dropped by 40% overall<br />
(Graph 2.1).<br />
In the late 1960s, about 3.5% of the population,<br />
1.6 million people of all ages, worshipped in an Anglican<br />
church on a Sunday. By 2001, that proportion had<br />
dropped by 40%, to 1.9% (940,000 people). (See<br />
Graph 2.1, which s<strong>how</strong>s all the information available to<br />
me. Note that for reasons explained in Appendix G, this<br />
uses a slightly different measure of Sunday attendance<br />
from the one used in Table 2.3.)<br />
For the most recent t<strong>we</strong>nty years, <strong>we</strong> have data which<br />
distinguishes bet<strong>we</strong>en adults and those under sixteen years<br />
of age. About 40% of the under-sixteens disappeared from<br />
typical Sunday services in the t<strong>we</strong>nty years following 1980,<br />
and they appear not to have returned as they grew older.<br />
The decline amongst adults has been slo<strong>we</strong>r than this,<br />
Table 2.4<br />
Sunday attendance at CoE churches, all ages, by location<br />
(September 1998)<br />
Average<br />
Sunday<br />
Location of church<br />
Number of<br />
church<br />
buildings<br />
attendance<br />
per<br />
church<br />
Separate town 1100 140<br />
Suburban / urban fringe 2900 130<br />
Other built up area 500 100<br />
Inner city 1000 80<br />
Council estate 700 60<br />
Rural: commuter <strong>do</strong>rmitory 3400 50<br />
City centre 1000 40<br />
Rural: other areas 5700 *14<br />
Total = 16,281<br />
Overall<br />
average = 60<br />
*See discussion in text<br />
S<strong>our</strong>ce: English Church Attendance Survey, reported in Brierley,<br />
Religious Trends, 3, Tables 2.24.1, 2.24.2 (my calculation, all figures<br />
rounded)
HOW DO WE KEEP OUR <strong>PARISH</strong> <strong>CHURCHES</strong>? • CHURCH BUILDINGS AND THEIR CARERS 19<br />
Attendance '000s<br />
1800<br />
1600<br />
1400<br />
1200<br />
1000<br />
800<br />
600<br />
400<br />
200<br />
0<br />
1606<br />
1542<br />
1243<br />
1241<br />
968<br />
273<br />
1180<br />
921<br />
259<br />
1965 1970 1975 1980 1985 1990 1995 2000 2005<br />
1143<br />
917<br />
226<br />
938<br />
781<br />
157<br />
total adults children<br />
Graph 2.1 Usual Sunday attendance (uSa), 1968–2001<br />
S<strong>our</strong>ce: Church Statistics 2001, Table 15; Brierley, Religious Trends, 2, Table 8.5<br />
attendance falling about 20% during the same t<strong>we</strong>nty-year<br />
period, with three-quarters of the drop occurring in the<br />
second half of that period, implying a recent acceleration<br />
in the loss of adults.<br />
As a result of the loss of younger people, one survey<br />
(1998) suggests that congregations are now biased towards<br />
the elderly. According to this survey, the average age of<br />
worshippers in 1979 was 36; by 1998 it had become 46. In<br />
that year, of every ten adults over the age of t<strong>we</strong>nty<br />
attending CoE churches, f<strong>our</strong> (37%) <strong>we</strong>re past normal<br />
retirement age. 9<br />
Some observers argue that churchgoers are generally<br />
attending Sunday service less frequently than they used,<br />
and that some are attending more frequently on <strong>we</strong>ekdays.<br />
Whether or not this is the case (and it is outside the scope<br />
of this report to review the data), the estimates of current<br />
levels of support, given in the previous sub-section, would<br />
stand.<br />
Long term trends in participation<br />
The fall in the percentage of adults attending Sunday<br />
service is part of a trend which some have traced back 150<br />
years.<br />
There are other <strong>do</strong>wnward trends which stretch some<br />
way back: for attendance at Easter communion, for<br />
baptisms (see Graph 2.2), for con#rmation, for marriage<br />
in church, and for joining the electoral roll (Graph 6.1). 10<br />
There are differing views as to whether this <strong>do</strong>wnward<br />
trend will continue.<br />
This is not the full story, of c<strong>our</strong>se. Within the context<br />
of declining public participation and commitment, there<br />
are some signi#cant developments – for example, the rise<br />
of non-stipendiary leadership, the emergence of culturally<br />
relevant models for evangelism, the increase in giving per<br />
church member, a sharper focus on the role of the church<br />
in the community – which many would see as<br />
strengthening the CoE in its mission.<br />
But these developments are <strong>we</strong>ll outside <strong>our</strong> scope.<br />
From the limited viewpoint of sustaining church<br />
buildings, a crucial factor is the long-term <strong>do</strong>wnward drift<br />
in participation and commitment, which may in recent<br />
years have accelerated.<br />
Use of church buildings<br />
Despite all this, church buildings themselves are still<br />
visited, for one reason or another, by a high proportion of<br />
the population.<br />
More than f<strong>our</strong> out of #ve adults (86%) say they visited<br />
a church or place of worship during the year (Table 2.5).<br />
One quarter (24%) of city centre and inner city d<strong>we</strong>llers<br />
reported that they used these buildings to #nd a<br />
quiet space.<br />
Furthermore, as <strong>we</strong> will see later (Section 6), church<br />
buildings are valued for their historical associations, and as<br />
local landmarks. They provide a focus for community<br />
activities, and are widely recognised as <strong>do</strong>ing this<br />
(Table 6.3). Nearly two-thirds (63%; Table 4.1) say they<br />
would be concerned if their local church or chapel <strong>we</strong>re<br />
Graph 2.2 CoE baptisms (infant and other) as percentage of<br />
live births<br />
S<strong>our</strong>ce: Church Statistics 2001, Table 13<br />
Percentage of live births<br />
90%<br />
80%<br />
70%<br />
60%<br />
50%<br />
40%<br />
30%<br />
20%<br />
10%<br />
0%<br />
1900 1910 1920 1930 1940 1950 1960 1970 1980 1990 2000
20 TREVOR COOPER • HOW DO WE KEEP OUR <strong>PARISH</strong> <strong>CHURCHES</strong>? • 2004 • www.ecclsoc.org<br />
VIEWPOINT<br />
If the disengagement from institutional religion<br />
continues apace, a signi#cant new wave of outstanding<br />
churches may be left high and dry as the tide of faith<br />
ebbs away from their foundations....[unless a new<br />
contract is forged bet<strong>we</strong>en taxpayers and the Church]<br />
<strong>we</strong> may #nd <strong>our</strong>selves totally unprepared for what<br />
might prove to be the loss of outstanding ecclesiastical<br />
buildings second only to that which occurred during the<br />
Reformation. That is <strong>how</strong> fast events may turn in the<br />
next decade....Thinking what has never been thought<br />
before must soon commence if a whole slice of <strong>our</strong><br />
history is not to disappear for future generations.<br />
S<strong>our</strong>ce: Frank Field, Chairman of the CCT, in their Annual Report, 2002<br />
no longer to be there. F<strong>our</strong> out of ten (42%) would see a<br />
role for central government funding.<br />
Can this diffuse support be converted into something<br />
more tangible? – this question nags away in the<br />
background for much of the rest of this paper.<br />
2.3 How is the network developing?<br />
Opening and closing churches<br />
Since 1970, the CoE has built approximately 530 new<br />
church buildings (see Graph 2.3), and in the same period<br />
has closed about 1630, approximately one tenth of its<br />
stock of churches. Naturally, this paper concentrates on<br />
the risk of closures, but it must be remembered that this is<br />
part of the story only, as the CoE continues to plant new<br />
congregations, and provide church buildings for growing<br />
centres of population.<br />
Table 2.5<br />
Adults visiting church / place of worship during<br />
previous year<br />
(adults, Great Britain, October 2003)<br />
Purpose<br />
Who?<br />
Visited, any reason all 86%<br />
.. Christians 89%<br />
.. other faiths 75%<br />
.. no religion 80%<br />
Funeral all 59%<br />
Wedding all 49%<br />
Christmas period all 39%<br />
Find a quiet space all 19%<br />
.. city d<strong>we</strong>llers* 24%<br />
.. non-churchgoers 9%<br />
Concert or theatrical<br />
performance<br />
Walking past and felt<br />
the need to go in<br />
all 17%<br />
all<br />
city d<strong>we</strong>llers*<br />
28%<br />
*city centre / inner city d<strong>we</strong>llers<br />
S<strong>our</strong>ce: CoE, from ORB survey carried out on behalf of EH and CoE,<br />
October 2003. Sample size: 1004. See Bibliography.<br />
13%<br />
Churches <strong>we</strong>re being closed through much of the<br />
t<strong>we</strong>ntieth century, though the rate un<strong>do</strong>ubtedly increased<br />
in the latter years. Although in 1949 the CoE identi#ed<br />
more than 300 churches which <strong>we</strong>re by then surplus to<br />
requirements, bet<strong>we</strong>en 1945 and 1957 only about 125<br />
churches <strong>we</strong>re demolished, of which almost all <strong>we</strong>re<br />
nineteenth-century. There was a growing realization that<br />
new redundancy procedures <strong>we</strong>re required, and by the<br />
time they <strong>we</strong>re introduced in 1969, there was something<br />
of a backlog, with about 370 churches already effectively<br />
redundant. 11 I have therefore started the graph at that<br />
point, to give a clearer idea of new redundancies since<br />
then.<br />
The rate of redundancies peaked in the mid 1980s at<br />
around 60 churches per year, and dropped sharply in the<br />
following decade; the current underlying rate is in the low<br />
thirties per year. 12<br />
Why did redundancy slow <strong>do</strong>wn at a time when typical<br />
congregations have been shrinking as fast as ever? One<br />
possible reason, discussed later, is that small congregations<br />
may not have not shrunk as fast as others. Another is that,<br />
in rural areas, after the loss of pub, shop, school and post<br />
of#ce, there is a feeling that ‘the Church is the last bastion<br />
of village life’. This may lead to a growing desire by rural<br />
communities to hang on to the building, especially as<br />
‘there is no outside agency that can impose closure on the<br />
church’. 13<br />
Of the approximately 1630 churches made redundant<br />
since 1969, roughly one #fth (about 340) have been<br />
preserved, almost all by being placed in the care of the<br />
Churches Conservation Trust (CCT) (see box). Just over a<br />
#fth of redundant churches (about 360) have been<br />
demolished and the site disposed of, and of these, only<br />
about 85 buildings <strong>we</strong>re listed: this represents a lo<strong>we</strong>r<br />
proportional rate of loss of listed buildings than for secular<br />
buildings. 14 Almost all the remaining redundant churches,<br />
nearly three #fths (925), <strong>we</strong>re converted to alternative use.<br />
(For details, see Appendix D.)<br />
Except when a new church building is being funded<br />
from the sale, one third of any sale proceeds from<br />
redundant churches supports the CoE’s funding of the<br />
CCT, and the remaining two-thirds goes to the diocese.<br />
Graph 2.3 Total redundant and new churches since 1969<br />
S<strong>our</strong>ce: Church Commissioners Redundant Churches Committee,<br />
Report, 2002<br />
1800<br />
1600<br />
1400<br />
1200<br />
1000<br />
800<br />
600<br />
400<br />
200<br />
370<br />
0<br />
112<br />
694<br />
224<br />
1002<br />
335<br />
1261<br />
391<br />
1422<br />
463<br />
1566 1626<br />
507 532<br />
0<br />
1965 1970 1975 1980 1985 1990 1995 2000 2005<br />
redundant churches<br />
new churches
HOW DO WE KEEP OUR <strong>PARISH</strong> <strong>CHURCHES</strong>? • CHURCH BUILDINGS AND THEIR CARERS 21<br />
The Churches Conservation Trust (CCT)<br />
is a statutory body, set up in 1969 as the<br />
Redundant Churches Fund, changing its<br />
name in 1994. In its care are vested<br />
redundant church buildings which are<br />
deemed too important to demolish, and<br />
for which no suitable new use can be<br />
found. It now looks after some 330<br />
churches ‘in the interests of the nation<br />
and the Church of England’: it thus has as<br />
many church buildings as a small diocese.<br />
The churches remain consecrated, and<br />
are used for occasional services. Many of<br />
the buildings are used from time to time<br />
<strong>CHURCHES</strong> CONSERVATION TRUST (CCT)<br />
for a variety of concerts and festivals<br />
(more than 200 such events in 2001).<br />
The CCT’s estate includes many<br />
buildings of great beauty and character,<br />
<strong>we</strong>ll looked after, and often watched over<br />
by a local volunteer. It has a policy of<br />
making its buildings accessible, and a<br />
history of producing information of a high<br />
quality to guide visitors, of which<br />
(excluding school-children) there are<br />
about one quarter of a million per year.<br />
There is an active educational programme,<br />
with approaching 170 school visits per<br />
year, mostly concentrated in about half a<br />
<strong>do</strong>zen particular churches.<br />
In a number of cases, the CCT is<br />
participating in schemes to enc<strong>our</strong>age<br />
urban and rural regeneration and<br />
community building. It has recently<br />
recruited a Development Director, no<br />
<strong>do</strong>ubt a sign that it is keen to progress<br />
such activity.<br />
The CCT is primarily funded by a<br />
grant, agreed every three years. Of this,<br />
the State pays 70%, via the Department<br />
of Culture, Media and Sport. The other<br />
30% is paid for by the Church<br />
Commissioners, some of this being<br />
provided by the sale of redundant<br />
churches or their sites.<br />
The Churches Conservation Trust (CCT)<br />
estimated that it would require grant<br />
income of £4.9m per annum for each of<br />
the three years beginning April 2003.<br />
This included about £800k per annum<br />
for the vesting of additional churches into<br />
the trust, at the rate of f<strong>our</strong> or #ve<br />
churches per year, the typical recent rate.<br />
The Church Commissioners accepted<br />
the estimates, and <strong>we</strong>re prepared to fund<br />
their share (30%) of the requested<br />
amount. Ho<strong>we</strong>ver, government spending<br />
pressures meant that the grant provided<br />
by the Department of Culture, Media and<br />
Sport (DCMS) was lo<strong>we</strong>r than asked for.<br />
The overall grant was set at £4.2m per<br />
annum, which is £700k (14%) per year<br />
less than was requested. In cash terms, it is<br />
close to being a standstill on previous<br />
years, so is a reduction in real terms (that<br />
is, after allowing for in$ation) of some 5%<br />
or 6% from the previous three years. If<br />
building costs continue to rise at their<br />
current rate, which is faster than general<br />
in$ation, then the new grant would<br />
represent a 10% cut in the CCT’s ability to<br />
carry out repairs and maintenance<br />
compared to the previous three years.<br />
This is bound to have an impact on the<br />
CCT’s ability to accept more churches and<br />
it is hard to see the anticipated ‘f<strong>our</strong> or<br />
#ve churches per year’ being in any way<br />
affordable. (The long time lags in the<br />
process may mean that this is not<br />
immediately noticeable.) Raising more<br />
income may be dif#cult, as the CCT had<br />
previously described its original budget<br />
for non core grant income as ‘very<br />
ambitious’.<br />
The Redundant Churches Committee<br />
of the Church Commissioners are<br />
‘concerned that this [standstill grant] is an<br />
CCT FUNDING<br />
indication of reduced Government<br />
priority for heritage issues’. Because of the<br />
reduction in the CCT grant, and an<br />
increase in the number of redundant<br />
churches coming forward, it will now ‘not<br />
be possible to vest [in the CCT] every<br />
church that quali#es’. The Committee’s<br />
points system ‘will be fully tested by the<br />
situation’. There will be ‘hard choices’.<br />
They say that ‘other solutions’ will have to<br />
be found for some highly-listed<br />
redundant churches.<br />
Examples of these ‘hard choices’ may<br />
already be appearing. For example, in this<br />
context the Ancient Monuments <strong>Society</strong><br />
has drawn attention to the Grade I listed<br />
medieval church at Benington in<br />
Lincolnshire as being offered for sale,<br />
rather than vested with the CCT. It seems<br />
inevitable that others will follow.<br />
An optimistic view might be that over<br />
the longer term this #nancial pressure will<br />
enc<strong>our</strong>age the CCT to develop innovative<br />
forms of partnership and funding, given<br />
that the organisation will be unable to<br />
afford the simple vesting of churches into<br />
the trust. An example is the $agship<br />
project at St Paul’s, Bristol, a redundant<br />
church which is being turned into a circus<br />
school as part of an urban regeneration<br />
project. Frank Field, the Chairman of the<br />
CCT, has said that ‘<strong>we</strong> must think <strong>we</strong>ll<br />
beyond the bounds that the trust has<br />
sought to maintain up to now in carrying<br />
out its functions’.<br />
From 2003, the government will<br />
measure the success of the CCT in three<br />
ways, in addition to the effectiveness of its<br />
use of res<strong>our</strong>ces: in terms of the access it<br />
provides to children, its success in<br />
‘targeting those who would not normally<br />
visit a church’, and the extent to which the<br />
CCT has maximised its economic<br />
contribution to local communities.<br />
This set of measurements is in line<br />
with the Government’s commitment<br />
‘to see the full potential of the historic<br />
environment harnessed as a lifelong<br />
learning res<strong>our</strong>ce for all and made<br />
accessible to the whole of society’.<br />
Thus in announcing the grant, the<br />
Minister of State for the DCMS said<br />
that: ‘In line with departmental<br />
objectives, the trust aims as far as it can<br />
to invest in churches in Government<br />
priority action areas’.<br />
The emphasis on people bene#ting<br />
from these preserved buildings is surely<br />
to be <strong>we</strong>lcomed: the need for them to<br />
be enjoyed was one of the themes of<br />
the Wilding report of 1990. I wonder,<br />
though, whether there is a tension<br />
emerging bet<strong>we</strong>en regarding important<br />
historic buildings as instruments of<br />
social and economic policy, for which<br />
purpose, presumably, one need only<br />
preserve what one might call ‘useful’<br />
examples; and believing that their value<br />
lies to a large extent in the individual<br />
sense of place which they create, so that<br />
one preserves as many as one can afford<br />
to enjoy?<br />
But I have allo<strong>we</strong>d myself to<br />
speculate: which is not at all the point<br />
of this paper.<br />
S<strong>our</strong>ces: Church Commissioners Redundant<br />
Churches Committee, Report, 2002;<br />
Newsletter of the Ancient Monuments <strong>Society</strong>,<br />
Summer 2003; CCT, Annual Report, 2001 and<br />
2002; Financing the Churches Conservation<br />
Trust; Sixth Standing Committee on Delegated<br />
Legislation, 26 February 2003; Funding<br />
Agreements, 2000–2003 and 2003–2006.<br />
Details of these latter items will be found in the<br />
Bibliography.
22 TREVOR COOPER • HOW DO WE KEEP OUR <strong>PARISH</strong> <strong>CHURCHES</strong>? • 2004 • www.ecclsoc.org<br />
A RURAL GROUP OF <strong>PARISH</strong>ES<br />
Sir, — The report on diocesan giving implies that<br />
many rural areas are lacking in generosity. Did the<br />
surveys take into account the amount of money raised<br />
to repair and insure medieval buildings?<br />
These buildings are maintained by the efforts of a<br />
few. In my own parishes, nine churches are supported<br />
by a population of 1800. Of these people, only about<br />
160 are committed worshippers, despite what the<br />
electoral rolls may say.<br />
Much of the faithful’s fund-raising is split bet<strong>we</strong>en<br />
the parish share (met in full) and repair costs. It is no<br />
help to the diocese to make any of the churches<br />
redundant. Maintenance costs would then come out of<br />
the diocesan budget, unless the building could be<br />
sold....<br />
S<strong>our</strong>ce: letter to the Church Times from an East Anglian vicar,<br />
1 August 2003, reproduced by kind permission<br />
The amounts received by dioceses <strong>do</strong> not seem<br />
particularly large – each diocese received an average of<br />
£12,000 per year in the #ve years up to 2002, and three or<br />
f<strong>our</strong> times more than this in the mid 1980s (in money of<br />
the time). 15<br />
Are there too many church buildings?<br />
Despite these efforts, there are still many more churches<br />
than are necessary to seat today’s worshippers.<br />
Some of the recent blame for this can be placed on the<br />
Victorians, who <strong>we</strong>re over-enthusiastic in building and<br />
enlarging churches, a good number of which <strong>we</strong>re<br />
becoming empty as early as the end of the nineteenth<br />
century. Today <strong>we</strong> have some 2,200 more church<br />
buildings than <strong>we</strong> had in 1851, but <strong>our</strong> all-age attendance<br />
over the whole of Sunday (940,000) is around half the<br />
estimated 1.8 million people who attended Sunday<br />
morning service alone in 1851. 16<br />
One way of estimating the current overcapacity would<br />
be to look at the number of seats provided. This is not<br />
known nationally. Ho<strong>we</strong>ver #gures are available for some<br />
dioceses. One such is the diocese of Chelmsford, a mix of<br />
urban, suburban and rural areas (see Section 5.3) There<br />
are wide variations bet<strong>we</strong>en churches in the diocese, but<br />
the average usage of seats on a Sunday is 37%. In fact, this<br />
overstates the usage of seats, as the measure of attendance<br />
includes all Sunday services: at any one service the average<br />
seat utilisation will be less than 37%.<br />
It is notable that in some deaneries in Chelmsford<br />
(mainly the rural ones) the average seat usage is less than<br />
20%; in other deaneries, typically the urban ones, more<br />
than 50%. Some – roughly one half – of this difference is<br />
caused not by different churchgoing rates, but by<br />
variations in the number of seats per head of population.<br />
If the diocese of Chelmsford is taken as typical, then<br />
across the board the CoE could remove 4,000 church<br />
buildings from use, one quarter of its stock, and its average<br />
usage of seats on a typical Sunday would still only rise to<br />
about 50% (on the overstated measure). Carol services<br />
might then be somewhat overcrowded at the busier<br />
churches (based on the #gures in Appendix G, the average<br />
CHURCH BUILDING IN 2003<br />
Provided they get or have pledged the £2 million<br />
needed (and they are con#dent they will), the Revd<br />
David Price tells me that it should be possible to start<br />
building the new church on Elvetham Heath next year.<br />
That will enable a congregation of Anglicans, Baptists,<br />
Methodists and URC, plus a variety of other<br />
denominations, to move in a year later. Elvetham Heath<br />
is a new development...Theinterdenominational<br />
church services are held on Sunday mornings [at the<br />
community centre], “though <strong>we</strong> have to be out sharp by<br />
12 noon because the martial-arts class moves in”....<br />
The 150 members of the congregation need their own<br />
church because special occasions mean standing in the<br />
aisles.<br />
S<strong>our</strong>ce: extracted by kind permission from the Church Times,<br />
12 September 2003<br />
church would then be 125% full – some would be less,<br />
some more) but where necessary these exceptional<br />
congregations could be accommodated by <strong>do</strong>ubling up<br />
carol services, as happens at some churches already. This<br />
is, of c<strong>our</strong>se, a grossly over-simpli#ed and rather foolish<br />
calculation, but it gives some measure of the extent to<br />
which the CoE has far more buildings than it needs to<br />
house its regular Sunday worshippers.<br />
Recent proposals for closure re$ect the above #gures,<br />
though in all cases these are under discussion and the<br />
actual number of redundancies may <strong>we</strong>ll be less. 17<br />
• Of the approximately 40 church buildings in the City<br />
and Deanery of York (which includes the suburbs of<br />
York), it was suggested that some seven (roughly<br />
17%) church buildings should be made redundant.<br />
• There are about 350 churches in the diocese of<br />
Manchester. In the late 1990s, about 60 (roughly<br />
17%) of these <strong>we</strong>re thought to be surplus to<br />
requirements.<br />
• In the recent report on the deaneries of Brighton and<br />
Hove, some #fteen (27%) of the 56 churches have<br />
been suggested for closure, with a further seven<br />
being proposed for alteration or partial<br />
redevelopment; this relatively larger proportion may<br />
have resulted from the diocese of Chichester having<br />
fe<strong>we</strong>r closures in the past, and from Brighton’s<br />
unusual ecclesiastical history.<br />
It must be remembered that the option taken by other<br />
denominations, and by secular distribution networks, such<br />
as pubs and banks, of simply closing under-used buildings<br />
is not so easily available to the CoE, which has a historic<br />
commitment to be universally accessible; pastoral<br />
concerns of individual congregations to consider; many<br />
listed buildings; and a complex and expensive process to<br />
go through when a church is closed.<br />
The location of churches<br />
Not only are there more church buildings than are needed<br />
to seat congregations, but many church buildings are not<br />
close to where the majority of worshippers live. As a<br />
result, a small number of buildings serve the majority of
HOW DO WE KEEP OUR <strong>PARISH</strong> <strong>CHURCHES</strong>? • CHURCH BUILDINGS AND THEIR CARERS 23<br />
Table 2.6<br />
Number of church buildings supported by the smallest rural parishes, by population of parish (2000)<br />
Some figures rounded<br />
Which rural<br />
parishes<br />
(by<br />
population)<br />
Population of<br />
largest of<br />
these<br />
parishes<br />
In these<br />
parishes,<br />
average<br />
population<br />
How many<br />
churches<br />
supported by<br />
these<br />
parishes*<br />
% of English<br />
population in<br />
these parishes<br />
% of English<br />
churches in<br />
these<br />
parishes*<br />
smallest 200 76 50 200 0.0% 1.2%<br />
smallest 500 126 80 500 0.1% 3.1%<br />
smallest 1000 197 120 1000 0.2% 6.2%<br />
smallest 1500 271 160 1500 0.5% 9.2%<br />
smallest 2000 346 200 2000 0.8% 12.3%<br />
smallest 3000 571 280 3000 1.7% 18.5%<br />
smallest 4000 1084 410 4000 3.2% 24.7%<br />
smallest 5000 2620 660 5000 6.6% 30.8%<br />
S<strong>our</strong>ce: National Parish Questionnaire returns used for Countryside Agency Rural Services in 2000 report, my analysis of<br />
summary returns available on Countryside Agency <strong>we</strong>bsite <br />
*Figures in this column<br />
understated. All of these<br />
parishes support at least one<br />
church building (I omitted<br />
those that did not). Some<br />
support more than one, so the<br />
final column understates the<br />
number of church buildings<br />
supported by these<br />
communities.<br />
churchgoers. A survey in 1998 suggested that approaching<br />
two-thirds of those attending church (61%) are<br />
concentrated in just one #fth (21%) of church buildings. 18<br />
From Table 2.3, <strong>we</strong> can estimate that one quarter of<br />
parishes (25%) provide seats for less than 6% of adults<br />
attending church on Sunday.<br />
But this is not surprising, given <strong>how</strong> long ago the<br />
position of many churches was decided. The location of<br />
about 6,000 churches had been #xed within one hundred<br />
and #fty years of the Norman Conquest. A further 4,000<br />
(approximately) had their site chosen over the next three<br />
hundred years. Another 6,000 or so <strong>we</strong>re #rst positioned<br />
in the nineteenth century, more than half in a building<br />
boom bet<strong>we</strong>en 1840 and 1875. Even as late as 1851 it was<br />
said that people would not walk more than a mile to<br />
church, in$uencing the pattern of building in rural areas<br />
in a way which is now often inappropriate. Given the<br />
various population shifts since the Norman Conquest,<br />
and the more recent move away from horse and cart<br />
towards the motor car, it is not surprising that many<br />
church buildings are in areas where there is a small<br />
population and not many worshippers. 19<br />
2.4 How evenly spread is the task?<br />
Because many rural churches are no longer near centres of<br />
population, the task of <strong>keep</strong>ing them is not evenly spread.<br />
For the tiniest rural communities (Table 2.6), the task<br />
of care is disproportionately heavy – I estimate that the<br />
500 smallest rural parishes with churches in England<br />
(representing 3.1% of all churches) have an average<br />
population of 80 people, together representing just 0.1%<br />
of the population. The 2000 smallest rural parishes have<br />
an average population of about 200 people, representing<br />
12% of churches being in communities with less than 1%<br />
of the population.<br />
So a number of very tiny rural communities are<br />
supporting signi#cant numbers of churches. Many of<br />
these will be listed: Map 2.1 con#rms that it is rural areas<br />
which tend to have the highest proportion of listed<br />
churches (though Map 2.2 s<strong>how</strong>s that some urban areas<br />
can more than match them in listed buildings per square<br />
mile, because of the greater density of building).<br />
As would therefore be expected, rural dioceses have far<br />
fe<strong>we</strong>r members of the general population per church<br />
building than <strong>do</strong> other dioceses (Graph 2.4). Lon<strong>do</strong>n, for<br />
example, has nearly ten times as many people per church<br />
buildings as Hereford diocese.<br />
In fact, just f<strong>our</strong> dioceses (Hereford, St Edmundsbury<br />
& Ipswich, Norwich and Carlisle) have nearly 12% of<br />
English parish churches, but only a little over 4% of the<br />
population of England. Thus people in these dioceses each<br />
have something approaching three times the average share<br />
of parish churches to maintain. If a further f<strong>our</strong> dioceses<br />
are included – Lincoln, Salisbury, Bath & Wells and<br />
Gloucester – then all eight dioceses bet<strong>we</strong>en them look<br />
after one quarter of parish church buildings (25%) with<br />
hardly more than one tenth of the population (11%).<br />
But great caution is needed with this form of analysis,<br />
because not all church buildings are equal. A small, rural,<br />
Norman church in good condition will cost much less to<br />
repair than an urban Victorian monster which has been<br />
suffering from neglect. Only looking at the population per<br />
church building, without taking account of the different<br />
kinds of problems found in different locations, may be<br />
misleading.<br />
Furthermore, looking at the general population per<br />
church ignores the fact that it is committed churchgoers<br />
who pay the bills. On average, 2.8% of the population<br />
(2001) are church ‘members’ (on the electoral roll of a<br />
parish). But this varies enormously: in some dioceses it<br />
three times this proportion, in others as low as half. As a<br />
rule of thumb, urban dioceses tend to have lo<strong>we</strong>r<br />
proportional membership than rural ones. The impact can<br />
be seen in Graph 2.5, which s<strong>how</strong>s the electoral roll per<br />
church building. Hereford diocese still has amongst the<br />
lo<strong>we</strong>st support per church building, but Lon<strong>do</strong>n only has<br />
about three times as many members per church building<br />
as Hereford, far smaller than the times-ten factor <strong>we</strong> saw<br />
in the earlier graph. Urban congregations tend to have
24 TREVOR COOPER • HOW DO WE KEEP OUR <strong>PARISH</strong> <strong>CHURCHES</strong>? • 2004 • www.ecclsoc.org<br />
larger and more expensive churches to <strong>keep</strong> up, and are<br />
<strong>do</strong>ing so with levels of churchgoing support only two or<br />
three times greater (on average) than those found in<br />
rural areas.<br />
The picture is con#rmed in Graph 2.6, where it can be<br />
seen that rural areas are estimated to support 35% of<br />
churches with only 8% of church-goers: thus they have<br />
more than f<strong>our</strong> times the average number of buildings to<br />
look after per churchgoer. Inner city and city centre<br />
churchgoers have roughly the average number of<br />
buildings to care for – that is, the percentage of<br />
churchgoers looking after these buildings is approximately<br />
equal to the percentage of church buildings they look after<br />
– but they will often be caring for the biggest, and quite<br />
probably most expensive, buildings. In contrast,<br />
churchgoers in suburban areas and on the urban fringe<br />
each have only about half the average number of churches<br />
to up<strong>keep</strong> (38% of churchgoers <strong>keep</strong>ing 18% of church<br />
buildings).<br />
It is time to summarise. Through all the detail, the<br />
general picture is clear. There has been a general decline<br />
in church attendance. Although a good many<br />
congregations are thriving, some are tiny. Some church<br />
buildings have closed (and new ones have opened) but the<br />
overall reduction in the size of the network has not been<br />
as large as the reduction in churchgoing. There are still a<br />
very large number of listed buildings being cared for by<br />
Graph 2.4 Population per church building, by<br />
diocese (2001)<br />
S<strong>our</strong>ce: Church Statistics 2001, Table 1<br />
Lon<strong>do</strong>n<br />
Birmingham<br />
Southw ark<br />
Liverpool<br />
Manchester<br />
Sheffield<br />
Durham<br />
Rochester<br />
Blackburn<br />
Wakefield<br />
Chelmsford<br />
Guildford<br />
Bristol<br />
Portsmouth<br />
Chester<br />
St Albans<br />
Bradford<br />
Lichfield<br />
Southw ell<br />
Coventry<br />
New castle<br />
Winchester<br />
Ripon<br />
Derby<br />
Chichester<br />
Worcester<br />
Leicester<br />
Oxford<br />
Canterbury<br />
York<br />
Peterborough<br />
Ely<br />
Exeter<br />
So<strong>do</strong>r & Man<br />
Truro<br />
Gloucester<br />
Bath & Wells<br />
Salisbury<br />
Lincoln<br />
Carlisle<br />
Norw ich<br />
St Edms &<br />
Hereford<br />
7194<br />
7082<br />
6317<br />
5976<br />
5327<br />
5243<br />
4845<br />
4582<br />
4413<br />
4399<br />
4374<br />
4336<br />
4263<br />
4145<br />
4120<br />
4051<br />
3867<br />
3366<br />
3210<br />
3136<br />
3081<br />
2988<br />
2932<br />
2931<br />
2891<br />
2869<br />
2710<br />
2567<br />
2498<br />
2199<br />
2055<br />
1893<br />
1735<br />
1689<br />
1589<br />
1514<br />
1491<br />
1476<br />
1465<br />
1385<br />
1268<br />
1251<br />
735<br />
0 1000 2000 3000 4000 5000 6000 7000 8000<br />
Population per church<br />
Rural: other areas<br />
Rural: commuter <strong>do</strong>rmitory<br />
Suburban / urban fringe<br />
Separate town<br />
Inner city<br />
City centre<br />
Council estate<br />
Other built up area<br />
0 5 10 15 20 25 30 35 40<br />
8<br />
7<br />
6<br />
8<br />
6<br />
4<br />
4<br />
3<br />
5<br />
21<br />
17<br />
18<br />
Church buildings % Attendance %<br />
Graph 2.6 Proportion of all church buildings in England and<br />
proportion of overall Sunday attendance in England (all ages)<br />
found at each type of location (1998)<br />
S<strong>our</strong>ce: Brierley, Religious Trends, 3, 2.24.1 and 2.24.2<br />
church congregations – small groups of volunteers. For<br />
historical reasons, many rural church buildings serve (and<br />
are potentially supported by) a relatively small number of<br />
inhabitants; whilst in urban areas the level of churchgoing<br />
is lo<strong>we</strong>r as a proportion of the population, putting<br />
pressure on those who care for larger buildings. Given<br />
these pressures, <strong>we</strong> must now ask, what is the condition of<br />
<strong>our</strong> church buildings?<br />
Graph 2.5 Electoral roll per church building, by<br />
diocese (2001); dioceses s<strong>how</strong>n in same order as Graph 2.4<br />
S<strong>our</strong>ce: Church Statistics 2001, Tables 1 and 11<br />
Lon<strong>do</strong>n<br />
Birmingham<br />
Southw ark<br />
Liverpool<br />
Manchester<br />
Sheffield<br />
Durham<br />
Rochester<br />
Blackburn<br />
Wakefield<br />
Chelmsf ord<br />
Guildford<br />
Bristol<br />
Portsmouth<br />
Chester<br />
St Albans<br />
Bradford<br />
Lichfield<br />
Southw ell<br />
Coventry<br />
New castle<br />
Winchester<br />
Ripon<br />
Derby<br />
Chichester<br />
Worcester<br />
Leicester<br />
Oxford<br />
Canterbury<br />
York<br />
Peterborough<br />
Ely<br />
Exeter<br />
So<strong>do</strong>r & Man<br />
Truro<br />
Gloucester<br />
Bath & Wells<br />
Salisbury<br />
Lincoln<br />
Carlisle<br />
Norw ich<br />
St Edms & Ipsw ich<br />
Heref ord<br />
59<br />
42<br />
56<br />
46<br />
74<br />
75<br />
75<br />
67<br />
71<br />
80<br />
16<br />
88<br />
80<br />
52<br />
76<br />
69<br />
66<br />
52<br />
63<br />
55<br />
62<br />
57<br />
69<br />
75<br />
84<br />
48<br />
94<br />
99<br />
99<br />
93<br />
98<br />
102<br />
114<br />
109<br />
118<br />
115<br />
117<br />
135<br />
128<br />
130<br />
129<br />
137<br />
142<br />
35<br />
151<br />
0 20 40 60 80 100 120 140 160<br />
Electoral roll per church<br />
38
HOW DO WE KEEP OUR <strong>PARISH</strong> <strong>CHURCHES</strong>? • CHURCH BUILDINGS AND THEIR CARERS 25<br />
Dioceses with highest % of churches hi-graded<br />
Dioceses with highest density of hi-graded churches<br />
Lo<strong>we</strong>st %<br />
Lo<strong>we</strong>st<br />
Map 2.1<br />
Ranking of dioceses<br />
by percentage of their<br />
church buildings<br />
which are highly<br />
graded<br />
Map 2.2<br />
Ranking of dioceses<br />
by highly-graded<br />
churches per square<br />
mile<br />
Map 2.1 ranks dioceses according to the percentage of their church Map 2.2 ranks dioceses according to number per square mile of<br />
buildings which are highly-graded (Grades I, II*, A, B)<br />
church buildings which are highly-graded (Grades I, II*, A, B)<br />
S<strong>our</strong>ce: Appendix F<br />
S<strong>our</strong>ces: Appendix F; Church Statistics 2001, Table 1<br />
Maps 2.1 (left) and 2.2 (right) Both these maps divide the 43 dioceses into f<strong>our</strong> groups, omitting So<strong>do</strong>r and Man (not comparable with the<br />
others) and Carlisle, Liverpool and Wakefield (information not available, s<strong>how</strong>n with question marks). The right hand map includes more<br />
urban dioceses: although they tend to have a smaller proportion of listed buildings than rural dioceses, their concentration on the ground<br />
means that there are more per square mile. (Map software by kind permission of the CoE.)<br />
Notes<br />
1. Ian Loe, Campaign for Real Ale, personal communication.<br />
2. Rate of rural post of#ce closure from Postwatch Annual Report<br />
2002–3, available at ; support package for rural post of#ces<br />
announced 2 Dec 2002 (DTI <strong>we</strong>bsite ).<br />
3. For Methodists closure and Anglican church planting, see George<br />
Lings & Stuart Murray, Church Planting: Past, Present and Future<br />
(Grove Books, Cambridge, 2003, ISBN 1851745246), pages 7 and 8.<br />
For church closures and openings, see Section 2.3 above.<br />
4. Nineteenth-century count from Appendix 2 of The Preservation of <strong>our</strong><br />
Churches, and see also Robert Currie et al., Churches and Churchgoers<br />
(Oxford, 1997), pages 213–6. Listed church buildings count from<br />
Appendix F, below. Number of listed buildings owned by National<br />
Trust and English Heritage, personal communication; the number<br />
is hard to obtain precisely, because many of their listed buildings are<br />
part of larger complexes.<br />
5. For under-listing, see Appendix B.<br />
6. For use of redundant buildings, see Appendix D, below. For sale<br />
proceeds, see note 15 below. For #nancial position of dioceses, see<br />
the Church Times, 25 July 2003 and other items listed in the<br />
Bibliography.<br />
7. For this paragraph, see Appendix G.<br />
8. A survey of 1994 suggests that the #gure was somewhat higher than<br />
this, standing at that date at perhaps 17 people for the 3,600 rural<br />
communities with fe<strong>we</strong>r than 400 inhabitants, and rising to an<br />
average of 22 for the 6,000 communities with fe<strong>we</strong>r than 900<br />
inhabitants. Some of the difference is accounted for by the drop in<br />
attendance bet<strong>we</strong>en 1994 and 1998. See Appendix E for the 1994<br />
survey, but note that some of the communities included in those<br />
churches with an average attendance of 22 may be ‘commuter rural’<br />
areas, s<strong>how</strong>n as a different category in Table 2.4.<br />
9. Brierley, Tide, Table 31.<br />
10. See Brierley, Religious Trends, 2, 8.4 and 8.5.<br />
11. Findlay, Protection of <strong>our</strong> English Churches, pages 53, 110.<br />
12. Church Commissioners, personal communication.<br />
13. Peterborough, Setting God’s People Free, page 12; Jackson, Hope for the<br />
Church, page 110.<br />
14. English T<strong>our</strong>ism Council, The Heritage Monitor, 1999, page 24.<br />
15. Financing the Churches Conservation Trust, Appendix 1, page 11.<br />
16. Currie et al., Churches and Churchgoers (Oxford, 1997), pages 214,<br />
216. The 1851 census counted 2.5 million attendees (adults,<br />
children and Sunday scholars) at morning service. To subtract<br />
Sunday School children, I obtained Sunday School membership<br />
from Gill, The Myth of the Empty Church, Table 6 and then took<br />
account of typical rates of attendance at Sunday School (page 24),<br />
concluding that the 1851 #gure for attendance should be reduced<br />
by six or seven hundred thousand Sunday School attendees to<br />
obtain a #gure for adult and child attendance. For the broad<br />
reliability of the census, see Gill, passim.<br />
17. See Bibliography for diocesan reports.<br />
18. English Church Attendance Survey, 1998, as reported in Brierley,<br />
Tide, Table 10, some #gures corrected (personal communication).<br />
19. For dates of location of churches see e.g. Richard Morris, Churches<br />
in the Landscape (1989), page 147; see also his ‘The church in the<br />
countryside’, pages 51–3, in Della Hooke (ed.), Medieval Villages<br />
(Oxford, 1985). For Victorian building see Currie et al., Churches and<br />
Churchgoers, pages 213–6, and the Bibliography, below. For walking<br />
one mile to church, see Alasdair Crockett, ‘Variations in<br />
churchgoing rates in England in 1851’ (University of Oxford<br />
Discussion Papers in Economic and Social History, number 36<br />
(August 2000)), available at .
26<br />
3. Keeping church buildings in good repair<br />
3.1 Spending on parish churches<br />
What is the current position?<br />
Despite the pressures described in the previous section,<br />
large sums of money are being raised by these voluntary<br />
groups (congregations) to <strong>keep</strong> their church buildings in<br />
good repair. In each of the f<strong>our</strong> years up to 2001,<br />
expenditure on repairs has been running at an average of<br />
about £82m per year (in 2001 money), an average<br />
expenditure of about £5,000 per church building per year.<br />
On top of this is the cost of routine maintenance<br />
(insurance, heating, small repairs, etc.), about another<br />
£16m per year. 1<br />
Is this average #gure of £5,000 per year enough? How<br />
much ought to be spent? Are churches being maintained<br />
in good condition? Or are future problems being stored<br />
up?<br />
To understand properly whether churches <strong>we</strong>re being<br />
adequately maintained, <strong>we</strong> would need three pieces of<br />
information (see diagram ‘The repairs pipeline’):<br />
• the rate at which new deterioration will be occurring<br />
and new needs discovered;<br />
• a snapshot of the current state of the churches – their<br />
outstanding repairs;<br />
• the rate at which repairs are carried out.<br />
Anec<strong>do</strong>tal evidence about the second of these, the<br />
current state of churches, is not in short supply (see box),<br />
and suggests that the majority of church buildings are in<br />
reasonable or good condition. A systematic view is much<br />
harder to obtain. The national Buildings at Risk register<br />
<strong>do</strong>es not normally include churches still in use, so there is<br />
no central s<strong>our</strong>ce of information about listed church<br />
buildings with major problems.<br />
All the information I could #nd is discussed in<br />
Appendix A. My best estimate – an informed guess, really<br />
– is that 50% of listed churches – some 6000 buildings –<br />
ANECDOTAL EVIDENCE ON THE<br />
CONDITION OF <strong>CHURCHES</strong><br />
An experienced archdeacon (north of England).Inmy<br />
experience, churches have never been in such good<br />
condition as they are now.<br />
Student of rural churches, carrying out a systematic survey,<br />
visiting many hundreds each year. The condition of<br />
churches is generally good. Structurally I have come<br />
across only a few that are closed as being dangerous<br />
buildings. That <strong>do</strong>esn’t mean to say they <strong>do</strong>n’t have<br />
problems if you look closely, but very few are actually<br />
falling to bits.<br />
Frequent visitor to churches, in the South-East and elsewhere,<br />
both for purposes of study and with professional responsibilities.<br />
The basic condition seems #ne. Ho<strong>we</strong>ver, cosmetically<br />
they could be better. Many need a bit of tender loving<br />
care.<br />
Trustee of a county Churches Trust, the county containing<br />
hundreds of rural churches. Churches in this county are in<br />
much better condition than t<strong>we</strong>nty years ago. I would<br />
say that only about one in #fty of them give cause for<br />
real anxiety.<br />
S<strong>our</strong>ces: personal communications<br />
In the diocese of Chelmsford, which surveyed its<br />
parishes in 2003 (see Section 5.3), 85% of churches<br />
<strong>we</strong>re said by churchwardens to be ‘in good condition’.<br />
S<strong>our</strong>ce: Chelmsford, Review<br />
In the diocese of Manchester in the mid 1990s, 21% of<br />
churches <strong>we</strong>re said to be ‘needing attention’ and 9% in<br />
‘poor’ condition.<br />
S<strong>our</strong>ce: see Appendix A
HOW DO WE KEEP OUR <strong>PARISH</strong> <strong>CHURCHES</strong>? • KEEPING CHURCH BUILDINGS IN GOOD REPAIR 27<br />
have outstanding repairs less than £100k. Indeed, these<br />
6000 buildings might all have known repair needs less<br />
than £50k. The next 3000 (25%) of listed churches<br />
probably all fall below £200k, perhaps <strong>we</strong>ll below. As for<br />
the #nal 3000 listed churches, the sky is the limit, but <strong>our</strong><br />
evidence <strong>do</strong>es not help us to guess <strong>how</strong> many, or <strong>how</strong><br />
few, actually require very large sums of money. It<br />
probably depends on <strong>how</strong> many very large Victorian<br />
churches there are, and their state of disrepair, about<br />
which I have no solid information.<br />
Perhaps 10% of churches <strong>we</strong>re in ‘poor’ condition in<br />
the mid to late 1990s, but <strong>how</strong> many needed urgent work,<br />
or <strong>we</strong>re in a serious state, <strong>we</strong> <strong>do</strong> not know. As to the<br />
overall cost of known repairs, for listed churches it would<br />
not surprise me if it fell bet<strong>we</strong>en £1000m and £3000m,<br />
though this is not a very useful #gure unless one knows<br />
<strong>how</strong> quickly these repairs need to be carried out, which<br />
<strong>we</strong> <strong>do</strong> not.<br />
One line of evidence suggests an average spend of £8,000<br />
per church per year might on average clear the existing<br />
stock of known repairs at a safe rate (though new ones<br />
would be following behind). But this #gure takes<br />
insuf#cient account of the repair costs of large Victorian<br />
churches. The actual rate of spend is £5,000 per year. As<br />
far as I can tell, some of the difference may be at the top<br />
end: some CoE parishes may not be carrying out very big<br />
repairs – larger than (say) £50k – quite as often as they<br />
ought to. As Jeremy Eckstein suggested in 2001, it is likely<br />
that ‘all too often #nancial constraints cause congregations<br />
to a<strong>do</strong>pt a knee-jerk, reactive response to the fabric needs<br />
of their churches’ – that is, that the most pressing needs<br />
are perhaps being dealt with, but larger non-urgent repairs<br />
are put off as long as possible, and smaller preventive work<br />
is being neglected. But these are very tentative<br />
conclusions, and an up to date review is needed.<br />
On balance then, and with a high degree of uncertainty, the<br />
evidence suggests that despite everyone’s best efforts,<br />
there is some annual underspend on church repairs.<br />
If there is an underspend, <strong>do</strong>es it matter? These are<br />
robust buildings, and it may be that they can continue for<br />
decades without being put in perfect order, so long as key<br />
repairs are carried out, and they are kept <strong>we</strong>atherproof. We<br />
simply <strong>do</strong> not know.<br />
Inspection and maintenance<br />
A number of years ago the CoE led the way with the<br />
introduction of #ve-yearly (quinquennial) inspections of<br />
its buildings. These play a crucial role in alerting parishes<br />
to developing problems. It is known that quinquennial<br />
reports vary both in their quality and their usefulness to<br />
parishes (one diocese will soon be carrying out a study on<br />
this), but there is no <strong>do</strong>ubt that they have had a major<br />
impact on the care of churches.<br />
Ho<strong>we</strong>ver, all those I have spoken to who have<br />
experience of church repairs say that a high proportion of<br />
congregations are poor at routine maintenance – cleaning<br />
out gutters, #xing loose tiles, and dealing with small<br />
problems quickly. In conversation, people have suggested<br />
to me that anything bet<strong>we</strong>en one third and two-thirds of<br />
churches <strong>do</strong> not carry out maintenance <strong>we</strong>ll.<br />
The only systematic evidence for the present situation<br />
is the report by Geoffrey Claridge. He said that ‘there was<br />
probably only a minority of cases where it could be said in<br />
all honesty that gutters <strong>we</strong>re clean, gully traps <strong>we</strong>re free<br />
and ground drainage worked satisfactorily’. Overall he<br />
found that nearly a quarter (22%) of churches <strong>we</strong>re<br />
inadequately maintained. Ho<strong>we</strong>ver, he pointed out that ‘of<br />
those judged inadequate, relatively few <strong>we</strong>re considered to<br />
be seriously neglected’. 2<br />
Some dioceses have been energetic in training<br />
churchwardens in basic maintenance, and it may be that<br />
there is less of a problem in these dioceses: I <strong>do</strong> not have<br />
the evidence.<br />
This is not a new issue. In a much-reprinted guide to<br />
churchwardens of 1841, great stress was laid on <strong>keep</strong>ing<br />
the church dry: ‘the great cause of almost all the ruin and<br />
unhealthiness that are found in <strong>our</strong> parish churches may<br />
be told in one word, DAMP’. A century later, the 1952<br />
report The Preservation of <strong>our</strong> Churches devoted several pages<br />
to what it saw as a signi#cant problem and the need for<br />
training of ordinands and of churchwardens. 3<br />
As I understand it, there are currently no grants<br />
available for maintenance. For example, English<br />
Heritage/Heritage Lottery Fund (EH/HLF) grants are<br />
generally only available for urgent repairs (needed in the<br />
next two years), and costing more than £10,000. Nor <strong>do</strong>es<br />
the system of grants easily provide money for emergency<br />
repairs. One grant-making trust estimates that it receives<br />
one phone call a day from churches needing emergency<br />
repairs, a demand it is quite unable to meet. Work may<br />
therefore be delayed for some years and become much<br />
more expensive in consequence – I have been told by<br />
several people that they believe that much repair<br />
expenditure is due to delay.<br />
A recent pilot initiative, Maintaining <strong>our</strong> Heritage (see<br />
box), may prove a useful way forward. In addition, EH is<br />
exploring with at least two dioceses the possibility of<br />
supporting a maintenance/small repair function, either<br />
through direct action or small, quick grants to meet<br />
immediate need. Furthermore, the grant scheme jointly<br />
funded by English Heritage and the Heritage Lottery<br />
Fund (EH/HLF) now insists on the production of a<br />
maintenance plan, and annual certi#cation of compliance<br />
with it, as a condition of making a grant.<br />
GUTTERS<br />
Some time ago, a friend and I spent a day clearing<br />
knee-deep rotting leaves from the parapet gutters of<br />
St Botolph’s, Aldersgate, in the City of Lon<strong>do</strong>n. The<br />
churchwardens had <strong>do</strong>ne nothing to clear the gutters for<br />
#ve years, as a result of the long-threatened redundancy<br />
of the church.<br />
Our work was, unfortunately, in vain. The leaves had<br />
caused rainwater to overtop the guttering and penetrate<br />
the building, causing an outbreak of dry rot which has<br />
cost £500,000 to repair. It might all have been prevented<br />
by regular attention from one man with a brush and a<br />
bucket, costing about £200 a year.<br />
S<strong>our</strong>ce: George Allan, ‘Preventive maintenance, the way forward?’, in<br />
Context, Institute of Historic Building Conservation, September 1999.<br />
Available at .
28 TREVOR COOPER • HOW DO WE KEEP OUR <strong>PARISH</strong> <strong>CHURCHES</strong>? • 2004 • www.ecclsoc.org<br />
INSPECTIONS AND MAINTENANCE<br />
MONUMENT WATCH<br />
Perhaps one way to enc<strong>our</strong>age better routine maintenance<br />
of church buildings would be to have a specialist team of<br />
people arriving once a year at the church porch to <strong>do</strong> the<br />
job?<br />
To a certain extent, this is what happens in the<br />
Netherlands, where a signi#cant proportion of owners of<br />
listed buildings pay to have an annual inspection of their<br />
buildings carried out by a team from Monument Watch<br />
(Monumentenwacht). This organization has been<br />
operating in the Netherlands since the early 1970s, and<br />
there are now more than #fty teams in operation, each of<br />
two people. A similar organization was started in Flanders<br />
in the early 1990s.<br />
Ho<strong>we</strong>ver, the main purpose of Monument Watch is not<br />
to carry out work, but to report on what preventive work<br />
is needed. To some extent this has been misunderstood in<br />
the UK, where the service is sometimes portrayed as a<br />
highly-trained version of the odd-job man, #xing<br />
problems on the spot. In fact, the emphasis in the<br />
Netherlands is on reporting, not on #xing, and the owner<br />
of the building is then responsible for specifying and<br />
commissioning any necessary work from the supplier of<br />
his choice (not Monument Watch). Ho<strong>we</strong>ver Monument<br />
Watch <strong>do</strong> patch up immediate problems. For example,<br />
they might replace a slipped tile, clear a gully, or<br />
temporarily repair a leaking gutter.<br />
These annual inspections are subsidised by the Dutch<br />
government, to the tune of approximately 60% of running<br />
costs. In addition, heavy subsidies and tax breaks (of the<br />
order of 60% or 70%) are available for owners carrying out<br />
work on these buildings, regardless of whether the works<br />
are big or small, prevention or cure.<br />
PREVENTION versus CURE<br />
In essence, then, the Dutch subsidise annual inspections<br />
by craftsmen, aiming for prevention rather than cure, with<br />
heavy subsidies for both small and large work. The<br />
English philosophy for church buildings is rather<br />
different: #ve-yearly inspections by architects or their<br />
equivalents, with large urgent repairs being grant-aided.<br />
It may seem ‘obvious’ that the Dutch approach of<br />
prevention rather than cure is cheaper in the long run. But<br />
it is not easy to prove. Furthermore, some of the savings<br />
may take more than half a century to come through, for<br />
example by making a roof last 80 years rather then 50<br />
years. Nor are preventive measures always cheap.<br />
We have seen in the body of this report that, on average,<br />
churches will go for t<strong>we</strong>nty years without signi#cant<br />
repairs. The business case for preventive maintenance in<br />
churches says, in essence, that a church should increase its<br />
annual expenditure today by carrying out work in areas<br />
which are not yet causing a problem, in order to reduce<br />
the likelihood of a large repair which anyway may not appear<br />
for t<strong>we</strong>nty or more years. Such an argument may be less than<br />
persuasive to those congregations already strapped for<br />
cash. It may be especially unconvincing when, as now, the<br />
once-every-t<strong>we</strong>nty-years major repair is grant-aided<br />
whilst any annual expenditure on prevention is not.<br />
MAINTAIN OUR HERITAGE<br />
To explore further the issues regarding maintenance, in<br />
the UK an organization called Maintain <strong>our</strong> Heritage<br />
(MOH) has been set up, supported in different ways by a<br />
number of bodies, including EH, HLF, the Department<br />
for Trade and Industry, SAVE Britain’s Heritage and the<br />
Bath Preservation Trust.<br />
One of the aims of MOHis to sponsor a programme<br />
of research into maintenance as currently practised, its<br />
economic consequences, and the role it might play in<br />
future. Some very useful papers have been produced<br />
(see <strong>we</strong>bsite, details below), though the research <strong>do</strong>es<br />
not address the special needs of church maintenance.<br />
The second aim of MOHhas been to run an<br />
experimental scheme in the Bath area from Summer<br />
2002 to Autumn 2003, along the lines of Monument<br />
Watch. The intention was to gain practical experience,<br />
and to understand better the level of demand that might<br />
arise. The prices <strong>we</strong>re heavily subsidised: for example,<br />
inspection of a church was #nally priced as low as £50 to<br />
stimulate demand, whereas the direct cost, ignoring<br />
overheads, was several hundred pounds. This was a<br />
completely new service, and uptake was low during the<br />
year that the pilot ran. Across all listed buildings in the<br />
area, around 1% took advantage of the service, and only<br />
a handful of churches.<br />
From the point of view of churches, I suspect that<br />
there may have been too much emphasis on inspection<br />
and reporting, rather than immediate maintenance and<br />
on-the-spot work. For example, the published report on<br />
South Stoke church, undertaken as part of the research<br />
project, listed some work which should be <strong>do</strong>ne within<br />
the next year (costing an estimated £6,000) but also<br />
provided a list of works to be carried out over the<br />
following ten years (costing another £8,000).<br />
This follows Dutch practice. Ho<strong>we</strong>ver churches in<br />
England already have an inspection once every #ve<br />
years, and may feel (rightly or wrongly) that they would<br />
learn little new by paying for an annual inspection<br />
bet<strong>we</strong>en times. They are perhaps more interested in<br />
paying for any newly-emerging issues to be put right<br />
immediately, so that they can relax for another year.<br />
A scheme is being considered covering two dioceses<br />
in the Cotswold region, putting more emphasis on<br />
immediate work. Some form of service providing<br />
routine maintenance for churches might #ll a need that<br />
has been felt for at least the past #fty years. If this could<br />
be combined with a gradual shift in grant-aid from cure<br />
to prevention, it might prove a po<strong>we</strong>rful combination.<br />
S<strong>our</strong>ces: the <strong>we</strong>bsite of Maintain <strong>our</strong> Heritage ; their final report; and personal communication. See also<br />
Stefan Binst ‘Monument Watch in Flanders (and the Netherlands)’<br />
available on the <strong>we</strong>bsite of the Heritage Council (Ireland) at<br />
. For<br />
pictures, see Flanders’ Monument Watch on , and Netherlands’ Monument Watch<br />
on .
HOW DO WE KEEP OUR <strong>PARISH</strong> <strong>CHURCHES</strong>? • KEEPING CHURCH BUILDINGS IN GOOD REPAIR 29<br />
Table 3.1<br />
Actual spending on major repairs to church buildings, by amount of spend (2001)<br />
Total repair spend during period was £86.4m<br />
Parishes (actual)<br />
Churches (estimate)<br />
Amount spent<br />
%of<br />
parishes<br />
No. of<br />
parishes<br />
%of<br />
churches<br />
No. of<br />
churches<br />
£m spent on<br />
repairs<br />
zero 42 5440 50 8100 0.0<br />
up to £1k 9 1170 8 1300 0.6<br />
£1k – £5k 24 3100 20 3250 8.1<br />
£5k – £10k 10 1300 9 1460 10.9<br />
£10k – £20k 8 1040 7 1130 17.0<br />
£20k – £50k 5 650 4.3 700 24.4<br />
More than £50k 2 260 1.7 280 25.5<br />
100% =<br />
12,951<br />
parishes<br />
12,951 100% =<br />
16,220<br />
churches<br />
S<strong>our</strong>ce: first column, CoE, personal communication; remaining columns, see Technical note.<br />
16220 £86.4m<br />
Technical note: the figures in the first<br />
column refer to parishes. Many<br />
parishes have more than one<br />
church, and I have estimated the<br />
effect of this in the in the remaining<br />
column. I did this by considering <strong>how</strong><br />
multi-church parishes might have<br />
behaved. At one extreme,<br />
multi-church parishes undertaking<br />
repairs might have only repaired one<br />
of their church buildings, and never<br />
more than one. At the other extreme,<br />
multi-church parishes undertaking<br />
repairs might have repaired all their<br />
church buildings. These<br />
assumptions gave a maximum of<br />
54% and a minimum of 42% of<br />
church buildings not undergoing<br />
repairs. I chose an approximately<br />
central point of 50% for this figure,<br />
and scaled the remaining figures to<br />
add up to 100%. None of this affects<br />
the fundamentals of the argument<br />
made in the text.<br />
3.2 What is the pattern of repairs?<br />
Large repairs are unusual<br />
What is the pattern of repair expenditure over time for an<br />
individual church?<br />
To obtain some idea of this I looked at repair<br />
expenditure over a period of 25 years for #ve<br />
ran<strong>do</strong>mly-chosen churches from the CCT portfolio.<br />
Three features stood out, none of them helpful to a group<br />
of volunteers trying to budget ahead.<br />
First there <strong>we</strong>re many years (very approximately, one<br />
half) where the necessary repair expenditure (on top of<br />
routine maintenance) was zero. Secondly in those years<br />
where repairs <strong>we</strong>re required, the cost varied greatly, and<br />
was only occasionally particularly large. Finally, the #ve<br />
individual CCT churches varied from each other in the<br />
total required over the 25-year period. A key question is<br />
whether this was predictable at the beginning of the<br />
period, but I suspect in some cases it was not: that is, that<br />
the scale of repairs was not foreseeable at the beginning of<br />
the quarter century.<br />
We can approach the pattern of expenditure another<br />
way. In 2001 the total spent on church repairs was £86m,<br />
and the average per church was approximately £5,000.<br />
Ho<strong>we</strong>ver – and this is crucial – nearly f<strong>our</strong> #fths of<br />
churches (an estimated 78%) either spent nothing at all or<br />
spent less than £5,000 (Table 3.1). Nearly nineteen out of<br />
t<strong>we</strong>nty churches spent less than £20k, and for these<br />
churches the average spend was approximately £2,500. It is<br />
the very small number of high-spending churches who in<br />
any one year raise the average to £5,000 per church.<br />
It is important to appreciate <strong>how</strong> unusual is a repair<br />
spend above £50k: only approximately 2% of churches,<br />
roughly one in #fty, spend this much in a given year. To<br />
put it another way, based on this data, any average church<br />
building might reasonably hope to go for t<strong>we</strong>nty years<br />
spending an average of £2,500 per year, and #fty years<br />
without having to #nd a repair bill of more than £50k.<br />
Many of us are so used to appeals for major funds that<br />
this pattern of expenditure may be a surprise.<br />
This erratic requirement for repairs cannot be easy for<br />
churches, many of which are, after all, relatively small<br />
voluntary organisations. When deciding bet<strong>we</strong>en a youth<br />
worker or new toilets or putting aside money for<br />
unknown possible future repairs, it must be tempting to<br />
take the chance that when the next repair bill <strong>do</strong>es come<br />
in a few years’ time it will be one of the smaller rather<br />
than larger ones, and to hope that over the longer term<br />
this church is going to be one of the less expensive ones.<br />
Unfortunately, I have no information as to <strong>how</strong><br />
expenditure is broken <strong>do</strong>wn bet<strong>we</strong>en different classes of<br />
church – urban versus rural, for example, or medieval<br />
compared to Victorian. Urban Victorian churches are said<br />
to be considerably more expensive, but I <strong>do</strong> not have the<br />
data to demonstrate that.<br />
Incentives<br />
In other situations, the occurrence of occasional,<br />
unpredictable, very expensive events is often solved by<br />
pooling risk, through a commercial or governmentfunded<br />
‘insurance’ scheme (two examples are the NHS<br />
and private household insurance). In this case, the grant<br />
agencies provide something similar, but in two different<br />
ways there is ‘moral hazard’.<br />
First, there is no incentive to spend money on routine<br />
maintenance, because grants <strong>do</strong> not depend on having<br />
been careful in this respect.<br />
Secondly, the largest grant-making body (EH/HLF)<br />
reduces grants in line with any repair money previously<br />
put aside, a clear disincentive to save for repair work. This<br />
is not a trivial issue to resolve: in previous years, when the<br />
grants did not take account of savings, it might have been<br />
argued (and probably was – I have not investigated) that<br />
more money was being given to some churches than they<br />
required, and was therefore not being directed to the areas<br />
of greatest need. Possibly some form of taper-relief would<br />
be an appropriate way to enc<strong>our</strong>age saving, whilst<br />
concentrating on the most needy.
30 TREVOR COOPER • HOW DO WE KEEP OUR <strong>PARISH</strong> <strong>CHURCHES</strong>? • 2004 • www.ecclsoc.org<br />
Table 3.2<br />
Major s<strong>our</strong>ces of grants and<br />
similar funds for church repair<br />
(excluding cathedrals), England<br />
and Wales (2002) (some figures<br />
estimated and to be treated with<br />
caution)<br />
Amount granted<br />
S<strong>our</strong>ce of funds £m<br />
EH/HLF/Cadw 21.0<br />
Garfield Weston 3.5<br />
VAT reclaimed 6.0<br />
Landfill *2.0<br />
HCPT 1.5<br />
County Trusts 1.4<br />
Total approx £36m<br />
*The amount received from Landfill is<br />
particularly difficult to ascertain. Some<br />
observers expect it to fall in the near<br />
future.<br />
S<strong>our</strong>ce: HCPT analysis, EH personal<br />
communication<br />
3.3 Where <strong>do</strong>es the repair spend of £86m<br />
per year come from?<br />
Parishes find most of the money<br />
Surprisingly, there is no formal study of where churches<br />
#nd the money to carry out repairs. Ho<strong>we</strong>ver, the Historic<br />
Churches Preservation Trust (HCPT) has recently carried<br />
out some useful analysis, summarized in Table 3.2. Some<br />
of the #gures <strong>we</strong>re not easy to obtain, and are estimates<br />
only, and should be treated with caution.<br />
The total repair spend in 2001 was £86m. Some £36m<br />
of this is estimated to have come from the very large<br />
grant-making bodies. Thus approximately £50m, nearly<br />
60%, is found by the congregations themselves, some (an<br />
Table 3.3<br />
EH/HLF grants to churches (excluding cathedrals) by size<br />
(2002/3)<br />
Size of Grant<br />
Grants of this size<br />
Number % of grants<br />
Amount<br />
(£m)<br />
up to £20k 21 8 0.3<br />
£20k – £40k 52 19 1.5<br />
£40k – £60k 61 23 3.0<br />
£60k – £80k 37 14 2.6<br />
£80k – £100k 23 9 2.0<br />
£100k – £120k 25 9 2.7<br />
£120k – £140k 25 9 3.3<br />
£140k – £160k 7 3 1.0<br />
£160k – £180k 7 3 1.2<br />
£180k – £200k 4 1 0.8<br />
over £200k 8 3 2.3<br />
Total<br />
270 grants<br />
S<strong>our</strong>ce: EH personal communication<br />
100% =<br />
270 grants £20.7m<br />
THE ROCHESTER SCHEME<br />
One model for helping churches help themselves has<br />
been in existence in the diocese of Rochester for over<br />
#fty years. In essence it is a savings scheme. Churches<br />
save routinely, putting aside enough money to pay for<br />
their own foreseeable repairs, based on their<br />
quinquennial inspections. In return for saving regularly,<br />
they receive various bene#ts, such as soft loans for<br />
repairs, a free annual electrical survey, and a free<br />
quinquennial inspection. Parish savings <strong>do</strong> not count as<br />
part of their annual income in assessing their<br />
contribution towards the diocese, so there is no<br />
disincentive to cut back on raising money for the<br />
building.<br />
Current savings average about £2,500 per year per<br />
church building. This is broadly in line with what one<br />
might expect from <strong>our</strong> analysis, which s<strong>how</strong>ed that<br />
parishes #nd about 60% of the cost of repairs<br />
themselves (from their savings in this case), and receive<br />
grants for about 40%.<br />
Although there is no sharing of risk bet<strong>we</strong>en<br />
churches, the scheme <strong>do</strong>es smooth out the cost of<br />
repairs. Would it be worthwhile to review the strengths<br />
and <strong>we</strong>aknesses of this model, with a possible view to<br />
pump-priming more such schemes, perhaps with<br />
signi#cant #nancial incentives?<br />
S<strong>our</strong>ce: diocese of Rochester, personal communication<br />
unknown amount) provided by smaller grant-making<br />
bodies.<br />
The perception of grant-making bodies may be that<br />
they provide a much higher proportion than this. For<br />
example, on average EH/HLF provides around 65% of the<br />
cost of repairs when it makes a grant. 4 But these grants are<br />
mostly for larger projects (Table 3.3). As discussed earlier,<br />
repair spend for most churches in most years is quite<br />
small and below the EH/HLF theoretical threshold (£10k),<br />
and certainly below their practical threshold (almost all<br />
EH/HLF grants are for more than £20k). It is important to<br />
appreciate that grant applications are made to EH/HLF and<br />
to HCPT by the rather small number of churches facing<br />
particularly large bills in any one year.<br />
This probably means that the majority of smaller repairs<br />
are quietly being funded by congregations without<br />
rec<strong>our</strong>se to signi#cant grants. As a s<strong>we</strong>eping statement, <strong>we</strong><br />
Graph 3.1 The total cost per year of all church repairs<br />
above a specified size (2001)<br />
S<strong>our</strong>ce: Table 3.1<br />
Cost of paying for repairs above this<br />
size (£m)<br />
100.0<br />
90.0<br />
80.0<br />
70.0<br />
60.0<br />
50.0<br />
40.0<br />
30.0<br />
20.0<br />
10.0<br />
0.0<br />
86.7 86.0<br />
77.9<br />
67.0<br />
50.0<br />
25.5<br />
0 £1k £5k £10k £20k £50k over<br />
£100k<br />
Size of repair (£k)<br />
9.7
HOW DO WE KEEP OUR <strong>PARISH</strong> <strong>CHURCHES</strong>? • KEEPING CHURCH BUILDINGS IN GOOD REPAIR 31<br />
Table 3.4<br />
English Heritage, grant expenditure, by type of<br />
grant, 2002/3<br />
Grant<br />
Type of grant<br />
expenditure<br />
Secular buildings and monuments 24%<br />
Places of worship grants 19%<br />
Conservation areas 18%<br />
Archaeology 14%<br />
Aggregates Levy Historic<br />
Environment<br />
13%<br />
Heritage Grant Fund 7%<br />
Cathedral grants 5%<br />
TOTAL 100% = £39m<br />
S<strong>our</strong>ce: EH Annual report and accounts, 2002/3<br />
may say that repairs up to £20k (which cost a total of about<br />
£36m), are entirely funded by congregations. Repairs<br />
larger than this cost around £50m, of which about £14m<br />
(roughly one quarter) is found by congregations. 5<br />
As can be seen from Table 3.2, funding from the State is<br />
mainly available in the form of a VAT refund and grants,<br />
totalling an estimated £28m pounds in 2002. As the<br />
Bishop of Lon<strong>do</strong>n has pointed out, for example in the<br />
speech reprinted at the front of this booklet, in #nancial<br />
terms ‘the Church of England is the most disestablished<br />
church in Western Europe’.<br />
What would it cost to fund all repairs? Graph 3.1 s<strong>how</strong>s<br />
the annual cost to a fairy godperson who decided every<br />
year to pay for all repairs above a certain size. For example,<br />
if the fairy decided to fund all repairs costing more than<br />
£20k, then the bill would be some £50m per year.<br />
EH/HLF are the ‘superpo<strong>we</strong>rs’<br />
The largest single provider of grants is English Heritage<br />
with the Heritage Lottery Fund. The jointly administered<br />
EH/HLF grant aid scheme may be regarded as the<br />
Table 3.5<br />
Heritage Lottery Fund, analysis of grants awarded under<br />
grant programmes relevant to regeneration, 1995 – 2003 1<br />
Grant programme<br />
Number<br />
of<br />
projects<br />
Funding<br />
(£m)<br />
%to<br />
deprived<br />
areas 3<br />
Heritage grants 3511 1,600 38%<br />
Parks 394 310 62%<br />
Townscapes 266 99 47%<br />
Places of worship 2 675 61 71%<br />
Total 4846 £2.1bn<br />
Notes<br />
1. Grants awarded by HLF bet<strong>we</strong>en 1 January 1995 and 3 October<br />
2003, except Repair Grants for Places of Worship in England, which are<br />
to April 2003. Monetary values are actual grants awarded and not<br />
Stage 1 offers. HLF has other grant programmes: only those relevant to<br />
regeneration are s<strong>how</strong>n here.<br />
2. Grants to places of worship apply to England only up to 2002 (via the<br />
JPOW scheme), thereafter to the UK (via the RGPOW scheme). For more<br />
details of these schemes, and annual break<strong>do</strong>wns, see Appendix C.<br />
3. Proportion of funding to deprived areas, defined (for England) as<br />
the 50 most deprived local authorities. See text for discussion.<br />
S<strong>our</strong>ce: New Life: Heritage and Regeneration, HLF, 2004. See note 6<br />
below.<br />
‘superpo<strong>we</strong>r’ in this sector, and has been for many years.<br />
These two bodies <strong>do</strong>minate the #eld. Any withdrawal<br />
would have a major impact.<br />
Since 1986/7 (see Appendix C), a period of some<br />
seventeen years, EH with (more recently) HLF have<br />
granted about £313m in today’s money. This is<br />
approximately £1,500 per listed church per year, in today’s<br />
money, when averaged out over all CoE listed churches.<br />
(This average is a simpli#cation, because Grade II<br />
churches have not always been eligible, the HLF money<br />
was for a time targeted on deprived areas, and some grants<br />
are made to non-CoE places of worship.) Assuming that<br />
listed churches have repair bills no higher than unlisted<br />
ones (on which <strong>we</strong> have no reliable information), then in<br />
recent years this s<strong>our</strong>ce of grants has been paying for<br />
about a quarter of repairs to listed churches, which, as <strong>we</strong><br />
have seen, run at an average £5,000 per church per year.<br />
EH/HLF allocate grants on a demand-led basis,<br />
distributing their limited funds according to the level of<br />
applications in an area. The exception was a three-year<br />
period, from April 1999 to March 2002, when HLF grants<br />
(but not EH grants) <strong>we</strong>re focused on deprived areas. As a<br />
result, since 1995 more than £40m (71%) of the £61m<br />
funds which HLF have provided for repairs to places of<br />
worship <strong>we</strong>nt to such areas (Table 3.5). Five of the nine<br />
A VICTORIAN COMPARISON<br />
Bet<strong>we</strong>en 1840 and 1875 more than 7,000 existing parish<br />
churches (many of them medieval) <strong>we</strong>re restored,<br />
repaired or enlarged. This is more than <strong>do</strong>uble the<br />
number of new churches built during that period. This<br />
is the time widely regarded as having brought the bulk<br />
of churches up to excellent physical condition, leaving<br />
them in good shape for the next hundred or more years.<br />
The details are provided in a report of 1876, which<br />
gives the cost of works for nearly 2,200 cases, spread<br />
over t<strong>we</strong>lve dioceses. These have been analysed by<br />
Chris Miele. The average total cost of this repair and<br />
enlargement was £2,400 per church over 35 years, about<br />
£70 per year. Today’s rate of expenditure on repairs alone<br />
(not including enlargement) is £5k per year per church<br />
(on average). In addition <strong>we</strong> spend an additional<br />
amount each year on extending and improving<br />
churches: I suspect this could be half as much again (on<br />
average), making £7,500 per year per church.<br />
How can <strong>we</strong> compare the Victorian with today’s<br />
#gures? One way is to look at the mandays they would<br />
buy. The Victorian £70 would, I think buy about one<br />
manyear of manual lab<strong>our</strong>, very roughly twice what<br />
£7,500 today would buy.<br />
So <strong>we</strong> are probably spending less than the Victorian<br />
#gure. But <strong>we</strong> can perhaps achieve more with less<br />
effort, through the use of technology.<br />
There is one de#nite difference bet<strong>we</strong>en now and<br />
then. A very high proportion of the cost of the Victorian<br />
work was born by rich individuals, with the rather small<br />
remainder made up by parishioners. Today, most (about<br />
60%) of the cost is borne by parishioners and their<br />
fund-raising.<br />
Main s<strong>our</strong>ce: Chris Miele, ‘Their interest and habit’, in The Victorian<br />
Church. See Bibliography.
32 TREVOR COOPER • HOW DO WE KEEP OUR <strong>PARISH</strong> <strong>CHURCHES</strong>? • 2004 • www.ecclsoc.org<br />
regions of England have received about £12m of HLF<br />
grants (East Midlands, East of England, North East, South<br />
East, and South West) and the other f<strong>our</strong> regions have<br />
received the rest, almost £50m. As HLF no longer follow<br />
this policy, future grants are unlikely to s<strong>how</strong> this pattern. 6<br />
Currently, in deciding which grants to accept, EH/HLF<br />
assess applications (amongst other things) according to the<br />
urgency and nature of the repairs, and the #nancial status<br />
of the parish. If further prioritisation is needed, then<br />
regional priorities are considered – preference is given to<br />
geographical areas which have bene#ted less in the past,<br />
and areas of economic or social deprivation.<br />
In the year 2002/3, EH devoted about one #fth (19%) of<br />
its entire grant budget to the repair of places of worship<br />
(Table 3.4); this proportion may be lo<strong>we</strong>r than normal,<br />
due to special circumstances obtaining during the year.<br />
For HLF, the percentage is lo<strong>we</strong>r: since 1995 the<br />
proportion of its regeneration grants devoted to places of<br />
worship has been about 3% (Table 3.5). Both<br />
organisations have made other grants to churches not<br />
included in these #gures, but they would be unlikely to<br />
change the general proportions in a signi#cant way.<br />
In addition to grants, EH devote considerable<br />
management res<strong>our</strong>ce to churches. Not long ago they<br />
appointed a senior member of staff to head up research for<br />
places of worship, and I understand they have recently<br />
created a new post devoted to policy in this area. This is a<br />
signi#cant commitment. Given the very large number of<br />
listed churches, and the homogenous pressures faced by<br />
this type of building, I wonder whether there is a case for<br />
having a single person responsible full-time for overall<br />
policy and practice for places of worship.<br />
Last year’s allocation of EH/HLF funds was oversubscribed<br />
by about a factor of two. 7 This year’s increased<br />
funding has been widely <strong>we</strong>lcomed, though there is some<br />
concern whether matching funds can be found within the<br />
time available (one year); in response, EH/HLF have<br />
EXPERIENCE IN LINCOLNSHIRE<br />
In my village, there are about 200 souls and few of<br />
them, if any, worship at the parish church. It’s a fairly<br />
typical small Lincolnshire church; greenstone, mostly<br />
Perpendicular, a lot of late seventeenth-century repair<br />
work, nothing special about the interior but there’s a<br />
nice f<strong>our</strong>teenth-century monument to a former<br />
incumbent. It has a service about once a month, taking<br />
turn with a group of other parishes.<br />
Its little band of worshippers seem to spend most of<br />
their energy running events at the village hall, raising<br />
funds for the church’s up<strong>keep</strong>...currently they’re<br />
budgeting for disabled access! As a going-concern, it’s a<br />
liability. But what a shame if it disappeared.<br />
Their [the worshippers’] enthusiasm would be better<br />
spent on spreading the gospel...good job for the rest<br />
of us that it isn’t though.<br />
I hate to see this heritage simply eroding away before<br />
<strong>our</strong> eyes. The government’s de#nitely not going to pick<br />
upthebill...sowho?<br />
S<strong>our</strong>ce: posting on Churchcrawler forum <br />
recently extended the take-up period by a couple of<br />
months to provide churches with a little longer to raise the<br />
money (see box, ‘2003 – the year of the grant’).<br />
Multiplicity of grant agencies<br />
According to the Funds for Historic Buildings directory of<br />
grant-giving agencies (), there are 73<br />
bodies which may provide help to church buildings still in<br />
use. This number of grant-making bodies probably adds<br />
$exibility to the system; for example, some of them will<br />
give grants to parishes in dif#culty, or to unlisted<br />
churches, or will have a particular local interest. Despite<br />
this, it has been suggested that it is easier for churches to<br />
#nd money for big projects than for smaller ones.<br />
There is considerable anec<strong>do</strong>tal evidence that the<br />
multiple form-#lling and the variety of dates and<br />
deadlines irritate parishes enormously, and add to the<br />
effort required.<br />
Expertise<br />
In addition to giving grants, both EH and the CoE provide<br />
considerable expertise regarding the physical fabric of<br />
church buildings, and their use both for worship and<br />
other purposes. In the case of EH, this includes signi#cant<br />
expenditure on primary research. In the CoE, in addition<br />
to a dedicated central group, much voluntary time and<br />
effort is put in by experts on the Diocesan Advisory<br />
Committees (DACs).<br />
This is <strong>we</strong>ll outside the scope of this report, but should<br />
not be overlooked.<br />
3.4 How easy is it for congregations to find<br />
their share of repairs?<br />
We have seen that about 40% of the cost of repairs is<br />
provided by grant making bodies, of which more than half<br />
is provided by the EH/HLF scheme. The remaining 60%,<br />
Table 3.6<br />
Proportion of parishes with various ranges of<br />
unrestricted ordinary annual income (2001)<br />
Unrestricted<br />
ordinary<br />
income*<br />
Parishes with this income<br />
% Number<br />
£0 – £1k 1 130<br />
£1k – £2k 2 260<br />
£2k – £5k 9 1150<br />
£5k – £10k 17 2180<br />
£10k – £20k 22 2820<br />
£20k –£30k 13 1670<br />
over £30k 37 4740<br />
100% = 12,951<br />
parishes<br />
12,951<br />
*On average, parishes receive an additional 8% of non-recurring<br />
unrestricted income (s<strong>our</strong>ce: Church Statistics 2001)<br />
S<strong>our</strong>ce: CoE, personal communication
HOW DO WE KEEP OUR <strong>PARISH</strong> <strong>CHURCHES</strong>? • KEEPING CHURCH BUILDINGS IN GOOD REPAIR 33<br />
representing some £50m per year, is found by parishes.<br />
How easy is it for parishes to raise this money?<br />
Parish giving has been rising for many years, despite<br />
membership falling. In the ten years up to 2001, voluntary<br />
income in the parishes rose by 36% in real terms (that is,<br />
after allowing for in$ation).<br />
Nevertheless, as would be expected from the variation<br />
in church membership, parish incomes differ enormously.<br />
About 12% of parishes (about 1500)have unrestricted<br />
ordinary income of less than £5,000 per annum (Table<br />
3.6). Some of these parishes will have more than one<br />
church building. These parishes will not be able to pay the<br />
typical annual repair bill of £2,500 out of their income, let<br />
alone fund the occasional much larger repair. They rely on<br />
grants and special fund-raising.<br />
To <strong>do</strong> this, congregations need to be able both to raise<br />
money directly and also to organise themselves to apply<br />
for grants, liaise with amenity societies and other groups,<br />
and manage the repairs. One limiting factor is therefore<br />
organisational capacity.<br />
To understand the time, energy, commitment and<br />
capabilities required, read ‘The Fabric Of#cer’s Tale’ and<br />
‘2003 – the year of the grant’, in the boxes. One vicar<br />
con#ded to me that one of her two parishes relied on an<br />
85 year old ex-Civil Servant to <strong>do</strong> all the form-#lling and<br />
liaison for repairs, and she didn’t know who would replace<br />
him when he died.<br />
2003 – THE YEAR OF THE GRANT<br />
Urgent work We have two areas of the church roof held<br />
up with scaffolding for fear of collapse. Community<br />
population: just under 1,000. A good share of retired<br />
professional folk, and <strong>we</strong> are <strong>we</strong>ll-organised.<br />
1. Grant awarded by EH mid January 2003. Grant subject<br />
to replacing copper roof-covering with lead. We have to<br />
have all <strong>do</strong>cumentation and the money in place within 12<br />
months to get the Stage 2 grant of approximately £100k.<br />
2. We get moving immediately.<br />
3. The immediate Stage 1 grant from EH covers, amongst<br />
other things, the cost of surveys, an accessibility audit, a<br />
maintenance plan and – crucially – the non-destructive<br />
testing of roof timbers to ensure they can take the added<br />
<strong>we</strong>ight of the lead. Surveyor #nishes his preliminaries by<br />
end March and by mid June the non-destructive testing<br />
specialist contractor has provided the report, which s<strong>how</strong>s<br />
that lead will be OK. He is one of very few people in the<br />
country quali#ed to <strong>do</strong> this work, hence the delay.<br />
4. In the meantime <strong>we</strong> have made applications to all the<br />
major grant-making trusts, and a large number of minor<br />
ones, about #fty in all. All their application procedures are<br />
different. We discover that some of these trusts are not<br />
prepared to consider applications until <strong>we</strong> have an<br />
approved speci#cation and two tenders, which of c<strong>our</strong>se<br />
<strong>we</strong> cannot yet have. So <strong>we</strong> will have to go back to them<br />
after <strong>we</strong> get tenders, and hope their grant-giving timetable<br />
allows them to respond by year end, so that <strong>we</strong> can<br />
demonstrate to EH <strong>we</strong> have got enough money.<br />
5. By accident (through applying to them for a grant) <strong>we</strong><br />
discover that the local authority is unhappy about the<br />
change from copper to lead. They point out that <strong>we</strong> need<br />
planning permission. We make the application to them in<br />
July but they tell us that they are going to #ght us. EH still<br />
insisting that they will not give a grant unless the change<br />
to lead is made.<br />
6. We arrange meetings bet<strong>we</strong>en <strong>our</strong> architect, EH and the<br />
local authority in September. Another meeting in<br />
October. Getting nowhere.<br />
7. A member of <strong>our</strong> congregation visits the diocesan<br />
records of#ce and discovered that the roof had been lead<br />
until 1954. With some dif#culty, <strong>we</strong> persuade the local<br />
authority by this evidence to change their mind (but very<br />
reluctantly and slowly). By now it’s November.<br />
8. We then pull out all the stops – get the speci#cation<br />
drawn up, and approved, and issued, and receive tenders<br />
– all <strong>do</strong>ne by Christmas.<br />
9. A <strong>we</strong>althy member of <strong>our</strong> community has offered to<br />
underwrite with a soft loan the more than £100k de#cit<br />
in <strong>our</strong> fund-raising, so that <strong>we</strong> will be able to prove to<br />
EH that <strong>we</strong> have the money by year-end. Not that <strong>we</strong>’d<br />
even think of claiming the grant and starting work<br />
without the money – imagine the horror of running out<br />
of cash half-way through.<br />
10. Just about to select a contractor – but now EH are<br />
insisting that an old (and untraditional) area of slate on<br />
the south side of the roof must be replaced with lead,<br />
and once again the local authority are arguing.<br />
11. Fortunately EH have given all churches a one-off<br />
extension to the end of February. Will <strong>we</strong> make it? – <strong>we</strong><br />
are praying the latest issue will be resolved before the<br />
end of February, and that <strong>we</strong> <strong>do</strong> not need separate<br />
planning permission for this.<br />
Fund-raising We have been successful at fund-raising,<br />
in that <strong>we</strong> have raised approaching £100k despite not<br />
being able to tell <strong>do</strong>nors exactly what the project will<br />
look like or cost. It’s amusing (mildly) that one of the<br />
major grant-giving bodies cannot hear <strong>our</strong> case until<br />
June 2004 because of the earlier delays – so if <strong>we</strong> are not<br />
ready to go by the end of February <strong>we</strong> lose the EH grant,<br />
but if <strong>we</strong> start work before June this grant-making body<br />
will rule us ineligible.<br />
Ho<strong>we</strong>ver, the costs are higher than the EH original<br />
estimates (total project cost now more than £300k). If<br />
<strong>we</strong> hadn’t had the soft loan, <strong>we</strong> would not have been<br />
able to demonstrate to EH that <strong>we</strong> had the money, and<br />
would have lost <strong>our</strong> EH grant at the end of February.<br />
And <strong>we</strong> will still lose it if <strong>we</strong> can’t get the local authority<br />
to change their mind in the next three <strong>we</strong>eks. If <strong>we</strong> lose<br />
<strong>our</strong> grant, <strong>we</strong> will effectively lose a minimum of<br />
18 months, and the costs will go up again – and with no<br />
guarantee that EH will offer us a grant next time round.<br />
S<strong>our</strong>ce: personal communication, early February 2004
34 TREVOR COOPER • HOW DO WE KEEP OUR <strong>PARISH</strong> <strong>CHURCHES</strong>? • 2004 • www.ecclsoc.org<br />
My #rst sight of the quinquennial report which started it<br />
all was something of a shock. It looked as if <strong>we</strong> <strong>we</strong>re facing<br />
bills of some £40,000, which seemed like an awful lot in<br />
1988. Ho<strong>we</strong>ver <strong>we</strong> <strong>we</strong>re fortunate enough to secure the<br />
services of the late Barry Hastings. It is important to have<br />
an architect who will talk to you, will explain and discuss<br />
and involve the PCC, rather than talk at you and dictate.<br />
Together <strong>we</strong> prioritised all the work that <strong>we</strong> had been told<br />
was necessary. After a while it began to look possible, even<br />
though it appeared that virtually every feature of the<br />
church from the walls, inside and out, to the to<strong>we</strong>r, the<br />
bells, the pews, the wall paintings and the rood screen,<br />
even the lych gate, needed work.<br />
I should say at this point that Edingthorpe itself is tiny<br />
and the church Electoral Roll even tinier, at that stage<br />
about 25 people. But <strong>we</strong> had a relatively large and very<br />
enthusiastic PCC. We discussed at every stage what was<br />
needed and <strong>we</strong> turned fund-raising, so often a drudge,<br />
into fun. It would un<strong>do</strong>ubtedly have been impossible to<br />
approach a task like this without the whole-hearted<br />
voluntary support of the PCC, the congregation and<br />
indeed of the parish as a whole.<br />
It soon became clear that the one factor common to a<br />
lot of the basic problems was damp, aggravated by a<br />
concrete apron which had been built several years before<br />
all around the base of the outside walls of the church. The<br />
problem was that it had shrunk away from the church<br />
over the years, and damp was getting into and being<br />
trapped in the ‘foundations’. The removal of the concrete<br />
and the digging of a french drain has alleviated, though<br />
not cured, the problem.<br />
The rest of this #rst stage of work was largely running<br />
repairs which should have been <strong>do</strong>ne over the preceding<br />
years, wood treatment for beetle etc., and plaster<br />
replacement necessitated by damp. A building like this<br />
never stands still, as it <strong>we</strong>re. Anything that looks as if it<br />
might need to be <strong>do</strong>ne, should be <strong>do</strong>ne as soon as<br />
possible. If put off, it will invariably take longer, be more<br />
complicated and cost more as a result.<br />
The other problem, while <strong>we</strong> are on the subject of<br />
time, is that it takes at least twice as long as one might<br />
expect to get all the permissions, quotations, etc., in place<br />
before work can commence. Couple this with the fact<br />
that, particularly if one is dealing with plaster repairs,<br />
because of the <strong>we</strong>ather there is probably only a six month<br />
win<strong>do</strong>w every year for work to be <strong>do</strong>ne. This is<br />
particularly true if, like us, you are a mile and half from<br />
the coast and the wind is, therefore, salty and damp.<br />
Another limiting factor is the availability of experts.<br />
They <strong>we</strong>re in such demand when <strong>we</strong> needed them that<br />
the process inevitably started running over from year<br />
to year.<br />
The rood screen was a relatively straightforward job,<br />
and the #rst to be <strong>do</strong>ne. At a time when frustrations <strong>we</strong>re<br />
beginning to accumulate, the sight of the screen cleaned,<br />
sensitively restored and #xed, made it quite obvious to all<br />
of us that it was all going to be worth it in the long run!<br />
Talking of frustration, the wall paintings <strong>we</strong>re a case in<br />
point. We had obtained a report on their condition, had<br />
A FABRIC OFFICER’S TALE by Peter Bowles<br />
got English Heritage’s approval for treatment, and had<br />
nearly all the money in place. Then I decided to<br />
approach a Trust in Lon<strong>do</strong>n who funded projects like<br />
this, just to make sure <strong>we</strong> had enough money. They<br />
<strong>we</strong>re very helpful, but wanted a report from an<br />
academic institution, which when it came through said<br />
almost exactly the opposite of the report <strong>we</strong> already had.<br />
On the one side the practical folk, on the other the<br />
academics; on the one side the non-interventionists, on<br />
the other, those who could see the necessity of a certain<br />
amount of intervention. We <strong>we</strong>re tossed back and forth<br />
for over two years, during which time the paintings<br />
<strong>we</strong>re visibly deteriorating, and <strong>we</strong> <strong>we</strong>re trying to please<br />
everyone. We only ever got anything <strong>do</strong>ne, because it<br />
#nally occurred to us that, since <strong>we</strong> had accepted their<br />
aid before, <strong>we</strong> had to get English Heritage’s approval for<br />
this work too, although they <strong>we</strong>re not actually funding<br />
it. [This condition is no longer being imposed. TC]. Therefore<br />
the only opinion that mattered, in practice, was<br />
theirs.<br />
So <strong>we</strong> eventually <strong>we</strong>nt ahead with almost exactly<br />
what <strong>we</strong> had intended in the #rst place. The paintings<br />
<strong>we</strong>re cleaned and #xed to the wall, from which they<br />
<strong>we</strong>re becoming separated due to damp getting in<br />
bet<strong>we</strong>en the $ints outside and a wax coating inside. At<br />
the same time <strong>we</strong> undertook a search for more paintings<br />
on the other walls; it was, I have to admit, with some<br />
relief as <strong>we</strong>ll as a little sadness that <strong>we</strong> heard that it<br />
seemed there <strong>we</strong>re none.<br />
All this time, an incredible (and invisible) job was<br />
being <strong>do</strong>ne restoring the pews as <strong>we</strong>ll as making a new<br />
North <strong>do</strong>or. The old one had gradually been eaten away<br />
from the bottom up by damp and <strong>we</strong> felt that after more<br />
than 500 years, it deserved an hon<strong>our</strong>able retirement.<br />
While the pews <strong>we</strong>re away, the plaster had to be<br />
replaced to win<strong>do</strong>w-sill level on the north side and on a<br />
large part of the <strong>we</strong>st wall. I had a very nervoussounding<br />
call from the builders, saying they thought I<br />
had better come and look – a euphemism for “you<br />
ought to hurry, because there might not be a <strong>we</strong>st wall<br />
here for long!” They had found a crack, starting at roof<br />
level at about two feet wide and tapering <strong>do</strong>wn to<br />
nothing about six feet from the $oor. It was full of dead<br />
mortar and old $ints. The whole thing needed clearing<br />
out and rebuilding and then back-#lling with grout.<br />
Anyway, after #fteen years or so, close on £100,000<br />
raised and spent, <strong>we</strong> are <strong>do</strong>ne with the major works.<br />
The #rst impression on entering the church now is that<br />
it is in good heart for succeeding generations of Fabric<br />
Of#cers and that, I suppose, would have been my target<br />
if I had had time to think about targets all those years<br />
ago. But then, if I had had time to think about it all, I’d<br />
probably never have taken it on anyway! To all of those<br />
who <strong>we</strong>re involved with the work on All Saints,<br />
Edingthorpe go my undying thanks and admiration.<br />
S<strong>our</strong>ce: abbreviated from an original article in the Round To<strong>we</strong>r, Vol.<br />
XXX No.4 (June 2003), by kind permission. The Round To<strong>we</strong>r<br />
Churches <strong>Society</strong> may be visited at .
HOW DO WE KEEP OUR <strong>PARISH</strong> <strong>CHURCHES</strong>? • KEEPING CHURCH BUILDINGS IN GOOD REPAIR 35<br />
AN IMPORTANT VICTORIAN CHURCH<br />
Recently I paid my #rst visit to a <strong>we</strong>ll-known<br />
nineteenth-century church, built by a famous architect.<br />
It is a stunning building.<br />
It is also large. Far, far larger than the typical Sunday<br />
congregation of about 25 actually needs. In fact, the<br />
building has not been anything like full on Sundays for<br />
at least #fty years. It may never have been.<br />
Over the last decade or so, large sums of money have<br />
been spent on it, totalling somewhere in the very high<br />
six #gures. Another six #gure sum is now required.<br />
What should <strong>we</strong> <strong>do</strong> with the building? It has<br />
wonderful acoustics: but concerts <strong>do</strong> not draw<br />
suf#ciently large attendances to make them worthwhile.<br />
Thought is being given to creating a meeting room by<br />
enclosing a space at the <strong>we</strong>st end. Will this spoil the<br />
interior?–Iamnotquali#ed to say. It may indeed be<br />
the best solution, providing a useful space for local folk<br />
whilst helping <strong>keep</strong> the building alive.<br />
But I am left with the feeling that for buildings of this<br />
importance <strong>we</strong> need different mechanisms, which will<br />
allow the congregation to continue worshipping there<br />
without pretending that they are going to be able to<br />
maintain the building themselves; and will, perhaps,<br />
make more of the potential to attract visitors.<br />
Trevor Cooper<br />
It seems likely that, on average, small congregations will<br />
be the ones which are least able to raise funds for large<br />
repairs, or to carry out routine maintenance.<br />
In addition, the smaller the congregation, the more<br />
likely they are to have to share clergy with other<br />
congregations, diluting an important s<strong>our</strong>ce of leadership.<br />
Looking at the rural situation, in 1994 more than one<br />
third (36%) of very small rural communities – those with<br />
fe<strong>we</strong>r than 200 inhabitants – had a vicar who looked after<br />
#ve or more churches (Table 3.7). Overall, I estimate that<br />
there <strong>we</strong>re approximately 1,700 rural communities in<br />
England sharing their vicar with at least f<strong>our</strong> other<br />
churches. Since then the number of clergy has dropped<br />
faster than the number of church buildings, so there are<br />
presumably even more clergy and churches in this<br />
situation today.<br />
The clergy in this position will have less time to devote<br />
to each of their church buildings. In one study, <strong>do</strong>ne in<br />
Table 3.7<br />
Number of rural churches with vicar who has care of five or<br />
more churches, by population of community (1994)<br />
Churches with vicar caring<br />
Population of community for five or more churches<br />
% Number<br />
Up to 200 36 590<br />
200–399 27 550<br />
400–899 17 390<br />
900–3000 8 180<br />
Overall 21 Total =<br />
1700<br />
S<strong>our</strong>ce: Francis and Martineau, Rural Mission, Table 3. For number of<br />
churches, see Appendix E.<br />
FINANCIAL PRESSURES ON <strong>PARISH</strong>ES<br />
These are quotes from churches responding to Jeremy Eckstein’s<br />
questionnaire, undertaken as research for his 2001 report. These<br />
have been selected as representative of those churches #nding it<br />
dif#cult to fund all recommended repairs. Each of these cases<br />
represents a set of worries for real people looking after a historic<br />
building with inadequate funds. We <strong>do</strong> not know what<br />
proportion of churches found themselves in this position.<br />
• Work on guttering and <strong>do</strong>wnpipes was not attended<br />
to, mainly because of unanticipated need for<br />
re-wiring, heating and lighting (£10,000) and<br />
redecorating (£8,000).<br />
• No major work was identi#ed as being required.<br />
Ho<strong>we</strong>ver there is currently a requirement for £15,000<br />
for organ repairs, £11,000 for re-wiring and £6,000<br />
for stonework on gables – £32,000 in all, for which<br />
<strong>we</strong> have available funds amounting to £12,000.<br />
• Following massive water penetration, work was<br />
carried out to repair/replace sections of roof, at a total<br />
cost of £12,000 – of which £8,500 was raised locally.<br />
Medium plan is now to carry on improving water<br />
run-off/roof. Funding is now a problem, as total cost<br />
was estimated at £50,000 and grant-aid is no longer<br />
available. We are trying to complete fund-raising for a<br />
new hall, so efforts to continue with repairs will have<br />
to cease until that is <strong>do</strong>ne.<br />
• [After a major fund-raising initiative for urgent<br />
repairs.] The fund-raising team was exhausted by the<br />
end of Phase II, and <strong>we</strong>re given #ve years to<br />
recuperate and enjoy what they had achieved.<br />
S<strong>our</strong>ce: Eckstein (2001)<br />
1989, about 150 multi-church clergy <strong>we</strong>re asked to list up<br />
to #ve disadvantages of having multiple church buildings.<br />
Unprompted, more than half mentioned the pressures of<br />
looking after several buildings, often Grade I, and the<br />
associated #nancial strains. “Fabric takes a<br />
disproportionate time,” complained one minister. Another<br />
said that one result of having many church building was<br />
that it meant “getting to know a lot of architects” ! 8<br />
Furthermore, one third of rural vicars (32%) are aged<br />
over sixty (1994 study), and this may also have an impact<br />
on the energy they are able to devote to organising<br />
large-scale, long-term fund-raising and church repairs<br />
(though the opposite might also be true: their experience<br />
may mean they #nd the process less of a struggle). 9<br />
In the light of these considerations, I was somewhat<br />
surprised by my analysis of last year’s grants by EH/HLF to<br />
small rural congregations. I found that grants <strong>we</strong>re awarded<br />
to smaller rural communities in more or less the same<br />
proportion as those communities occur. That is, small<br />
communities <strong>we</strong>re not under-represented. I have not had<br />
the opportunity to analyse grant requests, to see if they<br />
s<strong>how</strong> the same pattern. It is possible that they are<br />
under-represented in applications, but that they are more<br />
likely to make it through the selection process, which<br />
allows for urgency and #nancial need.<br />
These problems are not limited to rural churches, but<br />
similar data for urban churches is less easily available. We<br />
badly need a review of the dif#culties which parishes of all
36 TREVOR COOPER • HOW DO WE KEEP OUR <strong>PARISH</strong> <strong>CHURCHES</strong>? • 2004 • www.ecclsoc.org<br />
A VIEW FROM THE WELSH BORDER<br />
Our small town in the Welsh Marches used to support a<br />
church and three chapels. Now just one chapel and the<br />
parish church are left, and both have dwindling, ageing<br />
populations. The church’s grandeur delights t<strong>our</strong>ists,<br />
but imposes burdens, not only in monetary terms but in<br />
administration and time, that regular worshippers<br />
cannot meet.<br />
The town is by no means home just to the retired; it<br />
has as many young families, as many teenagers, and as<br />
many primary school children as ever. The church’s<br />
mission and ministry in the town is as vital as ever, but<br />
who is to ful#l it except the same people who are<br />
already carrying the burden of the building? If <strong>we</strong> had to<br />
choose, <strong>we</strong> should probably opt to dispose of the<br />
building and put <strong>our</strong> effort into the mission; but the<br />
town would see that as culpable betrayal. It values its<br />
church building – provided it is kept open by somebody<br />
else; the church’s mission is harder to appreciate.<br />
Our salvation in both material and mission terms<br />
may be the growing tide of newcomers now discovering<br />
the Marches as a fashionable place to live. It will be<br />
touch and go whether <strong>we</strong> last long enough to reap the<br />
bene#t.<br />
S<strong>our</strong>ce: personal communication<br />
shapes and sizes face in #nding money, both through their<br />
own circumstances and the complexities of liaising with<br />
multiple agencies with different timetables.<br />
There is, incidentally, no central s<strong>our</strong>ce which churches<br />
can turn to for fund-raising or steering the overall process<br />
of applying for grants and managing building work,<br />
though dioceses are often willing to provide informal<br />
advice, and some dioceses provide assistance to churches<br />
which need help planning for the future. In particular, EH<br />
and the CoE are jointly funding dedicated posts in Lon<strong>do</strong>n<br />
and Manchester dioceses, to help congregations develop<br />
and put into practice a medium and long-term plan,<br />
including fund-raising. In Lon<strong>do</strong>n diocese, for example,<br />
more than t<strong>we</strong>nty churches are in various stages of<br />
receiving such assistance and there are an approximately<br />
equal number who would also value help, but cannot yet<br />
be accommodated. Similar posts in other dioceses may be<br />
being considered.<br />
In summary, the typical repair spend averages £2,500<br />
per year, but occasional very much larger sums make the<br />
overall average about <strong>do</strong>uble this, at £5,000 per year.<br />
About 60% of this is found by the parishes themselves,<br />
and by their direct fund-raising. To put this in context,<br />
about 1500 parishes have annual income of less than<br />
£5,000. These churches may rely particularly heavily on<br />
external funds, yet may also be the ones which #nd it<br />
hardest to organise themselves through the process of<br />
applying for grants and seeing through repairs.<br />
Fifty years ago churches <strong>we</strong>re in poor repair after the<br />
war, and the problem to be solved was primarily a<br />
#nancial one. 10 Today, there is signi#cant money available,<br />
and churches are in much better condition, though<br />
continually needing repairs to <strong>keep</strong> them that in that state.<br />
The shortage, in some churches, is of people.<br />
REPAIRING ST CHAD’S, KYNNERSLEY<br />
When the quinquennial inspection found much of<br />
St Chad’s Church, Kynnersley, in need of repair, the<br />
PCC faced a £130,000 bill. The church is t<strong>we</strong>lfthcentury<br />
but, with its circular graveyard, could have<br />
Saxon origins. Kynnersley is a farming village in the<br />
Wealds of Lich#eld diocese, with no more than 60<br />
households, and the congregation was <strong>do</strong>wn to f<strong>our</strong>.<br />
There is no pub, shop or surgery, and everybody shops<br />
in the nearby towns.<br />
The Rector, the Revd William Ward, tells me he<br />
played the devil’s advocate with his PCC, asking <strong>how</strong><br />
they could justify <strong>keep</strong>ing the church open. But the PCC<br />
<strong>we</strong>re adamant, and the village determined to <strong>keep</strong> their<br />
church and its hall as their only public buildings.<br />
Members of the PCC called on every household and<br />
received regular <strong>we</strong>ekly or monthly pledges amounting<br />
to nearly £4,000 a year, “enough to pay <strong>our</strong> bills”. Then<br />
they started serious fund-raising with auctions, pudding<br />
evenings, sponsored walks and calendars, and raised<br />
such a respectable £30,000 that English Heritage<br />
chipped in with 75% of the total cost.<br />
The new Bishop of Lich#eld, the Revd Jonathan<br />
Gledhill, has just been to re-open the church, packed to<br />
bursting point by villagers and members of Mr Ward’s<br />
other #ve churches. The regular congregation has gone<br />
up to eleven, and there are more plans to open up St<br />
Chad’s for use by the community.<br />
S<strong>our</strong>ce: extracted by kind permission from the Church Times, 19/26<br />
December 2003<br />
Churches <strong>do</strong> not exist in isolation, but have a signi#cant<br />
role in the wider community. The next section looks at<br />
this, and at the part that church buildings play.<br />
Notes<br />
1. A Future for Church Buildings, derived from table page 35. During<br />
each of the previous few years, the #gure was very similar (CoE,<br />
personal communication). In a given diocese the average amount<br />
spent on repairs per church can $uctuate from year to year.<br />
Statistical analysis of the data for f<strong>our</strong> years, which I was kindly<br />
allo<strong>we</strong>d to inspect, suggests that much or all of this variation may be<br />
due to ran<strong>do</strong>mness, because very expensive repairs occur<br />
unpredictably, and have a large in$uence on the diocesan average.<br />
Thus the single year’s #gures published in A Future for Church<br />
Buildings should not be used to compare individual dioceses.<br />
2. Claridge, Survey, pages 14 and 10 (Table 7).<br />
3. Anon. [J. M. Neale], A Few Words to Churchwardens..., 8th edition<br />
(Cambridge, 1846), page 6, republished in Christopher Webster<br />
(ed.), ‘temples...worthy of His presence’: the Early Publications of the<br />
Cambridge Camden <strong>Society</strong> (Reading, 2003, ISBN 0954361520); The<br />
Preservation of <strong>our</strong> Churches, pages 61–4.<br />
4. EH, personal communication.<br />
5. This split is in broad correspondence with an analysis of 273 grant<br />
applications analysed by the HCPT, for repair work averaging £100k<br />
per church (HCPT, presentation to County Trusts, 8 May 2003).<br />
6. HLF, New Life: Heritage and Regeneration (n.d. [2004]), available on<br />
.<br />
7. EH, personal communication.<br />
8. Peter Brierley, More than One Church (MARC Monograph<br />
Number 27, MARC Europe, Lon<strong>do</strong>n, 1989) (now published by<br />
Christian Research, Eltham, Lon<strong>do</strong>n). This reports a self-selected<br />
survey of 155 ministers responsible for 585 churches.<br />
9. Francis and Martineau, Rural Mission, Table 3.<br />
10. The Preservation of <strong>our</strong> Churches, passim.
37<br />
4. Using church buildings<br />
4.1 Not just for worship?<br />
Uses other than worship<br />
In this section <strong>we</strong> discuss the use of churches for purposes<br />
other than public worship. This has implications for the<br />
facilities which the building needs to provide, and the<br />
income which it can generate. It also raises questions<br />
about the mission of the church, but these are <strong>we</strong>ll outside<br />
<strong>our</strong> scope.<br />
There is a wide range of possible uses to which church<br />
buildings can be put, as can be seen from the examples in<br />
the box on page 42 and <strong>our</strong> cover photographs. At one end<br />
of the spectrum, a major conversion may be required.<br />
Typically the shell of the building will be retained, but the<br />
interior partitioned off for multiple uses, such as of#ces or<br />
a café, including a space reserved for worship. Quite often<br />
this involves the introduction of another storey into the<br />
building.<br />
Sometimes the scheme will include the leasing out of<br />
space to unrelated third parties on a continuous, day-in,<br />
day-out, basis. There may be legal and procedural<br />
complications in this area, to <strong>do</strong> with the need to make the<br />
church building partially redundant, required when some<br />
of the building is to be used for a purpose which ‘con$icts<br />
with the sacred uses implied by consecration’. 1 It is hoped<br />
these dif#culties will be at least partly resolved in the<br />
relatively near future (it is outside my scope to go into<br />
details: as I understand it, in broad terms the proposal is to<br />
allow part of the building to be leased for such purposes,<br />
provided the primary use of the building remains<br />
ecclesiastical). This may <strong>we</strong>ll enc<strong>our</strong>age more churches to<br />
convert part of their buildings for long-term occupation<br />
by others: indeed, if I <strong>we</strong>re to revisit the subject of this<br />
paper in ten years time, I would expect to #nd churches<br />
up and <strong>do</strong>wn the country leasing out part of their space.<br />
Other schemes are equally substantial, but because the<br />
new uses are part of the mission of the church, permission<br />
for relatively complex structural changes can be obtained<br />
without going through a process of partial redundancy.<br />
At the simpler end of the spectrum – and much more<br />
commonly – there are changes such as the provision of<br />
basic catering facilities in the church (e.g. at the rear of the<br />
nave); the opening up of space by removing pews (often at<br />
the rear or in an aisle); the use of screens to create new<br />
rooms (for example, enclosing a transept); or the building<br />
of an extension, attached or unattached.<br />
Not only <strong>do</strong>es this type of change allow worshippers to<br />
congregate more easily after the service (outside the scope<br />
of this section), but also allows the church building to be<br />
used for a wider variety of purposes, such as a mother and<br />
toddlers group or occasional concerts. Some churches<br />
have been more imaginative: one holds a regular Farmers’<br />
Market in the nave of the church building, and another<br />
has a village shop in the vestry.<br />
Our focus is on the church building. The use of church<br />
halls and other ancillary space is outside <strong>our</strong> scope, though<br />
Table 4.1<br />
Attitudes towards local church/chapel<br />
(adults, Great Britain, October 2003)<br />
Should be used for activities other<br />
75%<br />
than worship<br />
Should be social meeting place 68%<br />
Concerned if no longer there 63%<br />
Should be funded by central taxation / national 42%<br />
government<br />
Believe (wrongly) central taxation / national<br />
23%<br />
government currently assist funding<br />
S<strong>our</strong>ce: CoE, from ORB survey carried out on behalf of EH and CoE,<br />
October 2003. Sample size: 1004. See Bibliography.<br />
I should say that there is plenty of anec<strong>do</strong>tal evidence that<br />
income from these premises is important to churches. It<br />
seems, too, that in many cases these halls are near the end<br />
of their life, and the sites are being sold by churches to<br />
release the capital, or are being renovated under a shared<br />
scheme. I have not looked into any of this, though it is<br />
probably an important aspect of churches’ #nances.<br />
Public attitudes<br />
Public attitudes appear to support the social use of church<br />
buildings. More than one half (56%) of adults in Britain<br />
already think of their local church or chapel as a social or<br />
community venue (Table 6.3). Three-quarters (75%, see<br />
Table 4.1) think it should be used for activities other than<br />
worship.<br />
Indeed one in six adults (17%) attended a concert or<br />
theatrical performance in a place of worship last year<br />
(Table 2.5). That is approximately eight million people,<br />
roughly the same number of UK residents who attend<br />
performances in Lon<strong>do</strong>n’s West End (foreign t<strong>our</strong>ists add<br />
another three or f<strong>our</strong> million). 2 If there <strong>we</strong>re, say, 150<br />
people at each concert, this might imply that churches are<br />
hosting more than 50,000 such events per year.<br />
STOCKHOLM<br />
In Stockholm it was a delight to #nd most churches<br />
open, often with a small open-plan of#ce area with<br />
computer and phone manned by members of the<br />
congregation or students. In return for this free of#ce<br />
space, people sold postcards and ans<strong>we</strong>red queries from<br />
visitors and took messages for the clergy. It is a bit odd<br />
to hear a phone ring inside a church but better that than<br />
being locked up six days out of seven. Every Stockholm<br />
church I <strong>we</strong>nt in had at least one other person in it, and<br />
often many more. People with armloads of shopping sat<br />
<strong>do</strong>wn for #ve minutes, taking a break from the retail<br />
experience.<br />
S<strong>our</strong>ce: personal communication
38 TREVOR COOPER • HOW DO WE KEEP OUR <strong>PARISH</strong> <strong>CHURCHES</strong>? • 2004 • www.ecclsoc.org<br />
4.2 Simple additional uses<br />
Churches in rural areas<br />
To understand the way in which churches are used in<br />
rural areas <strong>we</strong> are fortunate to have the Rural Churches<br />
Survey, reported in the book Rural Mission. This survey<br />
was carried out in 1994, and looked at a sample of nearly<br />
1000 communities with populations of 3000 or less.<br />
Although some of its #ndings may have drifted out of<br />
date, its coverage is, I think, unique, and it makes an<br />
invaluable contribution towards understanding what is<br />
happening to rural church buildings. More about this<br />
survey, and some detailed #ndings, will be found in<br />
Appendix E.<br />
The survey con#rmed that there is a high level of social<br />
and community involvement by Anglican rural churches.<br />
For example, one in f<strong>our</strong> (26%) rural communities had<br />
some form of children’s group for the under t<strong>we</strong>lves run<br />
by the local CoE church, considerably higher than secular<br />
provision in this area (see Appendix E for details).<br />
Ho<strong>we</strong>ver, much of this activity would not take place in the<br />
church building, and for <strong>our</strong> purposes is therefore not<br />
strictly relevant.<br />
In common with other research, the survey found that<br />
rural church buildings themselves are commonly used for<br />
non-religious community purposes. The most common<br />
such use is for musical entertainment, which take place in<br />
almost half (49%) of rural church buildings (Table 4.2).<br />
This implies that up and <strong>do</strong>wn the country there are<br />
approximately 4,000 rural church buildings being used to<br />
host musical occasions.<br />
Even in very small parishes, those with fe<strong>we</strong>r than 200<br />
inhabitants, one quarter (26%) of church buildings hosted<br />
musical entertainment (Appendix E). The #gure rises to<br />
nearly two-thirds (62%) of church buildings in larger rural<br />
communities, those bet<strong>we</strong>en 900 and 3000 strong.<br />
Table 4.2<br />
Number of rural church buildings used for specific<br />
community-related activities (1994)<br />
% Number<br />
Musical entertainment 49 4000<br />
Dramatic performances 12 990<br />
Art exhibition 12 940<br />
Coffee mornings 7 610<br />
Evening social activities 7 570<br />
T<strong>our</strong>ist information 6 460<br />
S<strong>our</strong>ce: Francis & Martineau, Rural Mission, Table 20. For number<br />
of buildings, see Appendix E.<br />
Despite this wide use of rural church buildings, a<br />
signi#cant number did not have adequate facilities<br />
(Graph 4.1). Only about six out of ten (64%) reckoned to<br />
have adequate heating, and eight out of ten (80%)<br />
adequate lighting. In the very smallest rural communities,<br />
the #gures are lo<strong>we</strong>r (48% and 68%). As for toilets, only a<br />
quarter of church buildings overall (24%) had accessible<br />
toilets – in the smallest communities, hardly one out of<br />
ten (9%). In even the largest rural communities (bet<strong>we</strong>en<br />
900 and 3000 inhabitants), only one half of church<br />
buildings (46%) had toilets. Interestingly, more churches<br />
had facilities for hot drinks than had toilets, f<strong>our</strong> out of ten<br />
(43%) overall.<br />
The churches are not standing still. Within the #ve<br />
years prior to the survey, rather more than one in ten rural<br />
churches had upgraded their heating or lighting systems<br />
(16% and 12% respectively; see Table 4.3). Far fe<strong>we</strong>r,<br />
about one in t<strong>we</strong>nty, had provided social space inside the<br />
church or removed pews (6% in each case, quite possibly<br />
the same churches responding positively to both<br />
questions).<br />
Graph 4.1 Percentage of rural<br />
church buildings providing<br />
specified facilities, by community<br />
population (1994)<br />
S<strong>our</strong>ce: Francis and Martineau, Rural<br />
mission, Table 17. The calculation of the<br />
average is discussed in Appendix E.
HOW DO WE KEEP OUR <strong>PARISH</strong> <strong>CHURCHES</strong>? • USING CHURCH BUILDINGS 39<br />
TOILET PROBLEM SOLVED...<br />
One of the problems using village churches [for<br />
performances] is that there are no toilets. I have solved<br />
this problem by erecting a 6ft by 4ft shed in the<br />
churchyard, the sort of shed in which a mo<strong>we</strong>r could be<br />
stored. In it there is an Elsan and washing facilities.<br />
Total cost £150. It has been a great success...<br />
. . . BUT OTHER DIFFICULTIES REMAIN<br />
‘puddles and mud, cold church, hard seats’<br />
‘in the middle of nowhere’<br />
‘lighting poor, heating very expensive’<br />
‘no loos, no kitchen or water, no electricity’<br />
‘not easily lent to other uses; remote, large,<br />
cold, draughty’<br />
S<strong>our</strong>ce: Diocese of Norwich, Church Buildings<br />
The survey <strong>do</strong>es not appear to have asked general<br />
questions about extensions to the church building. But it<br />
<strong>do</strong>es establish that fe<strong>we</strong>r than one in thirty (3%) had<br />
provided toilets or a kitchen in the last #ve years. At this<br />
rate of progress, it will be the end of this century before<br />
every rural church building has a toilet.<br />
Churches in smaller communities had made fe<strong>we</strong>r<br />
improvements than those in larger communities (for<br />
details, see Appendix E), probably because of more limited<br />
res<strong>our</strong>ces. Church buildings in smaller communities start<br />
with less, and are adding less.<br />
Of c<strong>our</strong>se, church halls and village halls may already<br />
provide facilities (toilets, kitchen, a meeting place), though<br />
often these are physically some distance from the church<br />
building, a major point of difference bet<strong>we</strong>en CoE church<br />
buildings and those of other denominations. But in rural<br />
communities with populations less than 3000, more than<br />
eight out of ten churches (82%) did not have church halls<br />
(Table 4.4). In the smaller communities, there was very<br />
often not a village hall either. (The data in Table 4.4 is in<br />
broad agreement with the more recent #gures published<br />
by the Countryside Agency, though they did not<br />
distinguish bet<strong>we</strong>en village and church halls.) 3<br />
What is the level of unsatis#ed demand for this type of<br />
conversion? It seems, from the evidence available, that<br />
Table 4.4<br />
Number of rural communities lacking halls, by population<br />
of community (1994)<br />
Community<br />
Lack<br />
village hall<br />
Lack<br />
church hall<br />
Population No. % No. % No.<br />
under 200 1600 59 960 92 1500<br />
200–399 2000 29 590 88 1800<br />
400–899 2300 15 340 83 1900<br />
900–3000 2200 18 400 68 1500<br />
overall 8100 28 2300 82 6700<br />
S<strong>our</strong>ce: Francis & Martineau, Rural Mission, Table 8. For number of<br />
communities, see Appendix E.<br />
parishes <strong>do</strong> wish to enhance the facilities in their church<br />
buildings, perhaps in considerable numbers. In the<br />
diocese of Chelmsford, for example, more than 80<br />
parishes (of 530) have already (2003) made improvements<br />
to their church building (not counting the t<strong>we</strong>nty or so<br />
major redevelopments of church premises). Table 4.5<br />
gives a break<strong>do</strong>wn of the some of the changes which have<br />
been made ‘in recent times’: nearly 50 are extensions to<br />
the church building, more than t<strong>we</strong>nty have created social<br />
or functional space within the building, and another eight<br />
involve detached premises of one sort or another. Even so,<br />
as discussed in Section 5.3, in this diocese a further 30<br />
parishes have plans to improve their church buildings, and<br />
about one third of the remaining parishes (approximately<br />
200), are looking forward in general terms to further<br />
development and use of their building.<br />
It has been said that ‘to adapt a church to provide toilets,<br />
heating, kitchens and meeting spaces costs about<br />
20%–25% of the cost of building a new village hall’, so in<br />
many villages such expenditure <strong>do</strong>es provide good value,<br />
though heritage considerations can be an issue. 4 It is<br />
notable that the one-off, millennium ‘Rural Churches in<br />
Community Service’ scheme, which provided grants to<br />
100 churches to adapt their premises for community use,<br />
was very signi#cantly oversubscribed. In this case,<br />
fund-raising by the churches themselves tripled the base<br />
funding from £2.5m to £7.5m. 5 (See box on page 42 for<br />
Table 4.3<br />
Number of rural church buildings where<br />
specified changes have been initiated ‘within the<br />
past five years’ (1994)<br />
% Number<br />
New heating system 16 1300<br />
New lighting system 12 1000<br />
New organ 8 660<br />
Removal of pews 6 520<br />
Repositioning of altar 6 490<br />
Social space inside church 6 450<br />
Provision of toilet 3 240<br />
Provision of kitchen 3 220<br />
Access for disabled 2 190<br />
S<strong>our</strong>ce: Francis & Martineau, Rural Mission, Table 18. For<br />
number of buildings, see Appendix E.<br />
Table 4.5<br />
Diocese of Chelmsford: number of church schemes<br />
implemented ‘in recent times’, by type (published 2002)<br />
Internal 21<br />
Part of church screened off 10<br />
Major reordering / new room / kitchen 9<br />
Gallery 2<br />
Extension 49<br />
Small 5<br />
Typical size 31<br />
Large 10<br />
Larger than church 3<br />
Detached building 8<br />
Other solution (e.g. buying adjacent building) 5<br />
TOTAL 83<br />
S<strong>our</strong>ce: The Changing Church, appendix
40 TREVOR COOPER • HOW DO WE KEEP OUR <strong>PARISH</strong> <strong>CHURCHES</strong>? • 2004 • www.ecclsoc.org<br />
SPEAKER IN GENERAL SYNOD<br />
“Our church buildings are often the only public<br />
building now left in the smaller villages, apart from<br />
woefully inadequate village halls. Let us be willing to<br />
take the pews out and replace them with chairs, if<br />
necessary, so that the building can be used for a variety<br />
of purposes.” (Applause.)<br />
S<strong>our</strong>ce: Debate in General Synod on the countryside, July 2001<br />
GOVERNMENT WHITE PAPER<br />
Around a third of all villages have no shop and the loss<br />
of banks, garages and pubs in rural areas has<br />
continued....<br />
The future – what <strong>we</strong> want to see . . . Community<br />
initiative to share use of village facilities, such as the<br />
church, school, hall or pub, and to re-establish basic<br />
services....Weareacting to support the community<br />
role of churches in rural areas.<br />
S<strong>our</strong>ce: Our Countryside, the Future (Government White Paper, 2000)<br />
at <br />
THE ARCHDEACON OF MANCHESTER<br />
Church buildings used to be the focus for fairs and<br />
festivals but in the last two centuries they’ve been used<br />
more exclusively for worship. I think the pendulum is<br />
swinging back.<br />
S<strong>our</strong>ce: <strong>we</strong>bsite of the diocese of Manchester, November 2003, at<br />
<br />
an example, Holy Trinity, Haddenham.) If a similar core<br />
grant <strong>we</strong>re again made available to (say) one half of the<br />
8,000 rural church buildings, the cost would be less than<br />
£100m.<br />
One feature of rural church life is its overlap with other<br />
activities. As pointed out in a recent report, Angels and<br />
Advocates: 6<br />
In the countryside, churches may often be more central to<br />
the community than in the towns, but church social action<br />
may be less obvious. This is because in smaller<br />
communities churchgoers are more likely to join up with<br />
other local people in joint social action (often using church<br />
premises), rather than in separate church-run activity.<br />
None the less, the amount of church-run activity may be<br />
extensive.<br />
The question left in my mind is whether this $uidity<br />
makes it harder to achieve the changes to rural church<br />
buildings for social purposes which might be desired by<br />
those involved? Or easier?<br />
Urban churches<br />
I have not located an equivalent survey to the Rural<br />
Churches Survey to provide an overview of facilities<br />
provided by urban CoE church buildings. It is therefore<br />
dif#cult to obtain an overview across the country,<br />
particularly as it is the places where new things are<br />
happening which get written up, and this may give an<br />
exaggerated idea of their frequency.<br />
Ho<strong>we</strong>ver, systematic research carried out by churches<br />
in greater Norwich and Hull probably gives a fair idea of<br />
the facilities provided by urban churches, though in Hull,<br />
at least, only a handful of these are historic buildings (see<br />
box page 41.) 7 Facilities are generally reasonable, as can be<br />
seen from Table 4.6. Some of these facilities will be on<br />
site, perhaps part of the fabric of the church building itself,<br />
and some will be on separate premises. In Norwich, of the<br />
55 (out of 60) churches of various denominations which<br />
responded to the survey, 34 have rooms and space<br />
available for hire, and the total number of rooms available<br />
is 189, roughly three per church. Rooms for hire provide a<br />
signi#cant community res<strong>our</strong>ce, and a s<strong>our</strong>ce of income<br />
for the church.<br />
Churches in Norwich <strong>do</strong> a good deal of community<br />
work, as s<strong>how</strong>n in Table 4.7. As <strong>we</strong> will see in a moment,<br />
this is typical. Across the denominations, the 60 Norwich<br />
churches are <strong>do</strong>ing direct voluntary work equivalent to 67<br />
full-time equivalent people, worth at least £540,000 per<br />
year. Some of this is one-to-one work such as debt<br />
counselling, or support for ex-offenders. More<br />
importantly for <strong>our</strong> discussion, many activities require a<br />
good-sized public room, as can be seen in Table 4.7. For<br />
example, f<strong>our</strong> out of ten Norwich churches (40%) are<br />
organising over-60s clubs, with an average attendance at<br />
each of 22 people. In order to have this level of social<br />
impact, access to suitable buildings is crucial.<br />
We <strong>do</strong> not know whether, in general, those churches<br />
which possess historic buildings feel restricted in their<br />
community activity by potential heritage considerations.<br />
4.3 Major conversions and regeneration<br />
At the other extreme from these examples are major<br />
conversions (for two examples, see the box on page 42).<br />
This scale of work is mainly appropriate for urban<br />
churches, which can be very large, and are near to large<br />
numbers of potential users. Major conversions to<br />
churches will sometimes take place as part of a deliberate<br />
attempt at social regeneration. In general, funding can<br />
come from a wide range of organisations, many of them<br />
secular. 8<br />
Table 4.6<br />
Facilities provided by premises belonging to urban<br />
churches (all denominations), Greater Norwich<br />
(20 churches, 2003) and Hull (82 churches, 1999)<br />
Percentage of churches<br />
Facility<br />
with this facility<br />
Norwich<br />
Hull<br />
Male/ female toilets 89% 97%<br />
Kitchen 87% 95%<br />
Disabled access 78% 77%<br />
PA &/or Loop system 75% 73%<br />
Car parking 67%<br />
Disabled toilets 64% 40%<br />
Baby changing facilities 47% 27%<br />
Modern business standard<br />
audio visual equipment<br />
27%<br />
S<strong>our</strong>ces: Norwich City/Church Dialogue, Presentation; SEARCH, Count<br />
us in
HOW DO WE KEEP OUR <strong>PARISH</strong> <strong>CHURCHES</strong>? • USING CHURCH BUILDINGS 41<br />
Table 4.7<br />
Greater Norwich: community activities (involving groups of<br />
people) directly provided by churches (2003)<br />
Excludes Christian activities not directly attached to churches<br />
Activity<br />
Proportion of churches<br />
providing this activity<br />
All<br />
denominations<br />
(55<br />
churches)<br />
CoE<br />
(21<br />
churches)<br />
Average<br />
attendees<br />
per<br />
session<br />
Mums and toddlers 44% 43% 16<br />
groups<br />
Youth clubs for up 40% 48% 18<br />
to 15s<br />
Over 60s clubs 40% 48% 22<br />
Lunch clubs 36% 38% 28<br />
Drop in facility /café 29% 29% 65<br />
Holiday schemes 27% 29% 36<br />
for children<br />
Sporting activities 24% 14% 19<br />
Scout/beaver/guide 16% 33% 30<br />
groups<br />
Before- or afterschool<br />
16% 5% 24<br />
clubs<br />
Youth clubs for 16% 14% 20<br />
16–18s<br />
Parenting support 9% 5% 8<br />
or classes<br />
Pre-school nursery<br />
age 2–5<br />
7% 10% 23<br />
S<strong>our</strong>ce: Norwich City/Church Dialogue, Presentation and Directory<br />
Although a good number of individual examples of this<br />
sort of conversion have been published, overall facts and<br />
#gures have eluded me, together with any feel for <strong>how</strong><br />
much of this is happening in listed buildings. The recent<br />
annual report of the Church Urban Fund reported 41<br />
grants to capital projects, of which I understand (personal<br />
communication) that some at least <strong>we</strong>re for works<br />
involving the church building as <strong>we</strong>ll as ancillary<br />
buildings. This may provide some indication of the<br />
number of such projects being undertaken at present.<br />
In Hull, a city with much deprivation, it was said a few<br />
years ago that about one third of churches had plans for<br />
building refurbishment to allow greater community access<br />
and involvement, 9 and a number of such developments<br />
are now afoot (see box).<br />
In general, is the funding of community activities going<br />
to make the preservation of historic church buildings a<br />
lighter task for urban church congregations? Or are those<br />
congregations that have historic buildings going to see<br />
them as an unnecessary #xed cost, putting a brake on the<br />
things they really want to <strong>do</strong>?<br />
4.4 The financial impact<br />
So far, I have skirted round the question of <strong>how</strong> and why<br />
any of this helps pay for repairs and maintenance of<br />
HULL<br />
Hull is a city with extremely low church attendance<br />
(around 2%), where half of the wards are in the top 10%<br />
most deprived in England. Post-war, there was a<br />
considerable building programme of social housing in<br />
the area and the construction of a large number of outer<br />
estates. These <strong>we</strong>re mostly poorly planned, without<br />
adequate community facilities such as health centres,<br />
community centres etc. Fortunately the mainstream<br />
churches had the foresight to build churches in almost<br />
all of these communities when the estates <strong>we</strong>re built.<br />
Some churches have already developed the use of<br />
their buildings. Others are at different stages of the<br />
process. For example, three Anglican churches have<br />
recently completed participatory appraisals of their<br />
communities and are now looking at the most effective<br />
ways of using their buildings in response to what the<br />
local communities are saying. A further three churches<br />
(one Anglican, one Methodist and one Roman<br />
Catholic) have had plans drawn up and are currently<br />
s<strong>our</strong>cing funding to put the plans into action.<br />
S<strong>our</strong>ce: SEARCH, personal communication<br />
church buildings. From <strong>our</strong> limited perspective, it can<br />
help in the following direct ways.<br />
• It can extend the network of people who have a stake<br />
in the continued existence of the church building,<br />
and may be prepared to support it #nancially when<br />
required.<br />
• It will often provide a direct s<strong>our</strong>ce of income to the<br />
church, by renting out space, or running paid-for<br />
activities in the building.<br />
• It may attract public funding for community<br />
activities taking place within the church building.<br />
I have no hard data on the #nancial impact of any of these.<br />
Nevertheless, I would like to explore the third one, as it is<br />
rising up the political agenda.<br />
We have already seen <strong>how</strong> much is going on in<br />
Norwich. It turns out that this level of church social<br />
activity is perfectly normal. 10 (Other faiths are also active,<br />
but are outside <strong>our</strong> scope.)<br />
For example, the 3,600 churches of all denominations<br />
in Yorkshire and the Humber are estimated to provide<br />
social action worth bet<strong>we</strong>en £55m and £75m per year<br />
(Table 4.8). If this is scaled up to the approximately 38,000<br />
churches in England 11 – and all the evidence suggests that<br />
this level of activity is not uncommon – then the value of<br />
social action undertaken by churches in England is<br />
bet<strong>we</strong>en £500m and £750m per year.<br />
The growing understanding of the extent of this activity<br />
is now affecting government policy-making at all levels.<br />
Funding is following policy. It is increasingly considered<br />
acceptable to funnel taxpayers’ money through religious<br />
voluntary groups for social purposes, if the social purposes<br />
themselves are desirable.<br />
For example, the Government’s National Strategy Action<br />
Plan states that: 12<br />
Faith groups may offer a channel to some of the<br />
hardest-to-reach groups. A pragmatic approach will be<br />
taken to funding faith groups, recognising that they might
42 TREVOR COOPER • HOW DO WE KEEP OUR <strong>PARISH</strong> <strong>CHURCHES</strong>? • 2004 • www.ecclsoc.org<br />
THREE EXAMPLES OF THE ADDITIONAL USES OF CHURCH BUILDINGS<br />
Photographs of these churches will be found on the rear cover,<br />
brie$y described on the reverse of the title page<br />
Holy Trinity, Haddenham, Cambridgeshire<br />
Haddenham is a village lying bet<strong>we</strong>en Cambridge and Ely.<br />
The parish church, Holy Trinity, is a Grade I listed<br />
medieval building, mainly of the thirteenth and<br />
f<strong>our</strong>teenth centuries. It has transepts, aisles and a <strong>we</strong>st<br />
to<strong>we</strong>r.<br />
A meeting room and kitchenette have recently been<br />
introduced into the north aisle, assisted by the Rural<br />
Churches in Community Service, amongst others. The<br />
new room is separated by glass partitions from the nave,<br />
‘to stunning effect’. The room can seat up to 24 people<br />
theatre style or 15 in a more informal seating arrangement.<br />
Toilet facilities within the church for people with<br />
disabilities are also included within the scheme.<br />
S<strong>our</strong>ces: Open All H<strong>our</strong>s; church <strong>we</strong>bsite at:<br />
<br />
St Aidan’s, Cleethorpes, Lincolnshire: Serving the<br />
community project<br />
The church, by C. Hodgson Fowler, was consecrated in<br />
1906. The area surrounding the church is of#cially<br />
described as being 30% deprived.<br />
The old church hall was sold, and the alteration of the<br />
church to dual use with a new Church Community<br />
Centre was completed in April 1983. Two thirds of the<br />
nave was converted to an upper sports hall with toilets,<br />
changing rooms and storage; and a lo<strong>we</strong>r hall with<br />
kitchen, storage, toilets, boiler room and community<br />
centre of#ce. A lift was added ten years ago, and there<br />
<strong>we</strong>re further capital improvements at the end of the 1990s.<br />
In early 2004 a second $oor was inserted, forming an<br />
of#ce suite for the ‘Sure Start’ initiative, with computer<br />
suite, kitchen and toilet facilities, and a new lift.<br />
There are three full time workers on the Serving the<br />
Community project and some 50 volunteers. The building<br />
is open daily, Monday to Friday from 9 a.m. to 10 p.m.<br />
On average, the project attracts 360 users a <strong>we</strong>ek on<br />
various c<strong>our</strong>ses, including painting, introduction to<br />
counselling, computer skills, #rst aid, money<br />
management, drugs awareness, English, maths, local<br />
history, <strong>keep</strong> #t, and kick boxing. Advice is provided on<br />
dealing with debt, receiving bene#ts, securing housing,<br />
employment and job-seeking techniques.<br />
There are luncheon and friendship clubs, parent and<br />
toddler groups, and a ‘Gingerbread’ group. There are six<br />
uniformed organizations ranging in age from 6 to 16<br />
years. The local MP holds a monthly clinic here.<br />
This is not to forget the mid<strong>we</strong>ek communion<br />
service, and a range of services on Sunday. The main<br />
worship areas seats 150 comfortably, and a separate Lady<br />
Chapel is used for some services.<br />
S<strong>our</strong>ces: Angels and Advocates; personal communication; church<br />
<strong>we</strong>bsite at: <br />
St Paul’s Church, Walsall, West Midlands – now<br />
The Crossing<br />
From the church <strong>we</strong>bsite: The architect of St Paul’s [listed<br />
Grade II] was John Loughborough Pearson. The church<br />
was consecrated in 1893. Since then, the area around St<br />
Paul’s has largely changed from residential to<br />
commercial. To meet this change the church was<br />
re-ordered during 1994–5 and the whole building is<br />
now known as The Crossing at St Paul’s.<br />
The ground $oor consists of seven retail units which<br />
celebrate arts and crafts, fashion and $o<strong>we</strong>rs, books, gifts<br />
and music. The Day Chapel is open to all from Monday<br />
to Saturday, 8.30 a.m. to 5.30 p.m., for private prayer<br />
and quiet re$ection.<br />
The #rst $oor includes a restaurant and Coffee Shop,<br />
which provides quality food at competitive prices in an<br />
uplifting, smoke-free environment. Frequent<br />
exhibitions by local artists around the balcony seating<br />
area provide an attractive and stimulating environment.<br />
This level also includes the of#ce of Walsall Carers’<br />
Trust, the Centre Manager’s Of#ce and the of#ces of St<br />
Paul’s Church, where a Church of England priest is<br />
often available.<br />
The second $oor is used for worship by St Paul’s<br />
Church every Sunday. The meeting area and ancillary<br />
rooms are also used for a wide variety of functions,<br />
including conferences, training events, exhibitions and<br />
concerts. The main worship area – The Upper Room –<br />
is situated at this level and is where church services<br />
are held.<br />
S<strong>our</strong>ce: verbatim from the church <strong>we</strong>bsite at:<br />
<br />
be the most suitable organisations to deliver community<br />
objectives.<br />
There is an appreciation that buildings are important.<br />
One research report on church use made the obvious but<br />
important point that ‘the churches’ buildings are a<br />
valuable res<strong>our</strong>ce for social action and community<br />
involvement’. Another said that ‘community use of<br />
church buildings, in whatever capacity, is highly bene#cial<br />
to the individual and the community’. A report<br />
investigating activity across a range of faiths agreed that<br />
‘access to buildings is often key’ for this type of activity,<br />
and another describing a range of faith projects concluded<br />
that ‘faith groups, through the use of their buildings and<br />
other activities, add value to community regeneration and<br />
the neighb<strong>our</strong>hood renewal process’. A survey of secular<br />
funding of faith groups commented that ‘in all of <strong>our</strong>
HOW DO WE KEEP OUR <strong>PARISH</strong> <strong>CHURCHES</strong>? • USING CHURCH BUILDINGS 43<br />
Table 4.8<br />
Yorkshire and the Humber: the extent of church social<br />
action, all denominations (report published c. 2002, based<br />
on evidence collected 1995 onwards)<br />
Number of churches in region 3,600<br />
Number of social action projects 6,500<br />
Number of churchgoers regularly involved 50,000 – 70,000<br />
in church social action<br />
Number of staff involved in church projects 3,000<br />
Number of people benefiting regularly from 143,000*<br />
church projects<br />
Economic value of church social action per £55m – £75m<br />
annum (i.e. if wages <strong>we</strong>re paid to<br />
volunteers)<br />
*Of whom 75% are likely not to be part of the church’s congregation<br />
S<strong>our</strong>ce: Angels and Advocates, pages 15–17<br />
study areas, faith-related buildings constitute a signi#cant<br />
proportion of the space available for community use’. 13<br />
The note by the Of#ce of the Deputy Prime Minister,<br />
Involving Faith Communities con#rms that government<br />
recognises the importance of buildings: 14<br />
Faith communities also have a role in delivering<br />
partnership or programme outcomes....they can be<br />
better res<strong>our</strong>ced than other comparable bodies:...<br />
• They usually have their own premises – frequently<br />
centres for community activity and members voluntary<br />
work....<br />
But – and for <strong>our</strong> purposes it is a big ‘but’ – a good deal<br />
of church social activity takes place in ancillary space, such<br />
as a church hall, not in the church building itself. If an<br />
ancillary building is being used for the activity, then any<br />
funding streams are not providing direct support for the<br />
church building itself, which is the focus of <strong>our</strong> interest.<br />
(Ho<strong>we</strong>ver, they may take pressure off the church budget,<br />
and make up<strong>keep</strong> of the church building easier for the<br />
congregation.)<br />
The fact is, that after much casting-around, I am better<br />
informed about the sort of activities which can and <strong>do</strong> take<br />
place in church buildings, and the means by which they<br />
can provide #nancial support. But I have not obtained any<br />
#rm idea of <strong>how</strong> much extra income can be generated<br />
from these uses of the building, nor the extent to which<br />
they will support historic church buildings. As regards<br />
Notes<br />
1. Akker and Passmore, Opening <strong>our</strong> Doors, page 21.<br />
2. Lon<strong>do</strong>n T<strong>our</strong>ist Authority, personal communication, based on The<br />
Economic Impact of Lon<strong>do</strong>n’s West End Theatres (1998).<br />
3 The Countryside Agency, Rural Services in 2000, page 24, available<br />
from .<br />
4. Francis and Martineau, Rural Mission, page128.<br />
5. The Revd Jeremy Martineau, personal communication.<br />
6. Angels and Advocates, page 24; the point is reinforced in Sowing the<br />
Seed, pages 29–30.<br />
7. For Norwich, Norwich City/Church dialogue; for Hull, see Count us in.<br />
8. For this and the following paragraph, see Bibliography.<br />
9. SEARCH, Who <strong>do</strong> <strong>we</strong> serve, December 2003, page 2.<br />
10. See Bibliography for references to community and social activity.<br />
11. For number of churches, see Brierley, Religious Trends,4,<br />
Table 2.21.1.<br />
HOW TO OBTAIN FUNDING<br />
It might be helpful if faith groups <strong>we</strong>re more able to<br />
describe the impact of their own activities in terms of<br />
social capital. Funding bodies are likely to be more open<br />
to applications that are couched in these terms.<br />
S<strong>our</strong>ce: Faith in Action<br />
A DISTRICT COUNCIL<br />
It is very dif#cult to obtain funding when the group<br />
applying for funding is a church group, no matter what<br />
the project is.<br />
S<strong>our</strong>ce: letter from a District Council, quoted in Diocese of Norwich,<br />
Church Buildings<br />
THE LOCAL GOVERNMENT ASSOCIATION<br />
Decisions on whether to fund a particular organisation<br />
should be made in terms of the nature of the case the<br />
organisation is making, rather than on whether it has a<br />
religious or secular culture.<br />
S<strong>our</strong>ce: Faith and Community, published by the Local Government<br />
Association, 2002. For details, see note 12, below.<br />
THE BISHOP OF ST ALBANS<br />
I sometimes think if <strong>we</strong> called the mother and toddler<br />
groups – which just about every parish in the country<br />
runs – women’s empo<strong>we</strong>rment units instead, <strong>we</strong>’d get<br />
#nancial support left, right and centre. We <strong>do</strong>n’t want<br />
special support – but <strong>we</strong> <strong>do</strong>n’t want to be discriminated<br />
against either.<br />
S<strong>our</strong>ce: The Guardian, 4 June 2003<br />
major conversions, although I have come across some<br />
fascinating examples, I am still more or less in the dark as<br />
to <strong>how</strong> many church buildings are currently being<br />
maintained in this way, or what the potential is in future.<br />
So far <strong>our</strong> discussion has been general, using data for<br />
the whole country wherever this was available. In the next<br />
section <strong>we</strong> explore three dioceses in more depth.<br />
12. Of#ce of the Deputy Prime Minister, National Strategy Action Plan<br />
(2001), page 52, available from . See also Local<br />
Government Association, Faith and Community (2002, ISBN<br />
1840492783), e.g. pages 8 and 18; available from .<br />
13. Angels and Advocates, page 7; Church Buildings in the Community,<br />
page 8; Faith in action, page 19; Building on Faith, page 63; Farnell et<br />
al., ‘Faith’ in urban regeneration?, page 21. Details in Bibliography.<br />
14. Of#ce of the Deputy Prime Minister, Involving Faith Communities<br />
(n.d.), unpaginated [page 1], available from .
44<br />
5. Case studies: three dioceses<br />
This section looks at three dioceses in more detail: one<br />
rural diocese, one largely urban one, and one with a mix<br />
of environments. These dioceses <strong>we</strong>re chosen because<br />
relevant information is available, and for no other reason.<br />
S<strong>our</strong>ces for this section are given in the Bibliography.<br />
5.1 A rural diocese: Lincoln<br />
The diocese of Lincoln has 647 church buildings (not<br />
counting more than 100 redundant ones, some of which<br />
have been demolished). About two-thirds (65%) of these<br />
buildings are listed Grade I or II*; fe<strong>we</strong>r than one in ten<br />
(9%) of the churches are unlisted.<br />
These churches are served by about 200 full time<br />
parochial clergy, averaging more than three church<br />
buildings per cleric. To cope with its particular pressures,<br />
Lincoln has developed innovative forms of nonstipendiary<br />
leadership and ministry. There are a large<br />
number of people with such roles, including nearly 200<br />
people accredited to minister at church services, and a<br />
further 230 lay readers, organised by deanery groups.<br />
Although the average number of church buildings<br />
looked after by each stipendiary minister is about three,<br />
this hides considerable variation (Table 5.1). Approximately<br />
180 church buildings are under the aegis of clergy<br />
who have at least seven buildings each. These 180<br />
buildings each have usual Sunday attendance of no more<br />
than eight people, and in many cases just #ve or six. This<br />
Number of churches<br />
250<br />
200<br />
150<br />
100<br />
50<br />
0<br />
100<br />
200<br />
160<br />
70 70<br />
1 - 5 6 - 10 11 - 20 21 - 30 31 - 50 51 - 100 >100<br />
is an example of the general fact that multi-church<br />
ministers tend to have smaller church congregations,<br />
which may thus intensify the dif#culties in looking after<br />
their buildings.<br />
There is a wide spread of attendance (Graph 5.1). I<br />
estimate that about 300 church buildings (roughly one<br />
half) have usual Sunday attendance of ten people or fe<strong>we</strong>r;<br />
most of these will be listed, many Grade I or II*. Most<br />
worshippers are concentrated in a small number of church<br />
34<br />
Usual Sunday attendance (adults and children)<br />
Graph 5.1 Diocese of Lincoln: number of churches by usual<br />
Sunday attendance (adults and children) (2003)<br />
S<strong>our</strong>ce: Diocese of Lincoln Directory, 2003; for multi-church parishes, I<br />
assumed attendance was split equally bet<strong>we</strong>en buildings, which may<br />
slightly compress the true range of attendance.<br />
14<br />
Table 5.1<br />
Diocese of Lincoln: estimated number of church buildings<br />
looked after by stipendiary clergy (if all vacancies filled)<br />
(2002)<br />
Number of<br />
church<br />
buildings per<br />
stipendiary<br />
cleric (if all<br />
vacancies<br />
<strong>we</strong>re filled)<br />
Number of<br />
stipendiary<br />
clerics with<br />
this many<br />
churches<br />
Average<br />
usual<br />
Sunday<br />
attendance<br />
at each of<br />
these<br />
churches<br />
(estimated)<br />
Cumulative<br />
number of<br />
churches<br />
11 2 6 22<br />
10 5 5 72<br />
9 4 5 108<br />
8 2 5 124<br />
7 8 8 180<br />
6 17 12 282<br />
5 16 10 362<br />
4 12 13 410<br />
3 29 21 497<br />
2 50 32 597<br />
1 or fe<strong>we</strong>r 67 79 647<br />
Clergy posts<br />
= 212<br />
S<strong>our</strong>ce: Diocese of Lincoln Directory, 2003<br />
Churches<br />
= 647<br />
Graph 5.2 Diocese of Lincoln: percentage of Local<br />
Authority voters who are on the church electoral roll or make<br />
up the usual Sunday attendance, by size of community<br />
(2002)<br />
S<strong>our</strong>ce: Diocese of Lincoln Directory, 2003<br />
25.0%<br />
20.0% 19.1%<br />
15.0%<br />
10.0%<br />
5.0%<br />
0.0%<br />
5.1%<br />
11.9%<br />
3.8%<br />
10.8%<br />
3.3%<br />
8.9% 8.7%<br />
6.0% 6.2%<br />
2.8% 2.9% 2.7% 2.3%<br />
1 -100 101 - 200 201 - 300 301 - 400 401 - 500 501 - 600 601 -<br />
1000<br />
size of community ( =number of Local Authority voters )<br />
% of LA voters on church electoral roll<br />
% of LA voters attending church
HOW DO WE KEEP OUR <strong>PARISH</strong> <strong>CHURCHES</strong>? • CASE STUDIES: THREE DIOCESES 45<br />
80<br />
70<br />
60<br />
50<br />
40<br />
30<br />
20<br />
10<br />
0<br />
pre-refm<br />
10 12<br />
17c and 18c<br />
1800-1820<br />
2<br />
1821-1840<br />
24<br />
1841-1860<br />
52<br />
1861-1880<br />
Graph 5.3 Diocese of Manchester: number of surviving<br />
churches, by date of build (1997)<br />
S<strong>our</strong>ce: Manchester, Survey<br />
800<br />
700<br />
600<br />
500<br />
400<br />
300<br />
200<br />
100<br />
0<br />
700<br />
(1800-<br />
1820)<br />
530<br />
1821-<br />
1840<br />
76<br />
1881-1900<br />
381 378 380<br />
1841-<br />
1860<br />
1861-<br />
1880<br />
1881-<br />
1900<br />
36<br />
1901-1920<br />
39<br />
359<br />
1901-<br />
1920<br />
1921-1940<br />
17<br />
1941-1960<br />
233<br />
1921-<br />
1940<br />
5<br />
1961-1980<br />
290<br />
(1940-<br />
1960)<br />
34<br />
1981-2000<br />
2<br />
253<br />
1961-<br />
1980<br />
Graph 5.4 Diocese of Manchester: present average number<br />
of seats per church, by date of build (2001)<br />
Note: small sample of churches for 1800–20 and 1940–60<br />
S<strong>our</strong>ce: Manchester, Survey; Manchester Diocesan Yearbook, 2001/2<br />
Number of churches<br />
90<br />
80<br />
70<br />
60<br />
50<br />
40<br />
30<br />
20<br />
10<br />
0<br />
8<br />
53<br />
84<br />
64<br />
43<br />
23<br />
16<br />
6 7<br />
1-100 101-200 201-300 301-400 401-500 501-600 601-700 701-800 801-900<br />
Number of sittings per church<br />
Graph 5.5 Diocese of Manchester: number of churches of<br />
various sizes (size indicated by number of seats) (2001)<br />
S<strong>our</strong>ce: Manchester Diocesan Yearbook, 2001/2<br />
percentage<br />
100%<br />
80%<br />
60%<br />
40%<br />
20%<br />
0%<br />
5%<br />
45%<br />
50%<br />
Graph 5.6 Diocese of Manchester: proportion of listed<br />
churches, by date of build (1997)<br />
S<strong>our</strong>ce: Manchester, Survey<br />
28%<br />
57%<br />
15%<br />
87%<br />
10%<br />
pre-19th cent (22 churches) 19th cent (190 churches) 20th cent (97 churches)<br />
I/II/*A/B II unlisted<br />
3%<br />
buildings, and if, for example, some terrible disaster wiped<br />
out the 500 church buildings in the diocese with the<br />
lo<strong>we</strong>st congregations, leaving about 150 churches, then<br />
<strong>we</strong>ll over half of Sunday worshippers would still be able to<br />
go to their normal church building.<br />
The #gures for Lincoln provide con#rmation that<br />
smaller communities tend to be more publicly committed<br />
to their church. Graph 5.2 s<strong>how</strong>s the percentage of Local<br />
Authority (LA) voters who commit themselves to join the<br />
electoral roll (that is, become ‘members’) of their church,<br />
or make up usual Sunday attendance. The percentage is<br />
s<strong>how</strong>n for different size of community. For example,<br />
communities with bet<strong>we</strong>en 101 – 200 Local Authority<br />
voters per church building have an average of 11.9% of<br />
people joining the electoral roll, and about 3.8% attending<br />
church. In contrast, the proportion becoming a ‘member’<br />
in a larger community with bet<strong>we</strong>en 601 and 1000 LA<br />
voters is only approximately half as large (6.2%), and only<br />
2.3% attend on a given Sunday.<br />
5.2 A largely urban diocese: Manchester<br />
The second case study is the diocese of Manchester,<br />
consisting of the Archdeaconries of Manchester, Bolton<br />
and Rochdale. It is based on a very thorough report<br />
produced in 1997 by EH and the diocese, to which further<br />
material was added later.<br />
As the diocesan <strong>we</strong>bsite point out, the diocese covers a<br />
relatively small but densely populated geographical area<br />
which consists mainly of a large part of Greater<br />
Manchester. Historically, the cities and towns of the area<br />
grew during the period of the industrial revolution and<br />
throughout the Victorian period. In terms of the pattern of<br />
settlement, this is largely an urban diocese. There are a<br />
few rural parts of the diocese, with many of the small<br />
communities on the edges of the large towns developing<br />
from what <strong>we</strong>re originally industrial villages.<br />
Whereas the population density of Lincoln diocese is<br />
about 350 people per square mile, that of Manchester<br />
diocese is about 4500. There are about 350 churches in<br />
the diocese. Of the churches surviving to 1997, the great<br />
majority – more than 90% – are said to have been built<br />
since 1820: of these, almost exactly one third are<br />
t<strong>we</strong>ntieth-century (Graph 5.3) and two-thirds<br />
nineteenth-century.<br />
There are too many church buildings. Today, the usual<br />
Sunday attendance in the diocese is about 27,000, but it<br />
has seating for more than 110,000 people. Furthermore,<br />
some very large churches <strong>we</strong>re built during the nineteenth<br />
century (Graph 5.4). After 1840 the average size of church<br />
was approaching 400 seats. Here it remained until the<br />
t<strong>we</strong>ntieth century, in the latter part of which, on average,<br />
churches <strong>we</strong>re built to hold about 250 people. There are<br />
some thirteen churches with sittings of 700 people or<br />
more, and more than 80 with sittings of bet<strong>we</strong>en 400 and<br />
700 (Graph 5.5).<br />
On the whole, these large churches <strong>do</strong> not serve<br />
current needs for worship (though they can provide<br />
opportunities for additional uses). Whereas the average
46 TREVOR COOPER • HOW DO WE KEEP OUR <strong>PARISH</strong> <strong>CHURCHES</strong>? • 2004 • www.ecclsoc.org<br />
Table 5.2<br />
Diocese of Manchester: electoral rolls, for<br />
those churches where data available (2002)<br />
Size of<br />
electoral roll<br />
Churches<br />
% Number<br />
1–10 - 0<br />
11–20 - 1<br />
21–30 3 8<br />
31–40 6 19<br />
41–50 7 22<br />
50–70 13 39<br />
71–100 18 55<br />
101–200 38 119<br />
over 200 15 47<br />
TOTAL<br />
100% = 310<br />
churches 310<br />
Average electoral roll: 128<br />
S<strong>our</strong>ce: Manchester Diocesan Yearbook, 2001/2<br />
usual Sunday attendance per church in the diocese is of<br />
the order of 80 people, the average church building holds<br />
more than 360. There are about 50 churches where the<br />
church can seat 400 more people than appear on the<br />
electoral roll.<br />
It must be emphasised that <strong>we</strong> are using averages for<br />
this discussion. There are a number of large church<br />
congregations in the diocese and a common problem with<br />
such churches is lack of room. But, on average, the<br />
diocese has much more seating than it requires. This may<br />
<strong>we</strong>ll cause pastoral problems, as many people #nd acres of<br />
empty pews un<strong>we</strong>lcoming. In addition, much of the cost<br />
of maintenance and repairs is spent on empty space.<br />
There is often no relationship now bet<strong>we</strong>en the<br />
physical size of church and the population of the parish<br />
(analysis not s<strong>how</strong>n here). This is not surprising. Not only<br />
have there been large movements of population in the last<br />
two hundred years, but the Victorians often built churches<br />
larger than the parish needed, sometimes assuming that a<br />
popular church would attract those from outside the<br />
parish. (The Victorians <strong>we</strong>re not the #rst to build more<br />
grandly than was required: many medieval churches are<br />
far larger than can ever have been needed.) Indeed one can<br />
start to question the whole notion of a parish in today’s<br />
urban environment, and some dioceses are looking at<br />
ways of creating more $uid geographical groupings. Not<br />
surprisingly, there are legal implications...<br />
My analysis of churches’ electoral rolls (not s<strong>how</strong>n<br />
here) indicates that there is no particular date range of<br />
churches in the diocese which are especially struggling to<br />
#nd congregations. It is not the case, for example, that<br />
mid-nineteenth century church buildings attract smaller<br />
congregations than those of different date.<br />
Approximately half of the churches in the diocese <strong>we</strong>re<br />
listed at the time of the 1997 report (Graph 5.6). Of the<br />
nineteenth-century churches, approximately one in seven<br />
(15%) <strong>we</strong>re Grade I/II*, more than one half <strong>we</strong>re Grade II<br />
MANCHESTER DIOCESE: QUOTES<br />
The second major problem facing the diocese [of<br />
Manchester] relates to the care of a certain number of<br />
historic churches which, though they may still have<br />
small congregations, are now ill adapted to suit the<br />
needs of their parishes. The most obvious c<strong>our</strong>se of<br />
action, in such cases, would be for the diocese to make<br />
these churches redundant but, <strong>we</strong>re it to <strong>do</strong> this, the<br />
chances of the buildings #nding a new use would be<br />
remote. In Manchester, redundancy is all too often the<br />
prelude to vandalism, dereliction and, #nally,<br />
demolition.<br />
***<br />
Given the serious problems the church of [...] has had<br />
with dry rot, and the deprivation of the surrounding<br />
neighb<strong>our</strong>hood, you might have expected it to be<br />
demolished years ago. But no, funds have been found to<br />
deal with the rot, and the parish is seeking a Lottery<br />
grant to adapt the church for a wider range of activities.<br />
This is a remarkable achievement.<br />
S<strong>our</strong>ce: Manchester, Survey<br />
(57%), and one quarter (28%) unlisted. Is it typical of<br />
urban churches of this period?–I<strong>do</strong>notthink anyone<br />
knows.<br />
One surprise is that for churches built during the<br />
nineteenth century, higher grades of listing tend (on<br />
average) to be associated with larger churches. Grade I and<br />
II* churches of this date have an average of about 490<br />
seats, Grade II average approximately 430, whilst the<br />
average for unlisted churches is about 320 seats. On<br />
re$ection this is perhaps not surprising, but everything<br />
else being equal may mean that nineteenth-century listed<br />
buildings are more expensive to maintain and repair than<br />
unlisted ones. A more surprising #nding is that for<br />
nineteenth-century churches, the higher the grade of<br />
listing, the higher the average size of membership: Grade I<br />
church buildings attract an average electoral roll of some<br />
235, Grade II* of 175 whilst Grade II have an average 145.<br />
Unlisted churches had the smallest average roll, at 130.<br />
How easy is it for church members to <strong>keep</strong> their<br />
churches in good repair? The electoral roll of an urban<br />
church probably needs to be considerably larger than that<br />
of a rural church to be able to maintain the building, given<br />
the average size of the buildings. In this case,<br />
approximately 15% of churches have ‘membership’ of 200<br />
people or more (Table 5.2). At the other end of the scale,<br />
9% of churches have an electoral roll of 40 people or<br />
fe<strong>we</strong>r, which (on average) might imply typical Sunday<br />
attendance of 25 or fe<strong>we</strong>r.<br />
Thus many of Manchester’s church buildings have<br />
large congregations, but a signi#cant number are smaller<br />
and perhaps struggling. Taken across the board, there are<br />
too many churches, and too many seats in those churches.<br />
Given these pressures, the state of the church buildings in<br />
1997 is not surprising: 21% <strong>we</strong>re found to be ‘needing<br />
attention’, and 9% <strong>we</strong>re found to be in ‘poor’ condition.
HOW DO WE KEEP OUR <strong>PARISH</strong> <strong>CHURCHES</strong>? • CASE STUDIES: THREE DIOCESES 47<br />
It was not the purpose of the 1997 survey to make #rm<br />
proposals for the future. Nevertheless, of the listed<br />
buildings it was suggested that ten (including three of<br />
Grade I or II*) might be made redundant and that eleven<br />
others should have efforts directed to solving the problem<br />
caused by the building, usually by attempting to obtain<br />
grants – the unstated implication being that otherwise the<br />
building might be dif#cult to sustain in use. A further 25<br />
listed buildings <strong>we</strong>re identi#ed as being in need of repair<br />
to continue with their work. Of unlisted church<br />
buildings, the diocese at that time <strong>we</strong>re looking seriously<br />
at the future of about forty.<br />
Thus in 1997 about 30% of churches <strong>we</strong>re not in<br />
satisfactory condition, regardless of grade. Thought was<br />
being given to making as many as 12% of the listed<br />
churches redundant, and perhaps one quarter of the<br />
unlisted ones.<br />
5.3 A mixed diocese: Chelmsford<br />
The diocese of Chelmsford, which covers much of Essex,<br />
is a mix of rural and urban communities, including #ve<br />
Lon<strong>do</strong>n boroughs. In this respect it is a microcosm of the<br />
wider CoE. The diocese has recently carried out a review<br />
of its church buildings, on which this case study is based.<br />
This is available on the internet, and provides a useful<br />
study of the issues and opportunities arising from the<br />
CoE’s historic stock of church buildings. Although<br />
providing an overview of the situation, the report<br />
emphasises that the future of church buildings lies with<br />
local communities.<br />
There are in the diocese some 530 parishes looking<br />
after rather more than 600 church buildings, of which<br />
61% are listed. The total seating capacity is 105,000,<br />
averaging 175 seats per church building, roughly half that<br />
of Manchester. Usual Sunday attendance (at all services) is<br />
39,000, giving a seat utilization of some 37%.<br />
Here as elsewhere the CoE has responded to changing<br />
needs. Since 1968 more than 60 churches have been<br />
declared redundant; conversely, since 1975 there have<br />
been ten or more new church buildings, with six more<br />
under discussion. Some congregations now worship in<br />
schools or other rented premises, and there are many cases<br />
of church buildings being shared with other<br />
denominations, either formally or informally.<br />
As discussed in Section 4.2, since the early 1990s, some<br />
t<strong>we</strong>nty other major redevelopments of existing church<br />
premises have been, or are being, carried out, most or all<br />
of them in urban areas. In total, more than one hundred<br />
of the churches in the diocese have already introduced<br />
adaptations, extensions and re-orderings of the buildings<br />
for wider community use, and a further 30 or so have<br />
speci#c plans in hand. In this context, one third of the<br />
parishes (33%) look forward to further development and<br />
use of their building.<br />
One worry is that in some places church halls are now<br />
reaching the end of their useful life, thus removing a<br />
s<strong>our</strong>ce of income which is important to many parishes.<br />
CHELMSFORD DIOCESE<br />
Despite the energy of the faithful few, the tears of the<br />
local population, and the indignation of the<br />
preservationists, it seems inevitable that many of these<br />
church buildings [with rural congregations less than<br />
t<strong>we</strong>nty people] will close for worship in the next t<strong>we</strong>nty<br />
years. This will probably happen with a depressed<br />
resignation rather than a positive approach to<br />
re-grouping and renewal, which is a tragedy.<br />
***<br />
The huge restoration programme...isbringing back<br />
into use the Norman church of [...]...Thestruggles<br />
with the heritage bodies, the huge fund-raising, and the<br />
vision for community use and outreach are quite simply<br />
enough for any deanery, let alone a single congregation!<br />
S<strong>our</strong>ce: Chelmsford, Review<br />
The extent of this is not quanti#ed, but anec<strong>do</strong>te suggests<br />
this is repeated elsewhere in England.<br />
As stated above, the average seat usage on Sundays<br />
is 37%. But this hides very wide regional variation within<br />
the diocese, which can be explored by looking at<br />
the 27 deaneries, each of which usually has around t<strong>we</strong>nty<br />
churches. Some deaneries, typically the urban ones, have<br />
average seat usage of <strong>we</strong>ll above 50%, whilst others, in<br />
more rural areas, have an average seat usage as low as 15%.<br />
Some 104 churches are in deaneries where the average<br />
seat usage in their deanery is less than 20%. On the other<br />
hand, 123 churches are in deaneries where average seat<br />
usage is higher than 50%. In other words, parts of the<br />
diocese are more ‘over-churched’ than others, when<br />
measured by seat utilisation. This can be seen in<br />
Graph 5.7, which s<strong>how</strong>s the average seat usage for the<br />
#fteen deaneries in West Ham (the most urban<br />
archdeaconry) and Colchester (the most rural). For<br />
example, churches in the urban deanery I have called<br />
‘WH1’ have average utilisation of 51%, whereas at the<br />
other extreme, those in ‘COL10’ average only 15%.<br />
One of the main reasons for this discrepancy is simply<br />
that for historical and other reasons, some areas have<br />
fe<strong>we</strong>r church seats per head of population, and thus #nd it<br />
easier to #ll them.<br />
For example, the #ve Lon<strong>do</strong>n boroughs making up the<br />
West Ham archdeaconry have the fe<strong>we</strong>st seats per head of<br />
population, with roughly 2% as many seats as there are<br />
people living in the area. Here there are 126 church<br />
buildings amongst a population of more than one million.<br />
In contrast, in the more rural archdeaconry of<br />
Colchester the number of seats per head of population is<br />
about f<strong>our</strong> times as great (8%), with nearly twice as many<br />
churches (227) as the Lon<strong>do</strong>n boroughs despite having<br />
only half their population (half a million people).<br />
Although to a certain extent the excess of rural seats is<br />
cancelled out by the tendency for people in rural areas to<br />
be more loyal in attendance, this is not enough to make up<br />
for the underlying difference in number of seats per head<br />
of population. As a result, the Lon<strong>do</strong>n boroughs have<br />
fuller churches than those in the Colchester area.<br />
Graph 5.8 demonstrates this for each deanery. The urban
48 TREVOR COOPER • HOW DO WE KEEP OUR <strong>PARISH</strong> <strong>CHURCHES</strong>? • 2004 • www.ecclsoc.org<br />
Deanery<br />
WH 1<br />
51%<br />
WH 2<br />
40%<br />
WH 3<br />
55%<br />
WH 4<br />
46%<br />
WH 5<br />
65%<br />
COL 1<br />
35%<br />
COL 2<br />
26%<br />
COL 3<br />
28%<br />
COL 4<br />
27%<br />
COL 5<br />
32%<br />
COL 6<br />
16%<br />
COL 7<br />
26%<br />
COL 8<br />
20%<br />
COL 9<br />
15%<br />
COL 10<br />
15%<br />
0% 10% 20% 30% 40% 50% 60% 70%<br />
West Ham deaneries Colch deaneries<br />
Graph 5.7 Diocese of Chelmsford:<br />
average utilisation of seats on<br />
Sunday, by anonymised deanery<br />
(Archdeaconries of West Ham and<br />
Colchester only) (2002)<br />
S<strong>our</strong>ce: Chelmsford, Review<br />
deanery WH1 has seats for only 1.7% of the population, so<br />
despite attendance as low as 0.9%, its churches, as <strong>we</strong> saw<br />
earlier, have average utilisation of 51%. Compare this with<br />
COL10: much higher attendance rates (3.1%) but a huge<br />
number of seats – enough for 20.3% of the population –<br />
mean that, as discussed, the average utilisation of seats is<br />
only 15%.<br />
The underlying differences here are worth exploring.<br />
The Lon<strong>do</strong>n boroughs have a high proportion of<br />
Victorian buildings, with fe<strong>we</strong>r listed buildings than the<br />
rest of the diocese. Churches <strong>we</strong>re lost during the war,<br />
and some daughter churches have been sold. A number of<br />
the giant Victorian churches have been converted into<br />
multi-functional complexes, or new church centres have<br />
been built, replacing the original church. As a result of this<br />
recon#guration, much of which has required many years<br />
of dedicated effort, the number of seats is now perhaps<br />
realistic: average attendance on Sunday is 95 people per<br />
church building.<br />
In contrast to the Lon<strong>do</strong>n boroughs are the more rural<br />
areas. The most rural is the archdeaconry of Colchester,<br />
where the average attendance on Sunday is 45 people per<br />
church building, about half of that in the boroughs. As<br />
always there is considerable variation. There are 33<br />
churches (14%) in the archdeaconry who have 10 people<br />
or fe<strong>we</strong>r attending on Sunday, and a further 61 (27%)<br />
with bet<strong>we</strong>en 11 and 20 people – thus 94 churches (more<br />
than 40%) have congregations of 20 people or fe<strong>we</strong>r.<br />
In this archdeaconry, 88% of the 227 churches are<br />
listed, with nearly half being Grade I. This, plus their rural<br />
situation, and relative distance from each other, makes it<br />
far harder for parishes to be $exible and creative in the use<br />
of their buildings to meet changing circumstances.<br />
The report s<strong>how</strong>s imagination in considering ways in<br />
which some isolated and under-used rural buildings can<br />
be developed for mission, but there is no escaping the fact<br />
that many of these listed rural churches #nd themselves in<br />
a dif#cult position, and with less scope for shaping the<br />
future than in urban areas. The report takes the view that<br />
in this archdeaconry many of the 94 churches with<br />
congregations fe<strong>we</strong>r than t<strong>we</strong>nty people may #nd<br />
themselves deciding to close within the next two decades.<br />
Deanery<br />
WH 1 1.7%<br />
0.9%<br />
WH 2 1.8%<br />
0.7%<br />
WH 3 2.1%<br />
1.2%<br />
WH 4 2.2%<br />
1.0%<br />
WH 5<br />
2.5%<br />
1.6%<br />
COL 1 1.6%<br />
4.5%<br />
COL 2 1.3%<br />
5.1%<br />
COL 3 1.6%<br />
5.7%<br />
COL 4 1.7%<br />
6.3%<br />
COL 5<br />
3.6%<br />
11.1%<br />
COL 6 1.9%<br />
11.8%<br />
COL 7<br />
4.0%<br />
15.3%<br />
COL 8<br />
3.2%<br />
16.2%<br />
COL 9<br />
2.8%<br />
18.5%<br />
COL 10<br />
3.1%<br />
20.3%<br />
0.0% 5.0% 10.0% 15.0% 20.0% 25.0%<br />
seating capacity, as % of populn<br />
usual Sunday attendance, as % of populn<br />
Graph 5.8 Diocese of Chelmsford:<br />
usual Sunday attendance and seating<br />
capacity as proportion of population,<br />
by anonymised deanery<br />
(Archdeaconries of West Ham and<br />
Colchester only) (2002)<br />
S<strong>our</strong>ce: Chelmsford, Review
6. Keeping church buildings in future<br />
So far, I have attempted to describe the current position.<br />
In this section <strong>we</strong> look at the future, beginning by<br />
discussing the future of very small congregations, and<br />
then moving on to consider <strong>how</strong> the future is being<br />
shaped, and the view of government.<br />
6.1 Expectations of the future<br />
It is very dif#cult to predict the future of small congregations,<br />
particularly when there is a lack of detailed<br />
evidence about age-pro#les. In the diagram ‘The<br />
redundancy funnel’ I have summarised the available<br />
evidence, which I discuss in the following paragraphs.<br />
One dif#culty is that smaller congregations often have a<br />
determination to <strong>keep</strong> going, and maintain the church<br />
building in use. Indeed, there is evidence that tiny<br />
congregations <strong>do</strong> not necessarily decline, but can grow,<br />
and in fact are more likely to <strong>do</strong> so than large<br />
congregations. One survey looked at churches which had<br />
ten people or fe<strong>we</strong>r in 1989; by 1998, nearly 60% had<br />
grown, and just over 30% had shrunk. (We <strong>do</strong> not know<br />
<strong>how</strong> many had disappeared.) On the other hand, the best<br />
predictor of growth or decline in this period was the age<br />
pro#le of the congregation. Congregations with more<br />
than a quarter of their people over the age of 45 <strong>we</strong>re (on<br />
average) more likely to decline than grow, and the<br />
likelihood of decline rose as the proportion of this age<br />
group grew larger. 1 Although I could #nd no formal<br />
evidence, anec<strong>do</strong>tal evidence suggests that many small<br />
CoE congregations <strong>do</strong> have a high proportion of elderly<br />
folk.<br />
It may be that it is only when a particular dif#culty<br />
strikes – such as the death or departure of a key individual,<br />
or a major repair – that a tiny congregation gives up the<br />
struggle. Even then, in the early stages of redundancy,<br />
local folk may realise <strong>how</strong> much they value their church<br />
building, an effort is made, and it is withdrawn from the<br />
redundancy process.<br />
As a #nal dif#culty in predicting redundancy, it has<br />
been suggested to me that the redundancy pipeline itself<br />
has quite a small capacity at the diocesan level, and can<br />
only cope with a limited number of new cases per year,<br />
and that this is a further disincentive to dioceses from<br />
starting the redundancy process. If true (and I have no<br />
formal evidence) this is, of c<strong>our</strong>se, a two-edged sword:<br />
should redundancies ever surge, it is an important<br />
question <strong>how</strong> <strong>we</strong>ll this part of the pipeline would cope.<br />
No wonder the overall rate of redundancy is hard to<br />
predict, and that attempts in the past to make long-term<br />
forward estimates of redundancies by aggregating diocesan<br />
estimates have not been completely accurate. The Bridges<br />
Commission (1960), underestimated the number by one<br />
third, the Wilding report (1990) over-estimated by one<br />
half. Ho<strong>we</strong>ver, these long-term estimates <strong>we</strong>re not wildly<br />
wrong, and have been useful for putting appropriate<br />
mechanisms in place. 2 49
50 TREVOR COOPER • HOW DO WE KEEP OUR <strong>PARISH</strong> <strong>CHURCHES</strong>? • 2004 • www.ecclsoc.org<br />
The best forecasts will probably come from those with<br />
local knowledge of individual churches, including the<br />
churches themselves. A #gure of 300 redundancies over<br />
the next #ve years has been suggested on the basis of<br />
informal soundings of a large sample of archdeacons. 3<br />
This would suggest a rate of some 60 buildings per year,<br />
equal to the highest rate of the 1980s, and considerably<br />
higher than the current underlying rate, which is now in<br />
the low thirties. 4<br />
Despite this, to date the CCC have noted no increase in<br />
the number of churches entering the early stage of the<br />
redundancy pipeline. On the other hand, the Church<br />
Commissioners have recently noticed some uplift in the<br />
number of cases, though not yet to levels seen in the<br />
1980s. One diocesan of#cer commented that ‘redundancy<br />
is mentioned much more often than it used to be’.<br />
Congregations have their own idea about their<br />
prospects. Chelmsford diocese recently asked parishes<br />
about their hopes and dreams for the future: 5<br />
• more than one half of churches (57%) said growth;<br />
• At the other extreme, nearly one tenth of parishes<br />
(9%) listed survival as one of their hopes and dreams<br />
(if applied across the country, this would apply to<br />
about 1,200 parishes, containing perhaps 1,500<br />
church buildings).<br />
Another survey (1998), which had responses from a<br />
strati#ed sample of one quarter of Anglican churches,<br />
indicated that across England, three-quarters (76%) of<br />
Anglican church congregations expected to have grown by<br />
2010. (The commentator believes that churches <strong>we</strong>re<br />
optimistic in their responses.) On the other hand some<br />
4% expected to have closed by 2010 (if true, this would<br />
represent about 650 churches) and a further 7% (1100<br />
churches) expected to have declined. Unsurprisingly, the<br />
smallest churches <strong>we</strong>re the ones most likely to have a<br />
negative view of their future. 6<br />
In summary, <strong>we</strong> have three views about future rates of<br />
redundancy: the views of the archdeacons over the next<br />
#ve years, those of the Chelmsford parishes over an<br />
unspeci#ed period, and the survey of 1998 which asked<br />
parishes to look forward ten years. None of these suggests<br />
a rate of redundancy less than about 60 churches per year<br />
for the medium-term future, and some of the responses<br />
suggest a rather higher rate. That is, the rate going forward<br />
is predicted to be at least equal to the previous highest rate,<br />
seen for a few years only in the early and mid 1980s.<br />
Many of these new redundancies will be buildings of<br />
the highest quality, but with its current level of grant, the<br />
Churches Conservation Trust will be quite unable to<br />
absorb them (see previous discussion, box on page 21).<br />
Perhaps the time is right for a properly strati#ed,<br />
anonymous, formal survey of parishes’ own view of their<br />
future, possibly also asking them what changes would<br />
improve their prospects.<br />
6.2 Shaping the future<br />
Support and pressures<br />
To some extent, the future can be shaped. Churches are<br />
under pressure, but also receive support. The question is<br />
Table 6.1<br />
Some current pressures on churches: a personal view<br />
Pressure<br />
Affects which<br />
churches? Policy?<br />
Urban Rural<br />
Ageing, declining churchgoing yes yes<br />
Ageing church halls yes yes<br />
Health and safety, insurance,<br />
increase in litigation yes yes<br />
Disability requirements yes yes yes<br />
Effort for fund-raising, liaison with<br />
amenity societies, repair planning<br />
& management<br />
yes yes yes<br />
Archaeological costs yes yes yes<br />
Child / elderly protection<br />
compliance yes yes yes<br />
Risk of loss of VAT ‘reduction’ yes yes yes<br />
Reduction in available grants yes yes yes<br />
from Land Fill tax<br />
Legal restrictions on multi- use yes yes yes<br />
Preservation of pews in situ yes yes yes<br />
Price of repairs (skills shortage) yes yes ??<br />
Pressures on full-time leadership ?? yes<br />
Matched-funding pressures yes yes yes<br />
Deterioration in rural economies - yes<br />
Increase in ‘<strong>we</strong>ekending’ - yes<br />
Theft / vandalism / insurance yes yes<br />
‘People rather than buildings’ yes yes yes<br />
Statements of significance, future<br />
management plans yes yes yes<br />
which of the pressures on church buildings can be<br />
reduced, and what can be <strong>do</strong>ne to increase support.<br />
One interesting development has been the growing<br />
appreciation by dioceses that church buildings can be seen<br />
as an asset. This is particularly the case when they are<br />
vie<strong>we</strong>d on an area basis, with different church buildings<br />
playing to their strengths, one supporting another.<br />
Table 6.1 lists some of the pressures of which I am<br />
aware. The extreme right hand column indicates whether<br />
these could be ameliorated by changes in policy. Many<br />
could.<br />
Conversely, there is evidence, some of it already<br />
discussed, that congregations are increasingly receiving<br />
support of one type or another, as they continue to reach<br />
into their wider communities. I have listed some of these<br />
means of support in Table 6.2.<br />
Ho<strong>we</strong>ver, smaller churches may not possess the<br />
organisational capacity to take up some of the available<br />
support, and may anyway require more radical<br />
intervention. In general, policy development in this area<br />
should perhaps distinguish bet<strong>we</strong>en general support for<br />
congregations, and policies targeted at churches very close<br />
to redundancy.<br />
The remainder of this section discusses some of these<br />
general means of support.
HOW DO WE KEEP OUR <strong>PARISH</strong> <strong>CHURCHES</strong>? • KEEPING CHURCH BUILDINGS IN FUTURE 51<br />
VIEWS FROM THOSE WHO VISIT MANY RURAL <strong>CHURCHES</strong><br />
I asked three people who study church buildings, and who visit<br />
them in large numbers, to give their personal opinions, based on<br />
their discussions with the many vicars, churchwardens and church<br />
members with whom they have come into contact.<br />
Although they believe that the current physical condition of<br />
church buildings is good (see box on page 26), I am afraid that their<br />
views of the likely future of these buildings <strong>we</strong>re negative.<br />
A student of rural churches, carrying out a<br />
systematic survey, visiting many hundreds each year<br />
I’ve just come back from visiting a group of churches. I<br />
met several old people cutting the churchyard grass – two<br />
of them pondered what would happen once they died as<br />
no-one else wants to <strong>do</strong> the job...<br />
While churches have always struggled along, they’ve<br />
managed because they could pretty much <strong>do</strong> what they<br />
liked with respect to repairs. Unfortunately I think that<br />
conservation bodies are now making things far more<br />
dif#cult. If churches are to exist and function then these<br />
tight guidelines need to be relaxed.<br />
It’s not just outside bodies though. Another problem is<br />
that many PCCs won’t relax the use of church buildings.<br />
Some have – realising that the only way to <strong>keep</strong> the<br />
church alive is to have it open and to have it used for<br />
functions other than the one-h<strong>our</strong> Sunday service. Others<br />
shut their <strong>do</strong>ors and have the Sunday Club mentality – at<br />
their peril.<br />
Based on talking with the people who use these<br />
buildings every day, I believe overall that the Anglican<br />
church will continue to shrink and within 50 years <strong>we</strong> will<br />
see huge numbers of churches disappear forever. Unless<br />
there is some radical re-think or change of circumstances,<br />
the future is very bleak indeed.<br />
We need to get away from the ‘static’ mentality – one<br />
should not try to preserve buildings in some time bubble<br />
where they never change and yet have to be used as<br />
working buildings. While conservation bodies fear that <strong>we</strong><br />
may lose these buildings because of some Victorian<br />
holocaust of ‘restoration’, <strong>we</strong> risk losing them anyway.<br />
This may sound like scaremongering, but I’ve reached<br />
these conclusions having talked to many people. Seven<br />
years ago I started my survey thinking everything was #ne<br />
and these buildings would always be here. Many, many<br />
hundreds of country churches later, I really can’t say that<br />
they will.<br />
A view from Suffolk<br />
Let me give you a break<strong>do</strong>wn of the ground here in<br />
Suffolk. We have 505 medieval churches, of which 464 are<br />
still in the care of the Church of England. There are about<br />
40 more nineteenth- and t<strong>we</strong>ntieth-century Anglican<br />
churches (fe<strong>we</strong>r than in other counties of similar size) so<br />
lets call it just over 500.<br />
There are something over 22,000 Anglicans in church<br />
on Sunday in Suffolk. I make that about 45 churchgoers<br />
per church. But the problems begin to appear when you<br />
are on the ground. Those 22,000 worshippers are actually<br />
concentrated in a surprisingly small number of<br />
churches, mainly in the big f<strong>our</strong> towns.<br />
According to the Suffolk Rural Development<br />
Council, Suffolk has more than 250 settlements with<br />
less than 100 people. Almost all of these have a medieval<br />
parish church. Some of these churches are very<br />
signi#cant; nationally signi#cant; indeed, internationally<br />
so. One such church I can think of has a sevensacrament<br />
font with original col<strong>our</strong>ed gesso work,<br />
carved roof with original col<strong>our</strong>ing, screen with painted<br />
saints, etc., etc. – population 100, average congregation<br />
t<strong>we</strong>lve. Another church, home to glorious thirteenthand<br />
f<strong>our</strong>teenth-century wall paintings: congregation<br />
now seven and the youngest person is 73.<br />
You visit churches in apparently <strong>we</strong>althy, lively<br />
villages, where the church is declining and decaying,<br />
win<strong>do</strong>ws broken, locked from one Sunday to the next.<br />
Balanced against the lack of income is the amount of<br />
voluntary work provided by churchwardens, treasurers,<br />
PCC members, and the like. This is invaluable, and they<br />
are wonderful, tireless, tolerant people.<br />
One churchwarden I recently spoke to said she<br />
volunteered because she felt she had a pastoral role to<br />
play; within a <strong>we</strong>ek she found herself having to<br />
spearhead a drive for tens of thousands of pounds. She<br />
raised the money within a year, by the way.<br />
But the churchwarden at another church, a parish<br />
with a recent history of raising very large sums of<br />
money, tells me that they are now <strong>do</strong>wn to t<strong>we</strong>lve<br />
people. “We will carry on as long as <strong>we</strong> can”, he said.<br />
We would appear to be at the edge of an abyss...<br />
A frequent visitor to churches<br />
Often there is no-one to #ght for the individual church<br />
as the incumbent has a handful to look after, and<br />
anyway they get no training in the care or use of historic<br />
buildings. And not much on church history.<br />
Where someone is interested in the building they can<br />
usually drum up res<strong>our</strong>ces from the local and wider<br />
community.<br />
Compare one church I know where money is no<br />
object (they are even building a thatched loo) with<br />
another church nearby where there is a major <strong>we</strong>althy<br />
lan<strong>do</strong>wner, but where I would not give the church<br />
more than a few years because there is so little money<br />
spent on it.<br />
I suspect that within 20 years a large percentage of<br />
churches will be closed – possibly as high as 25% – and<br />
people who think as I <strong>do</strong> will no longer be enc<strong>our</strong>aged<br />
to raise money for what seems a hopeless task.<br />
We <strong>do</strong> not know whether these views re$ect a new trend, or<br />
whether similar opinions would have been expressed by previous<br />
generations, but have not in fact come to fruition. The death of<br />
the rural church has certainly been forecast before. But these<br />
comments <strong>do</strong> make uncomfortable reading.
52 TREVOR COOPER • HOW DO WE KEEP OUR <strong>PARISH</strong> <strong>CHURCHES</strong>? • 2004 • www.ecclsoc.org<br />
Table 6.2<br />
Some current areas of support for church buildings:<br />
a personal view<br />
Support<br />
Supports which churches?<br />
Urban Rural Small?*<br />
EH/HLF grants yes yes yes<br />
Expert support for grant<br />
application and fund-raising<br />
yes** - yes<br />
‘Maintain <strong>our</strong> heritage’ roll-out<br />
and EH piloting of smaller yes yes ?<br />
grants<br />
Friends groups yes yes -<br />
Church t<strong>our</strong>ism ? yes yes<br />
Government interest in rural<br />
communities<br />
- yes yes<br />
Funding for heritage /<br />
education / community use<br />
yes yes -<br />
Small-scale additional use<br />
(kitchens etc.)<br />
yes yes -<br />
Large-scale additional use<br />
(major conversions)<br />
yes - -<br />
Urban regeneration yes - -<br />
*Available (in practice) to small congregations?<br />
**Limited to two urban dioceses only at present<br />
Friends Groups<br />
There is no central register of ‘Friends’ of churches. A<br />
search of the Charity Commission <strong>we</strong>bsite reveals several<br />
hundred such groups, representing perhaps 2% or 3% or<br />
churches. I cannot tell <strong>how</strong> many other Friends groups<br />
there are which are not separately registered but operate<br />
under the control of the Parochial Church Council.<br />
Of the groups registered with the Commission, nearly<br />
one half (47%) <strong>we</strong>re founded in the 1990s and a further<br />
20% in the last three years, suggesting a sharp rise of<br />
interest in this form of involvement (the alternative,<br />
which I think unlikely, is that most groups only last a few<br />
years, and the results are due to survival bias).<br />
The income of these groups is not large, typically being<br />
a few thousand pounds per year. Nevertheless, this sum is<br />
comparable to the typical annual spend on repairs of many<br />
churches. Friends groups may thus provide a steady<br />
income stream to help with the more routine repairs, and<br />
(possibly) a body of people inclined to respond to appeals<br />
for more major work. Of c<strong>our</strong>se, it is likely that only the<br />
more go-ahead congregations will form such groups.<br />
I carried out a small-scale survey of Friends (see box).<br />
Such a small number of self-selected responses is not<br />
representative, but may be indicative of the range of<br />
responses to be found from a more systematic survey. The<br />
key points to emerge <strong>we</strong>re:<br />
• There is no central help point for Friends groups.<br />
• Some Friends groups hold very frequent activities and<br />
are clearly a force for social cohesion in their own right.<br />
• The relationship with the Parochial Church Council<br />
and clergy needs to be handled carefully.<br />
• Friends groups are seen as a way of allowing the local<br />
community to play a part in the maintenance of the<br />
church, without overt religious commitment.<br />
Table 6.3<br />
How <strong>do</strong> you think of y<strong>our</strong> local church/chapel?<br />
(adults, Great Britain, October 2003)<br />
Place of worship 83%<br />
Quiet place or sanctuary 73%<br />
Local landmark 59%<br />
Social / community venue 56%<br />
Historic place 53%<br />
S<strong>our</strong>ce: CoE, from ORB survey carried out on behalf of<br />
EH and CoE, October 2003. Sample size: 1004. See<br />
Bibliography.<br />
One group explicitly stated that an advantage of the<br />
arrangement is that funds held by the Friends are not<br />
necessarily assessed when grants are being allocated.<br />
Conversely, one archdeacon mentioned to me the<br />
undesirable possibility that Friends groups could be used<br />
to minimise the church’s contribution to the central<br />
diocesan fund, thus harming less <strong>we</strong>ll-off churches.<br />
In general, there would seem to be room for this form<br />
of voluntary self-help to be enc<strong>our</strong>aged.<br />
Interest in heritage<br />
There is evidence that the heritage and townscape value of<br />
churches is appreciated by the general public. In a recent<br />
survey, nearly six out of ten (59%) said they see their local<br />
church or chapel as a local landmark and, and more than<br />
#ve out of ten (53%) as a historic place (see Table 6.3).<br />
Thus the decline in public religious observance has<br />
happened in parallel with another major social shift, the<br />
growth of interest in ‘heritage’. This can be seen by<br />
comparing the trends in National Trust membership and<br />
membership of church electoral rolls (Graph 6.1). The<br />
#gures are not directly comparable, as one includes adults,<br />
one <strong>do</strong>es not: but the difference in trend is clear.<br />
Can this shift in public attitudes be harnessed to resolve<br />
the issues raised by the large CoE network of historic<br />
buildings? There are some enc<strong>our</strong>aging signs: for<br />
example, the Local Heritage Initiative has made more than<br />
one hundred grants to church-centred activities, about<br />
one #fth of the total grants awarded. 7<br />
Another way forward may be via t<strong>our</strong>ism.<br />
Graph 6.1 Church electoral roll and National Trust<br />
membership as proportions of their respective candidate<br />
populations<br />
S<strong>our</strong>ces: Church Statistics 2001; National Trust<br />
Candidate population for electoral roll is over-sixteen English population;<br />
for National Trust is all-age English, Welsh and Northern Irish population<br />
percent<br />
14.0<br />
12.0<br />
10.0<br />
8.0<br />
6.0<br />
4.0<br />
2.0<br />
0.0<br />
1920 1930 1940 1950 1960 1970 1980 1990 2000 2010<br />
church electoral roll<br />
National Trust
HOW DO WE KEEP OUR <strong>PARISH</strong> <strong>CHURCHES</strong>? • KEEPING CHURCH BUILDINGS IN FUTURE 53<br />
A search was carried out on the Charity<br />
Commission <strong>we</strong>bsite for Friends groups, using<br />
the search phrase ‘Friends of St’. Of the several<br />
hundred groups found in this way, some 46<br />
provided an email address. A questionnaire was<br />
emailed to these groups; eighteen responses <strong>we</strong>re<br />
received. Such a small number of self-selected<br />
responses can make no claim to be representative,<br />
but the ans<strong>we</strong>rs may indicate the range of<br />
responses which would be received from a more<br />
representative sample.<br />
Below, my comments are in italics, verbatim<br />
replies are prefaced by a bullet.<br />
Question: Please give some indication of<br />
the total number of adults who attend<br />
services on a typical Sunday (add up<br />
attendance at all services).<br />
Ans<strong>we</strong>rs ranged from single #gures up to<br />
several hundred. Most <strong>we</strong>re bet<strong>we</strong>en 20 and 80.<br />
Question: Was there some particular<br />
event which led to the Friends being<br />
set up?<br />
Somewhat to my surprise, there was not<br />
always such an event; groups had sometimes<br />
been founded simply because there was felt to be<br />
the need for wider support.<br />
• The church organ needed replacement.<br />
• The decline of membership of the<br />
church and possible closure in the 1980s.<br />
• No, <strong>we</strong> just felt that <strong>we</strong> should<br />
maintain <strong>our</strong> church.<br />
• Falling numbers attending church out<br />
of the t<strong>our</strong>ist season means lo<strong>we</strong>r funds<br />
for church maintenance. The church is at<br />
the very centre of the village, which<br />
together with the literary connections in<br />
the village leads to it being a t<strong>our</strong>ist focal<br />
point. Business people within the village<br />
recognise the importance of the church to<br />
the t<strong>our</strong>ist industry – if the church <strong>we</strong>re<br />
to fall into disrepair then their business<br />
would soon disappear!<br />
• Only the normal one of the constant<br />
up<strong>keep</strong> of a medieval church. Desperation<br />
at the #nancial burden of a very old but<br />
splendid building on a dwindling<br />
population and recognition that the<br />
church as a building is a focal point of the<br />
village.<br />
• People of all beliefs outside the regular<br />
and ageing congregation want to retain the<br />
last community building in the village.<br />
Question: In setting up and running the<br />
Friends, did you or <strong>do</strong> you receive help<br />
(formal or informal) from any other<br />
body? If so, who, and what sort of help?<br />
In setting up, a few received help from their<br />
local cathedral’s Friends, or praised the Charity<br />
Commission for the help received on charity law<br />
and practice. There was positive mention of the<br />
book on Friends produced by Canterbury diocese<br />
(details in the Bibliography).<br />
A QUESTIONNAIRE TO FRIENDS GROUPS<br />
Question: In practice, are the people who<br />
administer and run the Friends largely the<br />
same people who are involved in the life<br />
of the church?<br />
The groups had committees which included ex<br />
of#cio church members, but they <strong>we</strong>re keen to<br />
be seen as separate entities. For example:<br />
• About half and half. The<br />
secretary/treasurer is an atheist. Two of<br />
the other six members are regular<br />
churchgoers and the other f<strong>our</strong> go now<br />
and again.<br />
• We see <strong>our</strong>selves as a mainly heritage<br />
organization and <strong>we</strong> think that this fact,<br />
together with <strong>our</strong> wide spectrum of<br />
trustees [only three out of t<strong>we</strong>lve ex of#cio<br />
from the church] will enc<strong>our</strong>age wider<br />
support.<br />
Question: As <strong>we</strong>ll as subscriptions, what<br />
other fund-raising <strong>do</strong> you carry out?<br />
As expected, there is a wide range of<br />
fund-raising events; more surprising was the<br />
level of activity of some groups, which are clearly<br />
a force for social cohesion in their own right.<br />
• We try and have one fund-raising event<br />
per month including concerts, talks,<br />
barbecues, drinks evenings, old car s<strong>how</strong>s<br />
and quizzes.<br />
• Annual trip to place of interest, talks,<br />
entertainment by external players.<br />
• A Wild West evening, medieval<br />
banquet, ‘Bond’ night. Twice-<strong>we</strong>ekly<br />
bonus-ball lottery for members. Great<br />
group for social life in the village.<br />
• An annual lecture.<br />
• Suppers, open gardens, coffee<br />
mornings, fêtes, sales, concerts, parish<br />
barbecue, sell postcards of the church.<br />
• Visit to a local stately home, visit to<br />
theatre, <strong>do</strong>nated Christmas tree lights,<br />
circle of people making kneelers (which<br />
are sponsored), ran raf$e at Harvest<br />
Festival. Started the village helpline (there<br />
is no shop or surgery in the village) and<br />
provide transport in an emergency.<br />
• We run the usual range of quiz nights,<br />
concerts, merchandising T-shirts,<br />
postcards, limited edition prints of<br />
paintings of the church and the village.<br />
The single most successful event is a<br />
sponsored abseil of the to<strong>we</strong>r of the<br />
church. We also have a good take up for<br />
day excursions to cathedrals and stately<br />
homes in the area. This helps us to recruit<br />
outside the membership of the<br />
congregation.<br />
Question: Please tell us anything else,<br />
positive or negative, which you think<br />
would help us to understand the potential<br />
of Friends groups, and the practical<br />
dif#culties they face.<br />
The ans<strong>we</strong>rs here <strong>we</strong>re almost entirely to<br />
<strong>do</strong> with the need to reach out beyond the<br />
church congregation, and to maintain good<br />
but arms-length relationships with those<br />
formally responsible for the church.<br />
• We have to take great care to <strong>keep</strong><br />
good relations with the PCC whilst<br />
protecting <strong>our</strong> independence. This is so<br />
that <strong>we</strong> are seen not as a Church<br />
organisation but as a group interested in<br />
the preservation of <strong>our</strong> wonderful<br />
church and its environment which is so<br />
important to the village as a whole. This<br />
broadens <strong>our</strong> membership base. The<br />
PCC requests <strong>our</strong> help when needed<br />
and <strong>we</strong> decide independently whether<br />
to help or not.<br />
• Responsibility for running the parish<br />
rests with the parishioners – the Friends<br />
merely give a little help.<br />
• Clergy possibly <strong>do</strong>n’t understand a<br />
‘Friends’ that is set up with the<br />
charitable objective of restoration of the<br />
church building, instead of supporting<br />
the life of the church (the remit of the<br />
PCC really) and feel resentful, without<br />
understanding that members have<br />
speci#cally chosen to support that<br />
aspect of the church and are not the<br />
faith group.<br />
• Some antagonism from people who<br />
think <strong>we</strong> are raising money to pay the<br />
diocesan quota.<br />
• The objective was to tap a wider<br />
catchment than the church itself, yet<br />
membership remains principally<br />
concentrated among the congregation<br />
and those living near the church.<br />
Perhaps wider membership must be<br />
built over the years. [These comments<br />
from a group less than three years old.]<br />
• We had a grand launch in the church<br />
with a video/slide s<strong>how</strong> and a children’s<br />
painting competition. This was<br />
organised through the primary schools<br />
and was a good vehicle for getting<br />
people into the church.<br />
• Our group tries to act as a link<br />
bet<strong>we</strong>en the church and the village.<br />
The whole idea is to link the<br />
congregation with the community.<br />
There is a dif#cult balance. Who<br />
decides and <strong>how</strong> <strong>do</strong> <strong>we</strong> decide what <strong>we</strong><br />
should buy for the church? We are one<br />
step away from the congregation and<br />
this suits some people but <strong>we</strong> have to<br />
ensure that <strong>we</strong> are not the ‘opposition’.<br />
The only community centre in <strong>our</strong><br />
village is the church room. If <strong>we</strong> lost<br />
the church, <strong>we</strong> would lose the church<br />
room.
54 TREVOR COOPER • HOW DO WE KEEP OUR <strong>PARISH</strong> <strong>CHURCHES</strong>? • 2004 • www.ecclsoc.org<br />
CHURCH TOURISM INITIATIVES<br />
There are a number of initiatives for<br />
promoting t<strong>our</strong>ism to local churches, both<br />
CoE and those of other denominations.<br />
The oldest scheme is the Church<br />
T<strong>our</strong>ism Network in the diocese of<br />
Lincoln ()<br />
which has been running in one form or<br />
another since the early 1990s. It produces<br />
various publications and runs training<br />
sessions. Churches which participate in<br />
the scheme (about 70 of all<br />
denominations) have been clustered into<br />
geographical groupings, so that t<strong>our</strong>ists<br />
can choose the area which takes their<br />
fancy, and are not overwhelmed by a<br />
seemingly endless list of possibilities.<br />
Modern and urban buildings are included,<br />
as <strong>we</strong>ll as medieval rural ones. A revised<br />
scheme, involving around 300 churches,<br />
comes into operation in early 2004.<br />
Starting from the cathedral, visitors will<br />
choose one of nine larger churches to visit<br />
next, and from there will have further<br />
choices, as they explore the churches in a<br />
local area.<br />
Another initiative is more recent. The<br />
North Yorkshire Church T<strong>our</strong>ism<br />
Initiative () started work in 2002. It<br />
took longer than expected to put<br />
everything in place, but is now fully under<br />
way, with initial funding for three years.<br />
There are approximately 250 churches<br />
participating, organised into seven areas.<br />
Initially 4000 lea$ets <strong>we</strong>re printed for<br />
each area, and demand was such that they<br />
had to be reprinted within six <strong>we</strong>eks. The<br />
aim of the initiative is to increase church<br />
t<strong>our</strong>ism by 25%, with one half of the<br />
increase coming from outside North<br />
Yorkshire. To learn more about visitors,<br />
church visitors’ books are being analysed,<br />
and those using the area lea$ets are<br />
enc<strong>our</strong>aged to #ll in a short questionnaire.<br />
A rather different scheme is Go West,<br />
launched in 2002. This has a linear<br />
pattern, following the River Teme<br />
() as it $ows<br />
eastward through the dioceses of<br />
Worcester and Hereford, passing through<br />
Knighton and Ludlow. About ten years<br />
ago an earlier scheme in this area got off to<br />
a false start, and the latest scheme has<br />
learnt the lessons of this. It is more<br />
focused, with a heavy emphasis on<br />
involving local churches and<br />
communities. Local Support Teams<br />
concentrate on particular parts of the<br />
valley, and there is an overall Steering<br />
Group formed of professional volunteers.<br />
A pack of promotional lea$ets called<br />
‘Wanderer’s Companions’ have been<br />
produced, describing different sections of<br />
the valley. The overall vision has a<br />
different $av<strong>our</strong> to some other schemes,<br />
aiming to ‘develop sustainable t<strong>our</strong>ism<br />
activities that enhance the visitor’s<br />
understanding and enjoyment of the<br />
countryside’, as <strong>we</strong>ll as contributing to<br />
local economic and social <strong>we</strong>ll being.<br />
One of the elements is the use of<br />
historic church buildings as ‘places of<br />
shelter, re$ection, prayer and<br />
discussion’.<br />
These are just three initiatives. There<br />
are around a <strong>do</strong>zen others listed on the<br />
<strong>we</strong>bsite of the Churches T<strong>our</strong>ism<br />
Association (). These are mostly in<br />
the form of packs of ‘church trail’<br />
lea$ets, often produced in cooperation<br />
bet<strong>we</strong>en church and secular agencies.<br />
Many of these schemes are funded<br />
from secular s<strong>our</strong>ces, re$ecting the<br />
view that enc<strong>our</strong>aging people to visit<br />
churches bene#ts t<strong>our</strong>ism in general.<br />
Alongside the development of these<br />
trails has been a growing appreciation of<br />
the need to have better explanatory<br />
material in the churches.<br />
So there is a signi#cant and growing<br />
range of activity at a local level, though<br />
not of the scale of Scotland’s churches<br />
scheme, where church t<strong>our</strong>ism is<br />
supported centrally, with 800<br />
participating churches.<br />
T<strong>our</strong>ism<br />
Major churches and cathedrals are amongst the top t<strong>our</strong>ist<br />
attractions in the land. In the year 2000, York Minster,<br />
Canterbury Cathedral and Westminster Abbey <strong>we</strong>re<br />
second, third and f<strong>our</strong>th in numbers of visitors to historic<br />
properties, beaten only by the To<strong>we</strong>r of Lon<strong>do</strong>n. In that<br />
year, 19 of the 50 most visited historic properties <strong>we</strong>re<br />
churches or cathedrals. 8<br />
The importance of these high-volume sites is<br />
appreciated by the t<strong>our</strong>ist authorities, who monitor<br />
attractions with more than 20,000 visitors per year. In the<br />
past less attention has been paid to the t<strong>our</strong>ist potential of<br />
the parish church, because of the relatively low volumes at<br />
each church. Yet the contribution which historic churches<br />
make to t<strong>our</strong>ism is perhaps the most po<strong>we</strong>rful economic<br />
argument for their preservation – although I am not aware<br />
that anyone has yet <strong>do</strong>ne the sums.<br />
There is now growing activity in this area (see box),<br />
with best practice being promoted by the Churches<br />
T<strong>our</strong>ism Association (though it has no full-time national<br />
of#cer). Many dioceses now have a designated Church<br />
T<strong>our</strong>ism of#cer. The role is often part-time, sometimes<br />
very part-time indeed. Ho<strong>we</strong>ver in a number of cases it is<br />
a full-time post, often funded externally with the diocese<br />
contributing in kind, though one problem with this form<br />
of funding is its limited timescale, often only three years,<br />
and the emphasis on innovation rather than continuity,<br />
the opposite of what is required in this case.<br />
In deciding whether and <strong>how</strong> to make their church<br />
buildings available for visitors, churches face signi#cant<br />
questions of theology and mission. These are <strong>we</strong>ll outside<br />
<strong>our</strong> scope: but, in passing, I cannot resist pointing out that<br />
one survey of rural church visitors s<strong>how</strong>ed that nearly<br />
seven in ten (69%) of those visitors who #lled in the<br />
questionnaire thought that having somewhere quiet to<br />
pray was important for their visit, and that this was many<br />
more than those (48%) who regarded a toilet as<br />
important. 9<br />
How much money <strong>do</strong>es t<strong>our</strong>ism bring directly to<br />
churches? For most churches it would not be economic to<br />
charge entrance fees because of the relatively low volumes<br />
and the low fee that could be charged. Many churches,<br />
anyway, would want not want to charge for admission.<br />
Revenue from visitor <strong>do</strong>nations is another s<strong>our</strong>ce, but is<br />
likely to be low, running at 20p per visitor according to a<br />
1999 survey. 10 This can be boosted by selling guidebooks,<br />
candles, and small gifts. Some churches sell refreshments,<br />
or market their concerts proactively. I have not managed<br />
to #nd out <strong>how</strong> much income may be obtained on average<br />
from each visitor in these ways. (The research must surely<br />
have been <strong>do</strong>ne, and I would <strong>we</strong>lcome information on<br />
the point.)
HOW DO WE KEEP OUR <strong>PARISH</strong> <strong>CHURCHES</strong>? • KEEPING CHURCH BUILDINGS IN FUTURE 55<br />
More fundamentally, <strong>how</strong> much <strong>do</strong> church buildings<br />
contribute towards the t<strong>our</strong>ist industry?<br />
It is instructive to compare the position of churches<br />
with that of privately-owned historic houses (see<br />
Table 6.4). The Historic Houses Association has argued<br />
that the eleven million visitors that they generate bring<br />
business worth £1.6bn pounds per year to the wider<br />
economy – that is, businesses outside the historic house<br />
itself. As it happens, the #gure is based on a<br />
misunderstanding (which has unfortunately been<br />
transmitted quite widely), and overstates the case – my<br />
amateur estimate (to be treated with suspicion) is that the<br />
bene#t to the wider economy might be £700m per year. 11<br />
But this is still a substantial amount. Given that the<br />
number of visits to churches is likely to be more than to<br />
historic houses – in the box ‘Visitors to Churches’ I argue<br />
that there are probably bet<strong>we</strong>en ten and #fty million visits<br />
to parish churches a year – then the contribution of<br />
church t<strong>our</strong>ism is also likely to be substantial, even though<br />
the time spent at each church is no <strong>do</strong>ubt less than at each<br />
historic house.<br />
How many visitors?<br />
We <strong>do</strong> not have any reliable #gure for the<br />
number of visits made to parish churches<br />
each year. Various #gures are quoted – for<br />
example 36 million visitors per year – but<br />
they are all in the nature of informed<br />
guesstimates.<br />
This is not surprising. Counting<br />
visitors is very dif#cult, because the great<br />
majority of churches <strong>do</strong> not have any<br />
mechanism for monitoring the number of<br />
people coming in and out. The normal<br />
proxy is to count signatures in the visitors’<br />
book, and multiply by ten, or a similar<br />
number. This method is certainly better<br />
than nothing, though it will become<br />
increasingly unreliable if churches are<br />
enc<strong>our</strong>aged to ask visitors to sign.<br />
As is to be expected, there is enormous<br />
variation in the number of visitors<br />
received by churches. For example, in<br />
Lincoln diocese, a count was taken of the<br />
number of signatures in visitors’ books in<br />
a sample of nearly 40 churches for the<br />
year starting February 2001. Multiplying<br />
by ten, more than half of the churches had<br />
bet<strong>we</strong>en 200 and 1,000 visitors during the<br />
year. (This assumed that where a family<br />
signed there <strong>we</strong>re f<strong>our</strong> individuals, and<br />
where a group signed there <strong>we</strong>re six<br />
individuals.) The least-visited church had<br />
50 visitors (over the entire year), the<br />
most-visited had 2,500. Of the nearly<br />
forty churches, the busiest eight (20%)<br />
had one half of the visitors. The average<br />
was about 700 visitors per year, but the<br />
sample may not have been representative,<br />
and not too much attention should be<br />
paid to this. The #gures <strong>do</strong> indicate the<br />
very large range of visitors which may be<br />
expected (and perhaps also the different<br />
degrees of prominence afforded the<br />
visitors’ book!).<br />
In the North Yorkshire Church<br />
T<strong>our</strong>ism Initiative, interim #gures for a<br />
nine-month period suggest an average of<br />
about 4000 visitors per church per year<br />
(after multiply the signatures by ten and<br />
VISITORS TO <strong>CHURCHES</strong><br />
correcting for seasonality).* This is<br />
considerably higher than the Lincoln<br />
#gures, but the Yorkshire churches may<br />
have included a different mix of churches.<br />
Finally, the CCT estimates it has about<br />
one quarter of a million visitors to its 330<br />
mostly rural buildings, implying an<br />
average of about 750 per building.<br />
At this stage, all <strong>we</strong> can say is that the<br />
average number of visitors per year to the<br />
average parish church is probably<br />
something bet<strong>we</strong>en 700 and 4000. If this<br />
applies across all listed churches, this<br />
implies (approximately) bet<strong>we</strong>en 10m and<br />
50m visitors per year.<br />
*I corrected for seasonality using the<br />
Lincoln seasonal pattern. Full-year #gures for<br />
Yorkshire will be available later in 2004. Figures<br />
represent those three-quarters of churches who<br />
have provided data so there may be some<br />
self-selection towards the more-visited<br />
churches. In addition, some emphasis has been<br />
placed on making the visitors’ book easily<br />
available, so the times-ten multiplier may<br />
exaggerate.<br />
Who are the visitors?<br />
One survey of visitors to rural churches<br />
(see note 9 to this section) threw up three<br />
interesting features. (The survey was a<br />
self-selected sample, so the results need to<br />
be treated with caution. There <strong>we</strong>re<br />
12,700 questionnaires returned, with 165<br />
churches taking part.)<br />
First, visitors are far more likely than<br />
the general population to be regular<br />
churchgoers. Some 56% of church visitors<br />
attend church at least once a month, as<br />
against a #gure of perhaps 10% for the<br />
whole population. The challenge must be<br />
to widen the support base for church<br />
t<strong>our</strong>ism amongst those who are not<br />
regular church goers.<br />
Secondly, six out of ten visitors (62%)<br />
came from more than 30 miles away, and<br />
another one in ten (12%) from outside the<br />
UK. This con#rms that church t<strong>our</strong>ism is<br />
attractive to some people as a way of<br />
spending holiday time, and is therefore<br />
likely to have economic value.<br />
Finally, and to my surprise, a very<br />
high proportion of people visiting a<br />
church will have already visited, or be<br />
going to visit, other churches within a<br />
seven day period (for purposes other<br />
than worship). That is, many church<br />
t<strong>our</strong>ists are taking their church t<strong>our</strong>ism<br />
seriously. My interpretation of the<br />
statistics** is that only about 2 out of<br />
ten (20%) people will be visiting one<br />
and only one church during a seven day<br />
period, and many of the others will be<br />
visiting f<strong>our</strong> or more. This deserves<br />
further investigation.<br />
**The statistics s<strong>how</strong> that two out of ten<br />
people (18%) had already visited three or<br />
more other churches during the preceding<br />
seven days (not counting visits for worship),<br />
one out of ten (12%) had already visited two<br />
others, and another two out of ten (21%) had<br />
already visited just one other. The<br />
questionnaire was taken at a ran<strong>do</strong>m<br />
moment in people’s church visiting, and<br />
some of those #lling in the questionnaire<br />
would go on to visit other churches, and I<br />
have allo<strong>we</strong>d for this in my interpretation of<br />
the #gures.<br />
Do visitors pose a risk to the<br />
church buildings?<br />
There is not the space to discuss fully<br />
here the risks of opening a church. One<br />
current view is that leaving a church<br />
open reduces the likelihood of<br />
vandalism and theft, by a factor which is<br />
variously quoted as being bet<strong>we</strong>en three<br />
and six. An open church is more<br />
frightening to a potential thief, who<br />
fears he may be disturbed in action. I<br />
believe that one major insurer charges<br />
equal premiums whether churches are<br />
locked or unlocked during daylight<br />
h<strong>our</strong>s.<br />
S<strong>our</strong>ces: personal communications, and Rural<br />
Visitors (referenced in note 9, below), pages<br />
17, 20, 21. See also the Bibliography.
56 TREVOR COOPER • HOW DO WE KEEP OUR <strong>PARISH</strong> <strong>CHURCHES</strong>? • 2004 • www.ecclsoc.org<br />
Table 6.4<br />
T<strong>our</strong>ism to private historic houses and CoE listed churches (2001/2)<br />
Time spent<br />
at<br />
attraction,<br />
minutes<br />
Number of<br />
visitors,<br />
millions<br />
Annual<br />
contributor to<br />
wider<br />
economy<br />
from visitors<br />
Number of<br />
attractions<br />
Private historic houses 700 1 133 2 11 £1.6bn 3<br />
CoE listed churches 12,000 4 ?? 20 5 10–50 6 ???<br />
S<strong>our</strong>ces: HHA, 2001: ‘Briefing paper from the Historic Houses Association: June 2001’ available at<br />
; Key facts for visitor attractions 2002:<br />
available at (note ‘//’‘ after ‘uk’)<br />
Notes<br />
1. England, Wales and Scotland. Of these,<br />
only about one half (332) open regularly to the<br />
public; a further 355 provide some form of<br />
public access (HHA, 2001).<br />
2. From Key facts, 2002.<br />
3. From HHA, 2001. Probably an over-estimate.<br />
See text.<br />
4. England. See Section 2 of this paper.<br />
5. An estimate. At greater churches, the<br />
average time spent is 66 minutes (Key facts<br />
2002).<br />
6. My estimate. See box ‘Visitors to churches’.<br />
Furthermore, an enjoyable visit to a church, and the<br />
sense that there is more to see, may lead to the visitor<br />
returning to the area. So there is a multiplying effect. As<br />
the North Yorkshire Church T<strong>our</strong>ism Initiative puts it<br />
(personal communication):<br />
As churches are rarely the catalyst for a visit to a particular<br />
area it is extremely dif#cult to quantify the direct<br />
economic bene#ts for the local economy of promoting<br />
church t<strong>our</strong>ism. We feel, <strong>how</strong>ever, that by <strong>we</strong>lcoming<br />
visitors into churches <strong>we</strong> will add value to their stay and<br />
that this will enc<strong>our</strong>age longer and repeat visits as <strong>we</strong>ll as<br />
potentially enc<strong>our</strong>aging a niche market of church visitors<br />
to North Yorkshire.<br />
In addition, churches help t<strong>our</strong>ism indirectly by<br />
contributing to the quality of the environment. That is,<br />
even for those who <strong>do</strong> not visit churches, the presence of<br />
attractive churches and churchyards may be a factor<br />
enc<strong>our</strong>aging them to visit an area (see Map 2.1). Based on<br />
recent research, the National Trust has estimated that<br />
‘some 40% of employment in t<strong>our</strong>ism depends directly on<br />
a high quality environment’, rising to bet<strong>we</strong>en 60% and<br />
70% in a rural context, the ‘environment’ here referring<br />
both to countryside and the built environment. 12 It could<br />
<strong>we</strong>ll be argued that many churches, and the churchyards<br />
surrounding them, contribute signi#cantly to the quality<br />
of the environment, so that churches are assisting t<strong>our</strong>ism<br />
even when they are not the destination of visitors.<br />
So if churches help t<strong>our</strong>ism, <strong>how</strong> <strong>do</strong>es t<strong>our</strong>ism help church<br />
buildings? If church buildings are bringing general bene#t –<br />
if, to put it crudely, the pub sells more lunches, and more<br />
people stay for bed and breakfast – <strong>how</strong> are churches to<br />
capture their fair share of this, to reward the voluntary<br />
time and effort they are putting in, and the fact they spend<br />
money maintaining the building?<br />
I understand that one church t<strong>our</strong>ism scheme is<br />
thinking that churches might become actively engaged in<br />
running heritage t<strong>our</strong>s. Another development has been<br />
that of ‘Hidden Britain Centres’, presenting local assets in<br />
a coherent way to the t<strong>our</strong>ism market; some of these are<br />
being developed around or by the parish church.<br />
In general, <strong>how</strong>ever, from what I have seen and heard, I<br />
am not convinced that churches <strong>do</strong> receive a decent return<br />
for their endeav<strong>our</strong>s. At the local level, and to a limited<br />
extent, the mechanisms are in place. A Friends group can<br />
provide a route for businesses to channel money into the<br />
church building on a goodwill basis; but the number of<br />
such groups, though growing, is still small. In rural areas,<br />
parish councils (the secular bodies) could take a role; but I<br />
am not sure that in practice they <strong>do</strong> very often help fund<br />
church buildings, over and above any funds they give to<br />
maintain the churchyard. It is unlikely that the wider<br />
environmental value of churches in enc<strong>our</strong>aging t<strong>our</strong>ism<br />
would be captured in these ways.<br />
In short, it seems to me that churches could bene#t<br />
more than they currently <strong>do</strong> from their contribution to<br />
t<strong>our</strong>ism. But I may be wrong, and would <strong>we</strong>lcome<br />
correction.<br />
Wider use – a quandary<br />
Section 4 described the large number of community<br />
activities which churches undertake.<br />
These activities are valued to the extent that some<br />
receive public funding. The quandary is this: for many<br />
CoE congregations (far more than for other<br />
denominations and faiths) one of the largest #xed costs –<br />
and biggest headaches – is their historic, listed church<br />
building, which acts as home base, and from which<br />
springs much of their activity. But unless the church building<br />
itself is converted for community use, it will not directly bene#t from<br />
funding for church activities.<br />
6.3 The view of the Government and its<br />
agencies<br />
What of the Government’s view, and that of its agencies?<br />
I have no inside track, and can only report on those<br />
aspects which have come to my attention. This section<br />
may not, therefore, provide a balanced overview, and I<br />
would <strong>we</strong>lcome further information.<br />
In general terms, in its policy statement A Force for the<br />
Future, the Government has recognised the value of the<br />
historic environment. The ministerial foreword says<br />
that: 13<br />
England’s historic environment is one of <strong>our</strong> greatest<br />
national res<strong>our</strong>ces. But it is about more than bricks and<br />
mortar...something from which <strong>we</strong> can learn, from<br />
which <strong>our</strong> economy bene#ts and which can bring <strong>our</strong><br />
communities together in a shared sense of belonging....<br />
[The historic environment] can be a force for regeneration<br />
and a po<strong>we</strong>rful contribution to people’s quality of life.<br />
Later it acknowledges the value of church buildings,<br />
saying that ‘at a more local level a historic church...can<br />
help de#ne a neighb<strong>our</strong>hood and create a sense of<br />
cohesion’.
HOW DO WE KEEP OUR <strong>PARISH</strong> <strong>CHURCHES</strong>? • KEEPING CHURCH BUILDINGS IN FUTURE 57<br />
The Government has also accepted that facilities<br />
provided by churches play a part in community life. When<br />
announcing the licence exemption for entertainment in<br />
churches (February 2003), Dr Kim Ho<strong>we</strong>lls, then a<br />
minister at the DCMS, said: 14<br />
I recognise that church and community halls are integral to<br />
community life and provide a social hub in a great many<br />
rural and urban areas. I am determined to enable them to<br />
continue to play this essential role.<br />
The Countryside Agency’s State of the Countryside 2003<br />
report values the presence of a church equally with that of<br />
a pub or primary school in helping create ‘community<br />
vibrancy’ in rural areas. 15<br />
As <strong>we</strong> saw in Section 4.4, various arms of Government<br />
are s<strong>how</strong>ing increasing interest in the value of churches as<br />
supporters of community, and there is some appreciation<br />
of the importance of buildings in that process.<br />
Ho<strong>we</strong>ver, as far as I am aware, the Government has not<br />
articulated an explicit policy towards historic church<br />
buildings.<br />
On the negative side, one disappointing aspect is that<br />
the grant to the CCT has been reduced in real terms,<br />
curtailing its ability to take on new churches (see earlier<br />
discussion, page 21). Furthermore, the comparatively tiny<br />
grant to the Victorian <strong>Society</strong> for a churches case-worker<br />
has also not been rene<strong>we</strong>d by EH.<br />
More positively, the Government has introduced a<br />
temporary VAT-reclaim scheme for repair work to listed<br />
places of worship, and is hoping to negotiate a permanent<br />
arrangement within the context of European VAT reform.<br />
In his budget speech announcing the scheme, the<br />
Chancellor said that ‘in both urban and rural areas, <strong>our</strong><br />
churches are essential centres for civic life and are at the<br />
heart of <strong>our</strong> rich heritage as a nation’. 16<br />
The EH/HLFgrant schemes continue to devote large and<br />
growing sums of money to expensive urgent repairs.<br />
Revised guidance from EH on New Work in Historic Places<br />
of Worship explicitly takes account of changing patterns of<br />
use. 17<br />
In general, it may be that there is room for a more<br />
po<strong>we</strong>rful argument to be made to government about the<br />
extent to which the t<strong>our</strong>ist trade depends on accessible,<br />
<strong>we</strong>ll-kept church buildings. This, coupled with the<br />
CONVERSATION WITH TAXI DRIVER<br />
After the normal chit chat, conversation moved on to hobbies. I<br />
explained that I was fascinated by church buildings.<br />
Me: At the moment, I’m writing an article about the<br />
up<strong>keep</strong> of church buildings.<br />
Driver: Oh aye.<br />
Me: If congregations can’t <strong>keep</strong> them up, a lot of them<br />
will have to close.<br />
Driver: I’d be sorry to see them go. They make a<br />
difference to the town [large northern mill town].<br />
Me: And the countryside?<br />
Driver: Uh huh.<br />
Me: Would you be prepared to pay a special tax to <strong>keep</strong><br />
them? Ten pounds a year say?<br />
Driver: Yes, <strong>we</strong>ll it’d be a lot better than some of the<br />
things they <strong>do</strong> with <strong>our</strong> money...<br />
growing appreciation of the value of church community<br />
activity, the role they play in building social capital, and<br />
the evidence that churches create a sense of place which is<br />
valued, might help develop an agreed economic and social<br />
framework within which to discuss support for church<br />
buildings.<br />
But even without this, it seems that many adults in<br />
Great Britain already support the idea of central<br />
government assistance for maintaining church and chapel<br />
buildings (see Table 4.1). The positive public attitude<br />
demonstrated in this survey – even although the issue is<br />
not one which has yet aroused general public concern –<br />
should, perhaps, enc<strong>our</strong>age us to search for innovative<br />
ways, perhaps at local level, of ensuring that historic<br />
church buildings continue to be available for public use<br />
and enjoyment, underpin t<strong>our</strong>ism, and act as a base for<br />
community activities.<br />
Notes<br />
1. Jackson, Hope for the Church. For the 1989/1998 comparison, see<br />
Figure 11.1 (It is not clear whether the churches <strong>we</strong>re all Anglican<br />
or of mixed denominations); for small congregations, see chapter<br />
11, passim; for impact of age on growth, see table 13.1.<br />
2. Wilding, Redundant Churches, pages 7 and 22, and compare actuals.<br />
3. Personal communication.<br />
4. This and following paragraph: personal communications from:<br />
Church Commissioners, CCC and diocesan of#cers’s observation.<br />
5. Diocese of Chelmsford, Review.<br />
6. Brierley, Tide, Tables 66 and 71.<br />
7. Based on my analysis of projects listed on the Local Heritage<br />
Initiative <strong>we</strong>bsite, November 2003, .<br />
8. English T<strong>our</strong>ism Council, The Heritage Monitor, 2000/1, Table 7.4.<br />
9. Francis and Martineau, Rural Visitors, pages 84 and 108. Note that in<br />
this survey the sample of respondees was self-selected, so must be<br />
treated with caution. There has also been criticism of the ranking<br />
system on the questionnaire. For further break<strong>do</strong>wn of the desire to<br />
have a space for prayer, see Keith Littler and Leslie Francis, ‘What<br />
rural churches say to non-churchgoers’, Rural Theology 1 (1) (Issue<br />
61, 2003),<br />
pages 57–62.<br />
10. Referred to in Francis and Martineau, Rural Visitors, page 10.<br />
11. The Historic Houses Association quoted research on international<br />
travellers, indicating that 4% of visitor expenditure <strong>we</strong>nt to<br />
attractions, 96% to businesses in the wider community. They then<br />
uplifted their entrance-fee income (presumably around £60m) by<br />
the ratio 96/4 to obtain an estimate of £1.6bn. Ho<strong>we</strong>ver <strong>do</strong>mestic<br />
t<strong>our</strong>ists have a different expenditure pro#le from international<br />
t<strong>our</strong>ists; a quick search of the data to hand (on ) suggests that the appropriate #gure for <strong>do</strong>mestic t<strong>our</strong>ists<br />
staying more than one night is 8% / 92%, and for day trippers (1998<br />
survey, the most recent I could easily obtain) 9% / 91%. Ho<strong>we</strong>ver I<br />
have not investigated this carefully, and these #gures should be<br />
treated with caution. (Brie#ng paper from the Historic Houses Association:<br />
June 2001, available from .)<br />
12. National Trust, Valuing <strong>our</strong> Environment : Summary, available from<br />
. The de#nition of ‘environment’ is<br />
clear from the detailed reports, available at the same <strong>we</strong>b address.<br />
13. Department of Culture, Media and Sport, The Historic Environment:<br />
A Force for <strong>our</strong> Future (2001), pages 4 and 7, available from<br />
.<br />
14. Department of Culture, Media and Sport, Press Notice<br />
3 February 2003.<br />
15. The Countryside Agency, The State of the Countryside 2003, page 17,<br />
available from .<br />
16. Budget speech, 7 March 2001.<br />
17. English Heritage, New Work in Historic Places of Worship (2003),<br />
available from .
58<br />
7.Andso...?<br />
Purpose of this section<br />
A summary of the report will be found on page 3<br />
My purpose in this paper has been to inform the debate<br />
about <strong>our</strong> parish church buildings. I did not intend to<br />
make recommendations; and on the whole I think I have<br />
resisted the temptation (not always without dif#culty).<br />
Ho<strong>we</strong>ver, some of the facts which I have presented <strong>do</strong><br />
of themselves suggest possible actions, which may be<br />
worth further consideration; these are discussed in this<br />
section. Most of these require funding, though in some<br />
cases the amounts are relatively small.<br />
I am most certainly not implying that the suggestions<br />
made here are suf#cient to resolve all the issues. They are<br />
merely the ones which arise more or less mechanically<br />
from the evidence.<br />
Need for research<br />
It is clear that in some important respects, <strong>we</strong> <strong>do</strong> not know<br />
what is going on. There is an urgent need for focused<br />
research in the areas s<strong>how</strong>n in the box (my apologies if<br />
work is already being carried out in these areas of which I<br />
am ignorant).<br />
The appointment by English Heritage of a full-time<br />
Head of Research for Places of Worship is enc<strong>our</strong>aging,<br />
and will help take matters forward. An appropriate balance<br />
will need to be struck bet<strong>we</strong>en academic and policy<br />
research.<br />
Reducing the pressures<br />
From the evidence presented in the earlier sections, it<br />
seems that the pressures on churches could be reduced in<br />
several ways.<br />
First, if seed-corn funding could be found, then a<br />
relatively small number of dedicated, specialist staff might<br />
make a real difference, as s<strong>how</strong>n in the box.<br />
Secondly, it would be helpful to parishes if the various<br />
grant-giving bodies could reach an agreed view as to<br />
policies, timetables and processes. In general, the<br />
end-to-end ‘customer experience’ should be revie<strong>we</strong>d to<br />
see if life can be made any easier for their customers, the<br />
congregations.<br />
Thirdly, the moral hazard associated with some grant<br />
schemes could usefully be re-examined, to see if ‘reward<br />
for virtue’ cannot be introduced into the system. As<br />
pointed out earlier, this is not a simple issue.<br />
F<strong>our</strong>thly, there is the problem of poor routine<br />
maintenance (clearing gutters and so forth). This has been<br />
with us for at least #fty years, and so far attempts to deal<br />
with it by education have not solved the problem. Perhaps<br />
it is time for a more direct approach, with a gradual shift<br />
of funding towards routine maintenance. To put this in<br />
#nancial context, if 12,000 listed parish churches each had<br />
maintenance carried out without direct charge to them, at<br />
£500 per year per church, the total cost would only be<br />
£6m, much less than the annual EH/HLFgrant budget.<br />
RESEARCH AGENDA: A PERSONAL VIEW<br />
1. What are the expectations of parishes about their<br />
own future and that of their church buildings? What<br />
changes would most improve their prospects.<br />
2. How many people are providing routine support<br />
for church buildings (see Appendix G)?<br />
3. What is the repair gap, bet<strong>we</strong>en what a parish<br />
ought to spend on repairs, and <strong>do</strong>es spend? What is the<br />
current outstanding repair bill, and <strong>how</strong> urgent are the<br />
outstanding repairs?*<br />
4. What is the economic impact of churches on<br />
t<strong>our</strong>ism? Are churches capturing a fair share of the<br />
value they are generating?<br />
5. How <strong>do</strong> parishes raise funds? What has been the<br />
trend in parish fabric reserves? What is it like to go<br />
through the cycle of applying for grants, dealing with<br />
the amenity societies, obtaining a faculty, raising money<br />
and seeing through repairs?<br />
6. What is the underlying demand for new facilities<br />
in church buildings (for example, kitchens, toilets,<br />
disabled access, extension)? What bene#ts accrue to the<br />
wider community?<br />
7. How successful have major conversions been in<br />
preserving #ne buildings. What works? What <strong>do</strong>es not<br />
work?<br />
*We will know more on this next year, as the CoE is asking parishes to<br />
report on their outstanding repair bill.<br />
More than this might be saved in catching repairs<br />
very early.<br />
Fifthly, it could be useful to improve the supply of<br />
grants for emergency repairs, to deal with them before<br />
they become too expensive. (I believe that possible pilot<br />
schemes are being explored in two dioceses, in<br />
collaboration with EH). This type of grant needs to be<br />
handled pragmatically, taking individual account of each<br />
situation, rather than having formalised equity of<br />
treatment.<br />
Finally, there is a matter much discussed on the ground,<br />
but on which I have not presented any formal evidence:<br />
the question of pews – a type of seating which is good at<br />
packing people in, but (in its normal form) makes the<br />
building in$exible in use. Although pews are sometimes<br />
valued by parishes for their associations or aesthetic<br />
qualities, I suspect that many other parishes would like to<br />
remove some or all of them, but are nervous about<br />
lengthy discussions with the authorities. Another<br />
complication is the requirement of #re of#cers for #xed or<br />
locked seating if concerts are regularly held. I understand<br />
(personal communication) that EH are considering a
HOW DO WE KEEP OUR <strong>PARISH</strong> <strong>CHURCHES</strong>? • ANDSO...? 59<br />
USE OF SEED-CORN FUNDING ON STAFF:<br />
A PERSONAL VIEW<br />
Make champions and expertise available in the<br />
following areas:<br />
T<strong>our</strong>ism, to promulgate best practice and raise the<br />
pro#le of church t<strong>our</strong>ism<br />
‘Friends of churches’, to provide central advice and<br />
enc<strong>our</strong>agement, and speed up the spread of ideas<br />
Grants, to negotiate nationally with the grant-giving<br />
bodies on their policies and practice, and to channel<br />
experience and expertise into the parishes<br />
Additional use of church buildings, to disseminate<br />
ideas and learning quickly into dioceses and parishes<br />
Fabric advice (as already in Manchester and Lon<strong>do</strong>n),<br />
to assist parishes in utilising their assets and planning<br />
ahead<br />
research project on the historic and architectural<br />
importance of church seating, to inform their future<br />
advice on the subject. A strong and co-ordinated lead on<br />
this matter from EH and the CoE could be very helpful,<br />
perhaps taking into account what has happened where<br />
pews have already been taken out.<br />
Limitations of the above proposals<br />
The above suggestions might provide general support for<br />
churches, although I <strong>do</strong> not claim they will be suf#cient.<br />
Ho<strong>we</strong>ver, they are not targeted at struggling churches,<br />
close to redundancy. It is the churches with the smallest<br />
congregations (relative to the cost of maintaining the<br />
building) which are most at risk, yet which may #nd it<br />
hardest to take action to bene#t from any of these<br />
proposals. An emerging theme of this report has been the<br />
need to take into account the rather different needs of very<br />
tiny congregations in formulating policy.<br />
Nor <strong>do</strong>es any of this explore new ways of handling<br />
redundant buildings. In both these cases, more innovative<br />
thinking is required.<br />
Overlapping agendas?<br />
To an external observer, there <strong>do</strong>es seem room for a<br />
developing and perhaps more explicit partnership bet<strong>we</strong>en<br />
faith groups (such as the CoE) and government in all its<br />
aspects. In some important respects their agendas overlap,<br />
as church communities, making use of their buildings,<br />
play a part in building voluntary involvement, community<br />
capacity and ‘social capital’.<br />
Furthermore historic CoE church buildings can and <strong>do</strong><br />
provide opportunities for t<strong>our</strong>ism – a major industry – as<br />
<strong>we</strong>ll as education, cultural and social events, the awareness<br />
of heritage, the sense of place and a focus for regeneration,<br />
many of which are matters of concern to government.<br />
Here, perhaps, are the bare bones of a social and economic<br />
framework for discussing the roles of the various parties.<br />
Time for something new?<br />
Finally I should like to add a personal view. From the<br />
evidence to hand, <strong>we</strong> cannot predict what will happen<br />
next. Ho<strong>we</strong>ver, the formal evidence, backed up by<br />
anec<strong>do</strong>te, leads me to believe there is a real risk <strong>we</strong> will see<br />
a sharp increases in the rate of redundancy in the next #ve<br />
to #fteen years, quite possibly to levels never seen before.<br />
Under current arrangements I believe <strong>we</strong> would see many<br />
#ne buildings, in both town and countryside, facing a<br />
bleak future.<br />
Because of the uncertainty about the level of threat to<br />
church buildings, I believe <strong>we</strong> should begin now to<br />
explore new approaches to avoiding redundancy, and new<br />
ways of handling it when it occurs. In this way <strong>we</strong> will<br />
learn in good time what works and what <strong>do</strong>es not.<br />
If <strong>we</strong> wait, I fear <strong>we</strong> may be taken by surprise.<br />
A future for church buildings<br />
Recently the CoE has agreed a signi#cant policy statement,<br />
A Future for Church Buildings – an essential read for anyone<br />
interested in this area – and has put in place dedicated<br />
res<strong>our</strong>ce to develop this strategy. As a result the CoE will<br />
soon be submitting to Government speci#c proposals for<br />
action, founded on partnership bet<strong>we</strong>en various<br />
stakeholders. In the foreword of this policy statement the<br />
Bishop of Lon<strong>do</strong>n alludes to ‘a new way forward’. The<br />
time is surely ripe.<br />
This paper re$ects the views of the author and not necessarily those<br />
of the <strong>Ecclesiological</strong> <strong>Society</strong> or its Council<br />
For those interested in pursuing the topic, the<br />
<strong>Ecclesiological</strong> <strong>Society</strong> <strong>we</strong>bsite, ,<br />
will post corrections to this paper, together with new<br />
information and informed comment.<br />
IN PRAISE OF THE CHURCH OF ENGLAND<br />
From a discussion <strong>we</strong>bsite: I am sceptical of the ability of<br />
the alternatives suggested [i.e. suggestions for<br />
state-funding of church buildings]. Would they be:<br />
• Capable of engaging the same commitment in<br />
their supporters<br />
• As free or more free of bureaucracy<br />
• As effective in protecting buildings<br />
• As accountable<br />
• As effective in opening buildings<br />
• As cost-effective<br />
• Capable of withstanding changes in political<br />
fashion – that is, can work for centuries not<br />
decades<br />
S<strong>our</strong>ce: abbreviated from posting on Churchcrawler forum<br />
60 TREVOR COOPER • HOW DO WE KEEP OUR <strong>PARISH</strong> <strong>CHURCHES</strong>? • 2004 • www.ecclsoc.org<br />
Appendix A: The cost of church repairs<br />
A1 Introduction<br />
This appendix provides:<br />
• a snapshot of the current outstanding<br />
repair needs of churches<br />
• an estimate of <strong>how</strong> fast new<br />
deterioration occurs and new needs<br />
are discovered<br />
• information about annual<br />
expenditure on repairs<br />
• some technical comments.<br />
The results are used in Section 3.1.<br />
A2 Snapshot<br />
The state of repair of churches is not<br />
normally centrally collected or monitored,<br />
though I understand the CoE is planning<br />
to collect data on this in its next annual<br />
round of reporting. The diocese of<br />
Shef#eld is also running a trial to collect<br />
break<strong>do</strong>wns of the cost of outstanding<br />
repairs on a routine basis, though #nding<br />
some dif#culties with the need to obtain<br />
estimates. We are therefore reliant on f<strong>our</strong><br />
s<strong>our</strong>ces, discussed below and summarised<br />
in Table A1. Full references will be found<br />
in the Bibliography. More detailed #gures<br />
are available on the <strong>Ecclesiological</strong> <strong>Society</strong><br />
<strong>we</strong>bsite (.<br />
Manchester EH and the diocese of<br />
Manchester carried out a survey of the<br />
diocese’s churches, reporting the results in<br />
1997. For listed churches, a quick attempt<br />
was made to assess obvious repairs, and to<br />
put their likely cost into one of three<br />
bands – zero (120 churches in this<br />
category), £15k – £100k (22 churches),<br />
over £100k (24 churches); all in money of<br />
the time (converted to 2002 money in<br />
Table A1). Thus 85% of listed churches<br />
<strong>we</strong>re estimated to have necessary repairs<br />
less than £100k. We <strong>do</strong> not know <strong>how</strong><br />
Table A1<br />
F<strong>our</strong> s<strong>our</strong>ces of evidence for the value of outstanding repairs to church buildings 1<br />
All figures in 2002 money and rounded. Blanks indicate ‘not known’<br />
‘’ means ‘more than’<br />
Claridge<br />
Manchester<br />
Archdeaconry<br />
CCT<br />
Number of churches in sample 166 137 2 59 31<br />
Date 1997 1994 2002 mid 90s<br />
onwards<br />
Pre<strong>do</strong>minant type of church Urban Mixed Urban Medieval<br />
village<br />
Listed? All Some Some Hi-listed 3<br />
Distribution of repair costs 4<br />
Lo<strong>we</strong>r quartile - - £20k £50k<br />
Median - £50k £50k £100k<br />
Upper quartile < £140k > £70k £175k £200k<br />
Proportion of churches with<br />
repairs equal or above a given cost<br />
Repairs at least £100k >15% - 34% 54%<br />
Repairs at least £200k - - 24% 26%<br />
Repairs at least £500k - - 12% 3%<br />
Repairs at least £1m - - 8% 0%<br />
Average repair cost<br />
Entire sample - £80k £230k £150k<br />
Omitting all costs of £1m or more - - £95k £150k<br />
Omitting all of £500k or more - - £75k £130k<br />
Notes<br />
1. See text for the f<strong>our</strong> s<strong>our</strong>ces of evidence.<br />
2. The average was based on 137 churches; the median and upper quartile data on a sub-sample of<br />
53 which may not have had exactly the same distribution as the full sample of 137.<br />
3. Mostly listed Grades I and II*.<br />
4. A quarter of the churches have repair costs below the ‘lo<strong>we</strong>r quartile’, one half of them below the<br />
‘median’, and three quarters fall below the ‘upper quartile’.<br />
S<strong>our</strong>ces: see text. The data is presented in detail on .<br />
many of the 15% of churches with<br />
outstanding repairs above £100k <strong>we</strong>re<br />
close to this #gure and <strong>how</strong> many a long<br />
way above. The #gures must anyway be<br />
treated with caution, as the report<br />
emphasized that they <strong>we</strong>re a very broad<br />
estimate, made quickly, and that the<br />
person making this estimate was not an<br />
architect.<br />
The report also assessed every church<br />
(not just listed ones). Those not in good<br />
condition <strong>we</strong>re classi#ed as ‘poor’ or<br />
‘needing attention’. Neither of these<br />
terms are de#ned in the report, but in the<br />
context of listed buildings, ‘poor’ always<br />
coincides with an estimated repair spend<br />
at that date of over £100k, and ‘needing<br />
attention’ churches had this level of spend<br />
indicated about one third of the time.<br />
Approximately 9% of churches <strong>we</strong>re said<br />
to be in ‘poor’ condition, and 21%<br />
‘needing attention’. The #gures by grade<br />
<strong>we</strong>re: Grade I/II*, 6% poor, 26% needing<br />
attention; Grade II, 12% and 21%;<br />
unlisted, 8% and 20%.<br />
Claridge In 1994, Geoffrey Claridge<br />
visited 119 CoE churches and 18<br />
non-Anglican places of worship, and<br />
assessed their condition by inspection.<br />
The observable outstanding repairs<br />
averaged just under £80k per church<br />
(2002 money). The sample was selected to<br />
contain a good mix of buildings, though it<br />
did contain a number of non-Anglican<br />
buildings. We <strong>do</strong> not know <strong>how</strong> fully<br />
representative it was. When Jeremy<br />
Eckstein contacted some of the churches a<br />
few years later, in a number of cases the<br />
cost of repairs had been underestimated:<br />
which will be a surprise to no-one, but<br />
needs to be borne in mind with this<br />
approach.<br />
Claridge regarded roughly half (£40k)<br />
of this average of £80k outstanding repairs<br />
as work which should be carried out<br />
within #ve years. From this he concluded<br />
that the churches should spend an average<br />
£8k each over the next #ve years. At that<br />
point they would be left with non-urgent<br />
repairs costing £40k, plus any new<br />
discoveries of repair needs from the input<br />
side of the repairs ‘pipeline’ (page 26); he<br />
did not attempt to estimate this.<br />
Claridge did not publish the spread of<br />
outstanding repairs, but Eckstein (2) did<br />
for a sample of 53 of the churches. Half of<br />
these 53 churches had outstanding repairs<br />
estimated to cost less than about £50k in<br />
2002 money. One third had repairs<br />
estimated to cost more than £70k. In some
HOW DO WE KEEP OUR <strong>PARISH</strong> <strong>CHURCHES</strong>? • APPENDICES 61<br />
cases it must have been considerably more<br />
than this (to give the correct average<br />
overall), but <strong>we</strong> <strong>do</strong> not have data on this.<br />
It may be worth pointing out that<br />
Claridge’s uplift from his sample of<br />
churches to estimates of total cost for all<br />
churches was understated, because it did<br />
not allow for the fact that some parishes<br />
have more than one church.<br />
Urban archdeaconry One urban<br />
archdeaconry (personal communication)<br />
recently (2002) collated its estimated<br />
outstanding repair costs for nearly 60<br />
churches. There is a very high proportion<br />
of Victorian churches in this<br />
archdeaconry, including some giant ones.<br />
Half of the churches believe they faced<br />
bills of £50k or less. A quarter of churches<br />
expected to pay some £150k or more. At<br />
the very top end, #ve churches (nearly<br />
10% of them) had anticipated repairs of<br />
more than £1m. These #ve are very large<br />
Victorian buildings. Without these #ve,<br />
the average was something under £100k<br />
per church; with them, rather more than<br />
£200k. Is this archdeaconry typical of<br />
Victorian town churches?–I<strong>do</strong>not<br />
know.<br />
Churches Conservation Trust The<br />
CCT brings all its churches up to a<br />
reasonable condition within a few years of<br />
acquisition. I analysed the initial costs (in<br />
2002 money) for the most recent<br />
churches for which a full #ve years data is<br />
available, 31 in all. Most of these are<br />
medieval village churches, with just f<strong>our</strong><br />
Victorian buildings, three of those in<br />
villages. The cost of bringing the churches<br />
up to scratch varies greatly bet<strong>we</strong>en<br />
churches. About a quarter of the churches<br />
come in below £50k, and about a half<br />
below £100k. The top quarter of the<br />
churches cost more than £200k. The<br />
average is about £150k, raised by the<br />
impact of a few large repair bills – if one<br />
omits the f<strong>our</strong> churches with bills over<br />
£300k, the average is around £100k. The<br />
three Victorian village churches are spread<br />
across the cost range; the single urban<br />
Victorian church cost rather more than<br />
£250k, and was thus one of the more<br />
expensive ones.<br />
Can the CCT experience be<br />
generalized? No – these churches are not<br />
a ran<strong>do</strong>m sample, not least because they<br />
are pre<strong>do</strong>minantly medieval and rural,<br />
they are often under-maintained and<br />
neglected, and the churches have not<br />
infrequently been vandalised in advance<br />
of vesting. But the #gures may give a clue<br />
to the condition of typical rural churches.<br />
Discussion The evidence presents<br />
three dif#culties. First, of the f<strong>our</strong> pieces<br />
of evidence, only one (the CCT results)<br />
was based on actual costs, rather than<br />
estimates. Secondly, <strong>we</strong> <strong>do</strong> not know <strong>how</strong><br />
representative these churches are of the<br />
entire population of churches. Finally, the<br />
small number of churches means that<br />
averages are not reliable; this is because<br />
averages are greatly affected by a small<br />
number of very large repairs, and there is<br />
no guarantee that <strong>our</strong> samples have not<br />
accidentally included too many or too few<br />
of these large repairs. The results<br />
therefore need to be treated with caution.<br />
It is notable that the CCT #gures are<br />
higher than the #gures in the other<br />
samples. Are the CCT churches more<br />
expensive because they have been<br />
neglected? Or because the CCT #gures are<br />
the only ones re$ecting actual rather than<br />
estimated costs? We <strong>do</strong> not know. The<br />
exception to this is at the very top: the<br />
CCT <strong>do</strong>es not have as many very<br />
expensive repairs (more than £1m, say) as<br />
the sample from the urban archdeaconry;<br />
this is probably because of the lack of<br />
Victorian churches in the CCT sample.<br />
As regards the proportion of repairs<br />
above £100k, the Manchester study is <strong>we</strong>ll<br />
below the other two samples for which <strong>we</strong><br />
have #gures. This may be because the<br />
Manchester estimates <strong>we</strong>re made by a<br />
non-architect as part of a wider study, and<br />
some necessary repair work was therefore<br />
not identi#ed.<br />
The Claridge report has the lo<strong>we</strong>st<br />
average cost. Perhaps there <strong>we</strong>re not many<br />
large Victorian churches in the sample, or<br />
they happened to be in reasonable<br />
condition. The average of the Claridge<br />
sample is roughly equal to that of the<br />
Table A2<br />
Actual spending on church repairs in<br />
the CCT and CoE<br />
Omitting recently acquired churches<br />
Spend on<br />
repairs<br />
CCT<br />
(2002)<br />
%of<br />
Churches<br />
CoE all<br />
parishes<br />
(2001)<br />
%of<br />
Parishes<br />
zero 38 42<br />
up to £1k 14 9<br />
£1k – £5k 20 24<br />
£5k – £10k 7 10<br />
£10k – £20k 11 8<br />
£20k – £50k 6 5<br />
£50k –<br />
3<br />
£100k<br />
2<br />
Over £100k 1<br />
100% =<br />
305<br />
churches<br />
100% =<br />
12,951<br />
parishes<br />
S<strong>our</strong>ce: CCT, Annual Report, 2002; CoE,<br />
personal communication<br />
other samples if their most expensive<br />
repairs are stripped out.<br />
What overall conclusions can <strong>we</strong> draw<br />
about the generality of churches? None<br />
with any certainty. We might guess that<br />
50% of listed churches – some 6000<br />
buildings – have outstanding repairs<br />
which are less than £100k. Indeed, these<br />
6000 buildings might all have repair needs<br />
less than £50k. The next 3000 (25%) of<br />
churches probably all fall below £200k,<br />
perhaps <strong>we</strong>ll below. As for the #nal 3000<br />
listed churches, the sky is probably the<br />
limit, and <strong>our</strong> evidence <strong>do</strong>es not help us<br />
to guess <strong>how</strong> many might require very<br />
large sums of money. As to the average size<br />
of outstanding repair, one might hazard a<br />
guess that it lies bet<strong>we</strong>en £80k and £250k,<br />
the actual result depending heavily on<br />
<strong>how</strong> many very large Victorian churches<br />
there are, and <strong>how</strong> many are in a state of<br />
serious disrepair. This would imply a total<br />
outstanding repair bill of bet<strong>we</strong>en £1000m<br />
and £3000m. This is not terribly helpful,<br />
as <strong>we</strong> <strong>do</strong> not know <strong>how</strong> quickly the<br />
repairs need to be carried out.<br />
A3 Rate of deterioration<br />
It would be useful to know the normal<br />
rate at which new deterioration will be<br />
occurring and repair needs discovered, as<br />
this would provide a #gure for<br />
‘steady-state’ repair expenditure per year.<br />
The only data I could #nd on this is the<br />
expenditure of the CCT, which tends to<br />
catch repairs fairly early. This body began<br />
life in 1969 and now has more than three<br />
hundred churches, mainly rural medieval.<br />
Omitting recently acquired churches,<br />
where large sums are sometimes spent<br />
bringing the churches to a good condition,<br />
my analysis of recent years’ expenditure<br />
suggests that repairs for each of their<br />
churches – which are mainly medieval<br />
village buildings – accumulate at an<br />
average of about £7,000 per church per<br />
year, in 2002 money. I have not analysed<br />
whether there is any trend over time for<br />
an individual church.<br />
A4 Annual expenditure<br />
The actual annual expenditure on repairs<br />
of CoE churches is about £5,000 per<br />
church per year, as discussed in the body<br />
of the report. (This #gure should be used<br />
in preference to the Eckstein(1) results,<br />
which, <strong>we</strong> now know are under<strong>we</strong>ight in<br />
churches with zero expenditure, due to<br />
the sampling dif#culties which he<br />
identi#ed. If the Eckstein #gures are<br />
corrected for zero expenditure, they are<br />
comparable with the #gures in Table A2.)
62 TREVOR COOPER • HOW DO WE KEEP OUR <strong>PARISH</strong> <strong>CHURCHES</strong>? • 2004 • www.ecclsoc.org<br />
How much <strong>do</strong> churches want to spend?<br />
The applications for EH/HLF grants for<br />
listed churches in the most recent year<br />
totalled roughly <strong>do</strong>uble the approximately<br />
£20m which was available. This might<br />
suggest that the desire for repairs to listed<br />
churches is higher than actual repairs by<br />
£3om ( allowing for matched funding of<br />
half the £20m core grant) for the type of<br />
urgent, large repairs funded by EH/HLF.If<br />
so, this would mean (estimating the<br />
number of listed churches) that the<br />
demand is greater per listed church by<br />
£2,500 than the £5,000 actually spent.<br />
This may also be true of unlisted churches<br />
(who are not eligible for these grants).<br />
Ho<strong>we</strong>ver, <strong>we</strong> <strong>do</strong> not know if this is a<br />
recurring annual demand or a one-off<br />
need.<br />
The CCT spends an average of £7k per<br />
year on repairs, and the CoE about £5k,<br />
suggesting the CoE is underspending,<br />
particularly given the CoE’s portfolio of<br />
Victorian buildings, not matched by the<br />
CCT. Ho<strong>we</strong>ver, as discussed, averages can<br />
be misleading. It is better to look at the<br />
pro#le of expenditure, as in Table A2.<br />
This compares the CoE spend with that of<br />
the CCT. (The CCT #gure is for all<br />
churches in the CCT portfolio except<br />
those acquired within the previous #ve<br />
years, which may be undergoing initial<br />
repairs and are thus not representative.)<br />
Because the CoE data is for parishes and<br />
the CCT data for churches, they are not<br />
strictly comparable, but the broad picture<br />
is clearly the same, with most expenditure<br />
at the low end of the scale. Ho<strong>we</strong>ver the<br />
impression is given that fe<strong>we</strong>r CoE than<br />
CCT churches are spending at the top end<br />
of repair expenditure, and this may<br />
explain the difference in average spend<br />
bet<strong>we</strong>en the two.<br />
A5 Technical notes<br />
Because of the impact of a few churches<br />
with exceptionally large repairs, it is<br />
impossible to calculate robust averages<br />
without having very large sample sizes.<br />
Any future research should not expect to<br />
obtain reliable average #gures. Instead,<br />
information should be presented as<br />
pro#les – for example, by providing<br />
deciles (10% bands) of expenditure.<br />
When trying to assess the condition of<br />
churches by using a sample, in theory the<br />
sample should be representative of<br />
churches of all sizes, styles, ages, materials,<br />
and climatic conditions. Ideally churches<br />
should also be segmented by the amount<br />
spent on repairs in the recent past, as this<br />
will affect the current condition. This<br />
complexity of sampling is probably<br />
unachievable, but careful thought needs to<br />
be given to samples.<br />
There has been some attempt (Eckstein<br />
(1) and more systematically Eckstein (2))<br />
to calculate the costs of repairing listed<br />
buildings, as against unlisted. (Claridge<br />
did not attempt this, but used a single<br />
average #gure of repair for listed and<br />
unlisted buildings.) This information<br />
would be helpful in understanding the<br />
notional cost to the CoE of not being<br />
allo<strong>we</strong>d to aban<strong>do</strong>n listed buildings,<br />
release the sites, and run modern, cheaper<br />
Continued at foot of opposite page<br />
Appendix B: Churches requiring regrading<br />
This appendix uses two s<strong>our</strong>ces of<br />
evidence to estimate the number of<br />
churches which might require regrading:<br />
the EH study in Manchester (about 330<br />
churches), and the joint EH/CCC Claridge<br />
study of a mixed sample of 137 churches.<br />
The results of these two studies are s<strong>how</strong>n<br />
on the left of Table B1.<br />
EH has recently carried out a study of<br />
religious buildings in Liverpool, and this<br />
may result in a number of churches being<br />
considered for a change in listed status.<br />
No results have been published, nor<br />
formal discussions taken place. Ho<strong>we</strong>ver I<br />
understand (EH, personal communication)<br />
that early indications are that the<br />
proportion whose listing status may need<br />
to be reconsidered is of the same order of<br />
magnitude as was found in the<br />
Manchester and Claridge studies.<br />
If the average of the Manchester and<br />
Claridge studies is taken to be<br />
representative of all English churches,<br />
then of the order of 1,750 churches would<br />
need regrading (1,250+ 500, bottom right<br />
of table). This #gure must be treated with<br />
considerable caution: the Manchester<br />
sample is almost entirely urban, so not<br />
representative, and the Claridge sample of<br />
137 churches is small (and whether it is<br />
representative is not known). Furthermore,<br />
it is suspected that the quality of<br />
listing varies across England.<br />
Finally, it should be borne in mind that<br />
criteria for listing alter over time, as<br />
different facets of the historic<br />
environment are given changing <strong>we</strong>ight,<br />
so the task of grading is unending.<br />
Table B1<br />
Estimated number of churches requiring regrade<br />
Claridge and Manchester estimates of<br />
percentage of churches deserving regrade<br />
% of original grade<br />
suggested could be<br />
moved UP<br />
% of original grade<br />
suggested could be<br />
moved DOWN<br />
All figures rounded<br />
Estimated churches requiring<br />
regrading, using average of<br />
Claridge and Manchester<br />
percentage estimates<br />
Number<br />
currently<br />
in each<br />
grade<br />
Estimated number<br />
deserving to move:<br />
Claridge Manch’r Claridge Manch’r UP DOWN<br />
I - - 12% - 4200 0 250<br />
II* - 14% - 10% 4200 290 210<br />
II 26% 9% - 2% 3800 670 40<br />
unlisted 13% 2% - - 3900 290 0<br />
S<strong>our</strong>ce: Claridge Report (1998); Manchester, Survey; Appendix F<br />
total =<br />
16200<br />
total =<br />
1250<br />
total =<br />
500
HOW DO WE KEEP OUR <strong>PARISH</strong> <strong>CHURCHES</strong>? • APPENDICES 63<br />
Appendix C: EH/HLF Grants<br />
This appendix s<strong>how</strong>s, in Table C1, the<br />
annual size of grant made by EH/HLF to<br />
churches (excluding cathedrals) since<br />
1987. Grants <strong>we</strong>re made to churches by<br />
English Heritage in the years preceding<br />
1986/7, but this information is not s<strong>how</strong>n<br />
in the table. The information is<br />
summarised in Section 3.3.<br />
In October 1996, English Heritage<br />
(EH) and the Heritage Lottery Fund (HLF)<br />
launched the Joint grant scheme for churches<br />
and other places of worship (JPOW). Apart<br />
from a single offer by HLF in 1996/7, no<br />
offers <strong>we</strong>re made under the scheme until<br />
the #nancial year 1997/8. From then on,<br />
offers to places of worship <strong>we</strong>re made<br />
under the scheme, apart from those to<br />
CoE and Roman Catholic cathedrals<br />
under EH’s separate scheme.<br />
In 2001, EH was asked by the<br />
Department of Culture, Media and Sport<br />
to make a contribution to the<br />
Government’s new grant scheme to<br />
reimburse VAT costs incurred in repairs<br />
and maintenance to listed places of<br />
worship. This contribution by EH was<br />
agreed at £2m in 2001/2 and £4m in the<br />
following year, a total of £6m. EH decided<br />
to fund this by reducing offers to places of<br />
worship under the JPOW during 2001/2.<br />
This explains the lo<strong>we</strong>r #gure for that<br />
year.<br />
In April 2002 the scheme was<br />
relaunched as Repair grants for places of<br />
worship in England 2002 to 2005 (RGPOW).<br />
Table C1<br />
Annual grants for church repairs (excluding cathedrals) awarded by English Heritage and Heritage Lottery Fund<br />
under various schemes, from year ending April 1987<br />
£m money of the time (except final column, 2003 money)<br />
Year-end<br />
(April)<br />
EH grants awarded<br />
£m<br />
Scheme<br />
HLF grants awarded<br />
£m<br />
Scheme<br />
Total<br />
(money<br />
of time)<br />
£m<br />
Total<br />
(2003<br />
money)<br />
£m Notes<br />
pre-JPOW JPOW RGPOW JPOW RGPOW<br />
1987 5,300 5,300 10,969 1<br />
88 6,100 6,100 12,046 2<br />
89 7,100 7,100 13,289 1<br />
90 8,200 8,200 14,234 1<br />
91 9,100 9,100 14,728 3<br />
92 10,700 10,700 16,451 3<br />
93 11,200 11,200 16,626 4<br />
94 12,500 12,500 17,938 4<br />
95 14,100 14,100 19,581 4<br />
96 10,800 10,800 14,262 4<br />
97 9,900 967 10,867 13,923 4<br />
98 10,023 7,790 17,813 22,292 4<br />
99 12,202 13,268 25,470 30,800 4<br />
2000 9,994 5,488 15,482 18,210 4<br />
01 13,747 10,506 24,253 27,332 4<br />
02 3,170 16,528 19,698 21,633 4,5<br />
03 4,886 5,899 2,080 14,779 27,644 29,026 4<br />
04 10,000 20,000 30,000 30,035 4,6<br />
Total 105,000 54,022 15,899 56,627 34,779 266,327 343,376<br />
Notes<br />
1. S<strong>our</strong>ce: Heritage Monitor 2. S<strong>our</strong>ce: Heritage Monitor (status unclear) 3. S<strong>our</strong>ce: Heritage Monitor (acceptances)<br />
4. English Heritage records 5. See text 6. Budget<br />
Appendix A, continued from previous page<br />
buildings. This is a valid attempt to cost<br />
the ongoing ‘heritage burden’. Ho<strong>we</strong>ver, I<br />
<strong>do</strong> not believe that the sampling<br />
metho<strong>do</strong>logy used to date has given<br />
robust results.<br />
It is tempting to try and ans<strong>we</strong>r a rather<br />
different question – <strong>how</strong> much extra <strong>do</strong>es<br />
the fact of listing add to the cost of repairs.<br />
This could validly be ans<strong>we</strong>red on an<br />
input basis, by considering the extra cost<br />
of materials and workmanship, and the<br />
time and cost taken to deal with the<br />
regulatory burdens. It should not be<br />
ans<strong>we</strong>red simply by comparing actual<br />
spend on listed and unlisted churches,<br />
unless one is using a matched sample of<br />
listed and unlisted buildings. Without a<br />
matched sample, one would largely be<br />
identifying the cost differences bet<strong>we</strong>en<br />
rural medieval and second-rate urban<br />
Victorian buildings, rather than listed and<br />
unlisted buildings.<br />
Note that unlike commercial property,<br />
for a church there is no market heritage<br />
premium attached to being listed.<br />
Ho<strong>we</strong>ver, such church buildings <strong>do</strong><br />
bene#t from the effectively reduced rate<br />
of VAT, and from access to EH/HLF grants.
64 TREVOR COOPER • HOW DO WE KEEP OUR <strong>PARISH</strong> <strong>CHURCHES</strong>? • 2004 • www.ecclsoc.org<br />
Appendix D: The number and destination<br />
of redundant churches<br />
This appendix summarises the destination<br />
of church buildings made redundant since<br />
1969, discussed brie$y in Section 2.3.<br />
The number of church buildings made<br />
redundant in each #ve year period is<br />
s<strong>how</strong>n in Graph D1. As explained in the<br />
body of the report, <strong>how</strong>ever (Section 2.3),<br />
some 370 <strong>we</strong>re effectively redundant at<br />
the beginning of the period, meaning that<br />
the initial surge exaggerates the<br />
underlying rate. Note also that the second<br />
#ve year period was actually 5 years and 9<br />
months, as the year-end was changed. The<br />
fall in the annual number of redundancies<br />
in recent years is clearly seen.<br />
When a church is made redundant, it<br />
has to go through a formal process which<br />
includes reviewing future possible uses.<br />
Some churches are then demolished and<br />
the site re-used, some are preserved, and<br />
some are converted for alternative use.<br />
The destination of all the churches<br />
made redundant since 1969 is s<strong>how</strong>n in<br />
Table D1, and there is a #ve-yearly<br />
break<strong>do</strong>wn of the proportions falling into<br />
each main category in Graph D2.<br />
No further break<strong>do</strong>wn of the #gures is<br />
available, though I understand that the<br />
Church Commissioners are working on a<br />
database which will enable other<br />
cross-comparisons to be carried out, such<br />
as the grades of the churches, their<br />
location, and their date of build.<br />
Below left Graph D1 Number and destination of<br />
churches made redundant 1969–2002, by five-yearly<br />
period<br />
S<strong>our</strong>ce: Church Commissioners Redundant Churches<br />
Committee, Report, 2002<br />
Below right Graph D2 Proportion of redundant<br />
churches to various destinations, by five-yearly<br />
period<br />
S<strong>our</strong>ce: Church Commissioners Redundant Churches<br />
Committee, Report, 2002<br />
Table D1<br />
The destination of redundant church buildings, 1969–2002<br />
Number %<br />
Alternative use (details below) 925 57<br />
civic cultural or community purposes 229 14<br />
residential use 204 13<br />
monuments 137 8<br />
worship by other Christian bodies 119 7<br />
light industrial/office/shopping 57 4<br />
arts & crafts, music or drama centres 36 2<br />
storage 35 2<br />
private school chapels 25 2<br />
educational purposes 24 1.5<br />
museums 16 1.0<br />
adjuncts to adjoining estates 10 0.6<br />
sports use 13 0.8<br />
masonic halls 3 0.2<br />
worship by non-Christian faith 2 0.1<br />
restored to parish use / chapel of ease 15 0.9<br />
Demolition and site disposal (details below) 360 22<br />
to housing associations 69 4<br />
to local authorities 48 3<br />
for other community purposes 23 1.4<br />
for new places of worship 60 4<br />
as additions to churchyards 46 3<br />
to other purchasers 111 7<br />
undecided 3 0.2<br />
Preservation (details below) 341 21<br />
by Churches Conservation Trust 331 20<br />
by Diocesan Boards of Finance 6 0.4<br />
by Department of the Environment 4 0.2<br />
Total 1626 100% =<br />
1626<br />
churches<br />
S<strong>our</strong>ce: Church Commissioners Redundant Churches Committee, Report, 2002<br />
500<br />
450<br />
400<br />
350<br />
300<br />
250<br />
200<br />
150<br />
100<br />
50<br />
0<br />
110<br />
105<br />
66<br />
37<br />
42<br />
84<br />
74<br />
27<br />
47 252<br />
35<br />
27<br />
200<br />
29<br />
148<br />
96<br />
99 88<br />
9<br />
42<br />
to 1974 to 1979 to 1984 to 1989 to 1994 to 1999 3 yrs to 02<br />
100%<br />
80%<br />
60%<br />
40%<br />
20%<br />
0%<br />
37<br />
21<br />
42<br />
24 21<br />
22<br />
54<br />
14 29 22 20<br />
65<br />
14 17 19 15<br />
57 61 61<br />
to 1974 to 1979 to 1984 to 1989 to 1994 to 1999 3 yrs to<br />
02<br />
15<br />
70<br />
22<br />
21<br />
57<br />
ALL<br />
alternative use preservation demolition<br />
alternative use preservation demolition
HOW DO WE KEEP OUR <strong>PARISH</strong> <strong>CHURCHES</strong>? • APPENDICES 65<br />
Appendix E: Statistics for rural churches<br />
The Rural Churches Survey<br />
Some important results from the Rural<br />
Churches Survey (1994) are reported in<br />
Francis and Martineau, Rural Mission<br />
(details in Bibliography). They are<br />
reproduced here by kind permission.<br />
The survey looked at a sample of 956<br />
CoE churches in rural communities with<br />
populations of 3000 or less.<br />
Details of the sample are s<strong>how</strong>n in<br />
Table E1. This table also s<strong>how</strong>s my<br />
estimate of the number of parishes of each<br />
size in England, based on the raw<br />
spreadsheet data supporting the<br />
Countryside Agency Rural Services in 2000<br />
report. Note that the survey was of<br />
churches, and my estimate is of the number<br />
of parishes. Some parishes will have two or<br />
more church buildings, so the numbers in<br />
the #nal row of Table E1 may understate<br />
the number of church buildings.<br />
The averages in Tables E2–E5 are<br />
<strong>we</strong>ighted averages, using my estimate of<br />
the number of rural parishes in England as<br />
the <strong>we</strong>ights. They therefore differ slightly<br />
from the averages published in Rural<br />
Mission, where the averages <strong>we</strong>re <strong>we</strong>ighted<br />
by the number of churches in the sample.<br />
This count of the number of<br />
communities, and the <strong>we</strong>ighted averages,<br />
are used in the following tables elsewhere<br />
in the report: 3.7, 4.2, 4.3, 4.4, 4.5, G3;<br />
and in Graph 4.1.<br />
The Tables<br />
Tables E2 and E3 s<strong>how</strong> attendance at<br />
special services. Table E3 concentrates on<br />
the traditional marks of commitment to<br />
the CoE – taking part in a communion<br />
service at Easter or Christmas. At most of<br />
these services, attendance is greater than at<br />
normal Sunday services (the exception<br />
being the Good Friday service), although<br />
the very smallest communities appear to<br />
have smaller attendance at some of these<br />
events – <strong>do</strong> worshippers travel to a larger<br />
church for this sort of occasion? The three<br />
best-attended services are Easter Sunday,<br />
Harvest Festival and the Christmas Carol<br />
service, where attendance is in most cases<br />
greater than the electoral roll, this being<br />
more pronounced the smaller the<br />
community. These two tables are<br />
summarised in Table G3 in Appendix G.<br />
Table E4 s<strong>how</strong>s <strong>how</strong> rural church<br />
buildings are used as the venue for various<br />
community-related activities. Church<br />
buildings in even the smallest<br />
communities are used for this purpose.<br />
Table E1<br />
Sample size of Rural Churches Survey, and number of rural parishes in England,<br />
by population (2000)<br />
Population<br />
Under<br />
200<br />
200–<br />
399<br />
400–<br />
899<br />
900–<br />
3000<br />
Number of communities in the Rural<br />
260 246 218 232<br />
Churches Survey sample<br />
Number of rural parishes in England* 1600 2000 2300 2200<br />
*My estimate of number of rural parishes of this population in England. See text.<br />
S<strong>our</strong>ces: first row, Francis and Martineau, Rural Mission, page 8; second row, National Parish<br />
Questionnaire returns used for Countryside Agency Rural Services in 2000 report, my analysis of<br />
summary returns available on Countryside Agency <strong>we</strong>bsite:<br />
<br />
Table E2<br />
Average attendance at special services for rural churches, by population of<br />
community (1994)<br />
Population of community<br />
Day of service<br />
Under<br />
200 200–399 400–899 900–3000 Avg<br />
Christmas carol service 37 64 78 100 72<br />
Harvest Festival 44 59 75 96 71<br />
Easter Sunday 28 40 60 99 59<br />
Remembrance Sunday 13 26 45 88 46<br />
Mothering Sunday 13 33 43 75 43<br />
Christmas midnight 9 26 44 78 42<br />
Christmas Day 20 28 38 57 37<br />
Usual Sunday attendance 17 18 31 52 31<br />
Good Friday 8 10 19 30 18<br />
S<strong>our</strong>ce: Francis and Martineau, Rural Mission, Table 12<br />
Table E3<br />
Average ‘membership’ statistics for rural churches, by population of community<br />
(1994)<br />
Using long-standing indicators of ‘membership’<br />
Population of community<br />
Under<br />
200 200–399 400–899 900–3000 Avg<br />
Usual Sunday attendance 17 18 31 52 31<br />
Electoral roll 21 39 58 96 56<br />
Christmas communicants (all 22 40 54 95 55<br />
services)<br />
Easter Day communicants 19 34 48 79 47<br />
S<strong>our</strong>ce: Francis and Martineau, Rural Mission, Table 11
66 TREVOR COOPER • HOW DO WE KEEP OUR <strong>PARISH</strong> <strong>CHURCHES</strong>? • 2004 • www.ecclsoc.org<br />
With the interesting exception of Art<br />
Exhibitions (<strong>do</strong>es this include Flo<strong>we</strong>r<br />
Festivals?), the amount of such activity<br />
grows with the size of community. The<br />
average #gures from this table are<br />
reproduced in Table 4.2 in Section 4.<br />
Table E5 s<strong>how</strong>s the extent of change in<br />
rural churches. Churches in larger<br />
communities tend to have carried out<br />
more changes than those in smaller<br />
communities. Smaller communities have<br />
been more active at introducing organs,<br />
but the numbers are small enough for this<br />
to be a ran<strong>do</strong>m effect: or it may be that the<br />
smaller communities can no longer afford<br />
to maintain their pipe organ and are<br />
replacing it with an electronic instrument.<br />
This table is summarised in Table 4.3 in<br />
Section 4.<br />
Table E4<br />
Proportion of rural church buildings used for specific community-related<br />
activities, by population of community (1994)<br />
Community-related<br />
activity<br />
Population of Community<br />
Under<br />
200 200–299 400–899 900–3000 Avg<br />
% % % % %<br />
Musical entertainment 26 47 54 62 49<br />
Dramatic performances 3 9 15 19 12<br />
Art exhibition 6 14 15 10 12<br />
Coffee mornings 2 2 8 16 7<br />
Evening social activities 4 4 6 13 7<br />
T<strong>our</strong>ist information 4 5 5 8 6<br />
S<strong>our</strong>ce: Francis and Martineau, Rural Mission, Table 20<br />
Table E5<br />
Proportion of rural church buildings where specified changes have been<br />
initiated ‘within the past five years’, by population of community (1994)<br />
Population of community<br />
Under<br />
200 200–399 400–899 900–3000 Avg<br />
% % % % %<br />
New heating system 10 15 18 19 16<br />
New lighting system 9 11 17 11 12<br />
New organ 10 10 6 7 8<br />
Removal of pews 1 4 9 10 6<br />
Repositioning of altar 2 6 6 9 6<br />
Social space inside church 2 4 8 7 6<br />
Provision of toilet 0 2 2 7 3<br />
Provision of kitchen 0 1 2 7 3<br />
Access for disabled 1 1 1 6 2<br />
S<strong>our</strong>ce: Francis and Martineau, Rural Mission, Table 18<br />
Appendix F: The number of listed churches<br />
This appendix s<strong>how</strong>s (Table F1, opposite)<br />
the number of listed churches in England,<br />
by diocese.<br />
The table is based on #gures provided<br />
by the dioceses in late 2003, except<br />
Chelmsford (from Chelmsford, Review),<br />
and South<strong>we</strong>ll (<strong>we</strong>bsite, November<br />
2003). Most dioceses <strong>we</strong>re able to respond<br />
to my request in the time available, and I<br />
am grateful for their ready help. Of the<br />
approximately 16,200 church buildings,<br />
all but about 850 are included in the table,<br />
and this enables us to be con#dent in the<br />
overall picture.<br />
Although the #gures in the table are<br />
likely to be broadly correct, they will not<br />
be precise, for a number of reasons. One<br />
reason is that in some cases I did not ask<br />
the dioceses to provide the number of<br />
unlisted buildings, and I subsequently<br />
calculated this number by subtraction,<br />
using the total number of churches<br />
published in Church Statistics 2001. The<br />
latter may have become out of date since<br />
publication, causing small errors. The<br />
total number of churches in the ‘Total’<br />
column of the table is about 130 short of<br />
that given in Church Statistics 2001, not a<br />
material concern.<br />
Another dif#culty is the possible<br />
mistaken inclusion of listed buildings<br />
which are not normal, operating churches<br />
– such as partially destroyed buildings,<br />
and mausoleums in churchyards. These<br />
may inadvertently have been included,<br />
particularly when I was working from lists<br />
provided by the diocese. This was a<br />
particular problem with Lon<strong>do</strong>n diocese ,<br />
where the number of churches in the<br />
table may therefore be a little too high.<br />
Finally, many dioceses pointed out that<br />
the numbers may have slipped out of date<br />
as they are not always noti#ed when the<br />
grade of listing is changed. An advantage<br />
of listing is that it requires no activity until<br />
a parish wishes to make a change to a<br />
building; it may only be at this time that a<br />
diocese will update its records.<br />
I have used this data in Table 2.2 in<br />
Section 2. For that table, I assumed that<br />
Wake#eld had the same proportion of<br />
listed churches as York, Carlisle as<br />
Newcastle, and Liverpool as Manchester.<br />
Even if these assumptions are wrong, the<br />
relatively small number of churches<br />
involved mean that the overall<br />
proportions are not much affected.
HOW DO WE KEEP OUR <strong>PARISH</strong> <strong>CHURCHES</strong>? • APPENDICES 67<br />
Table F1<br />
The approximate number of listed churches, by diocese, where provided (2003)<br />
I II* II A B C<br />
Not<br />
listed 1 Total 1 Percent<br />
hi-grade 2 Percent<br />
listed<br />
Bath & Wells 199 221 105 (45) (570) 74% 92%<br />
Birmingham 16 29 43 7 7 5 88 195 30% 55%<br />
Blackburn 14 38 95 2 5 (134) (288) 19% 53%<br />
Bradford 20 15 64 1 2 (64) (166) 23% 61%<br />
Bristol 57 50 40 53 200 54% 74%<br />
Canterbury 135 51 16 8 26 21 (72) (329) 67% 78%<br />
Carlisle 3<br />
Chelmsford 150 117 106 241 614 43% 61%<br />
Chester 39 61 142 (133) (375) 27% 65%<br />
Chichester 179 82 65 20 8 (162) (516) 54% 69%<br />
Coventry 50 63 49 6 14 7 22 211 63% 90%<br />
Derby 60 73 95 109 337 39% 68%<br />
Durham 38 21 112 127 298 20% 57%<br />
Ely 131 135 37 23 326 82% 93%<br />
Exeter 188 185 222 22 617 60% 96%<br />
Gloucester 142 127 77 39 385 70% 90%<br />
Guildford 33 41 57 3 4 76 214 36% 64%<br />
Hereford 88 127 79 1 45 14 (86) (426) 61% 83%<br />
Leicester 61 160 65 (42) (328) 67% 87%<br />
Lichfield 62 130 164 13 5 (211) (585) 35% 64%<br />
Lincoln 256 159 168 56 639 65% 91%<br />
Liverpool<br />
Lon<strong>do</strong>n 4 84 96 133 4 12 11 161 501 39% 68%<br />
Manchester 12 41 135 147 335 16% 56%<br />
Newcastle 40 23 86 (98) (247) 26% 60%<br />
Norwich 318 255 (38) 5 (37) 5 648 88% 94%<br />
Oxford 6 216 291 143 162 812 62% 80%<br />
Peterborough 163 155 34 1 3 27 383 84% 93%<br />
Portsmouth 30 35 62 (46) (173) 38% 73%<br />
Ripon & Leeds 37 37 93 (97) (264) 28% 63%<br />
Rochester 43 43 26 2 28 13 (108) (263) 44% 59%<br />
St Albans 6 133 101 84 (93) (411) 57% 77%<br />
St Edms & Ips 233 184 40 21 478 87% 96%<br />
Salisbury 181 174 105 11 27 9 67 574 68% 88%<br />
Sheffield 36 29 66 77 208 31% 63%<br />
So<strong>do</strong>r & Man 7 5 5 6 28 44 23% 36%<br />
Southwark 29 49 78 1 12 18 181 368 25% 51%<br />
South<strong>we</strong>ll 109 74 74 57 314 58% 82%<br />
Truro 130 80 54 49 313 67% 84%<br />
Wakefield<br />
Winchester 8 82 103 106 3 12 12 95 (413) 48% 77%<br />
Worcester 44 68 47 4 25 16 65 269 52% 76%<br />
York 153 115 172 165 605 44% 73%<br />
TOTAL 3996 3843 3383 49 251 148 3693 15242 53% 77%<br />
NOTES<br />
1. The figures for ‘Total’ and ‘Not listed’ <strong>we</strong>re not<br />
always requested from dioceses. If ‘Total’ was<br />
extracted from Church Statistics 2001, itis<br />
placed in brackets; similarly if ‘not-listed’ has<br />
been calculated by subtracting the number of<br />
listed buildings from the ‘Total’ figure, it is placed<br />
in brackets.<br />
2. ‘Hi-grade’ means Grade I or II* or A or B.<br />
3. Carlisle figures currently being revised.<br />
4. For Lon<strong>do</strong>n, see text.<br />
5. The number of Grade II / unlisted buildings in<br />
Norwich was estimated by halving the number<br />
of buildings which <strong>we</strong>re not Grade I or II*.<br />
6. The figures for St Albans and Oxford<br />
combine grade A with I, B with II* and II with C.<br />
7. The churches in So<strong>do</strong>r & Man are not listed,<br />
they are ‘registered’, and there are no grades<br />
within registration. Sixteen churches are<br />
registered, and I have assigned them equally<br />
bet<strong>we</strong>en the three main grades of listing.<br />
8. The number of unlisted churches for<br />
Winchester is broadly correct. The listed<br />
numbers are pro-rated up from work in<br />
progress, a tabulation of churches which<br />
covered about three-quarters of the churches in<br />
the diocese.
68 TREVOR COOPER • HOW DO WE KEEP OUR <strong>PARISH</strong> <strong>CHURCHES</strong>? • 2004 • www.ecclsoc.org<br />
Appendix G: Measuring support for<br />
Church of England church buildings<br />
G1: Introduction<br />
For the purposes of this paper <strong>we</strong> would<br />
like to know <strong>how</strong> many individuals regard<br />
themselves as responsible for maintaining<br />
church buildings, especially in those cases<br />
where the number of people is small, and<br />
the building therefore at greater risk.<br />
I #rst discuss each of the available<br />
measures and then the actual data,<br />
concentrating on small church<br />
communities. The results are used in<br />
Section 2.2.<br />
G2: Existing measures<br />
Parishes not buildings<br />
A fundamental dif#culty is that the<br />
measures collected centrally by the CoE<br />
refer to parishes, not buildings.<br />
With <strong>our</strong> focus on buildings, this<br />
causes us problems, because a large<br />
number of parishes have two buildings or<br />
more. There is no national break<strong>do</strong>wn of<br />
this: all <strong>we</strong> know is that there are about<br />
#ve church buildings for every f<strong>our</strong><br />
parishes (16220 church buildings, 12,951<br />
parishes, in 2001). A sensible guess would<br />
be that about 8,000 or 9,000 parishes are<br />
looking after just one building, and<br />
bet<strong>we</strong>en 3,000 and 4,000 looking after two<br />
or more.<br />
For a parish with more than one<br />
building, any measurement of income or<br />
number of people should be divided by<br />
the number of buildings, in order to<br />
understand <strong>how</strong> much support each<br />
individual building receives. We cannot <strong>do</strong><br />
this, because <strong>we</strong> <strong>do</strong> not know which<br />
parishes to apply the corrections to.<br />
Many multi-church parishes are those<br />
with relatively low levels of support. The<br />
available #gures will therefore mask the<br />
pressures and dif#culties which are faced<br />
by some of the more vulnerable church<br />
buildings, because they hide the fact that<br />
limited res<strong>our</strong>ces are split bet<strong>we</strong>en two or<br />
more buildings.<br />
Usual Sunday attendance<br />
For nearly 40 years, attendance in the CoE<br />
has been measured using Usual Sunday<br />
Attendance (uSa). This an estimate, made<br />
by the parish, of the typical number of<br />
people attending church on Sundays.<br />
There are several dif#culties with the<br />
uSa, the last three of which involve its<br />
failure to re$ect current patterns of<br />
churchgoing.<br />
a) It is not a <strong>we</strong>ll-de#ned measure,<br />
relying on the common sense of the<br />
parish. Different parishes and dioceses <strong>do</strong><br />
it differently.<br />
b) There may be direct #nancial<br />
incentives for the parish to report lo<strong>we</strong>r<br />
rather than higher #gures.<br />
c) The measure takes no account of the<br />
monthly cycle of services. In particular,<br />
family services once a month often attract<br />
very many more people than other<br />
services.<br />
d) It ignores attendance at services<br />
during the <strong>we</strong>ek.<br />
e) It ignores the fact that many<br />
churchgoers <strong>do</strong> not attend church every<br />
Sunday. This is discussed in the following<br />
two paragraphs.<br />
Attendance at some Sundays<br />
The uSa measures typical attendance on a<br />
Sunday. This means that it understates<br />
support. For example, there may be 80<br />
people at a church Sunday after Sunday,<br />
but it will not be exactly the same 80<br />
people – the number of individuals who<br />
attend the church on some but not<br />
necessarily all Sundays (and thus support<br />
the church on a more or less regular basis)<br />
will be more than 80.<br />
The number of individuals who attend<br />
worship regularly, but not every Sunday,<br />
is signi#cant. Various surveys have<br />
provided percentage uplifts which can<br />
be applied to typical Sunday attendance<br />
to allow for those who <strong>do</strong> not attend<br />
every Sunday. 1 Ho<strong>we</strong>ver it is not safe to<br />
use that approach here, because <strong>we</strong> are<br />
particularly interested in small<br />
congregations, and <strong>we</strong> <strong>do</strong> not know if<br />
small congregations s<strong>how</strong> the same<br />
patterns of attendance as larger ones.<br />
New measures of routine<br />
attendance<br />
To mitigate the dif#culties listed in<br />
points a) to e) above, the CoE introduced<br />
in the year 2000 a new way of measuring<br />
attendance. The older measure, uSa,<br />
continues to be collected. The new<br />
method is properly de#ned, and <strong>do</strong>es<br />
not have direct #nancial implications for<br />
the parish.<br />
During a f<strong>our</strong>-<strong>we</strong>ek period in October,<br />
attendance at each and every service is<br />
counted (in the year 2000, this included<br />
<strong>we</strong>ekday <strong>we</strong>ddings and funerals, but they<br />
<strong>we</strong>re not included in subsequent years).<br />
Parishes are instructed to count just once<br />
any individual attending more than one<br />
service during a particular <strong>we</strong>ek, so <strong>do</strong>uble<br />
counting should be small.<br />
As regards Sunday, this means that the<br />
number of people for each of f<strong>our</strong><br />
Sundays in October is known for each<br />
church. From this the highest, the lo<strong>we</strong>st<br />
and the average Sunday attendance are<br />
recorded for each church.<br />
Similar #gures are recorded for<br />
entire-<strong>we</strong>ek attendance at each church<br />
(known, perhaps confusingly, as ‘<strong>we</strong>ekly’<br />
attendance).<br />
This gives six #gures per church:<br />
average Sunday attendance (ASA) and<br />
average <strong>we</strong>ekly (i.e. entire-<strong>we</strong>ek)<br />
attendance (AWA); lo<strong>we</strong>st Sunday<br />
attendance and lo<strong>we</strong>st <strong>we</strong>ekly attendance;<br />
highest Sunday attendance and highest<br />
<strong>we</strong>ekly attendance (HWA). The<br />
emboldened #gures are s<strong>how</strong>n in<br />
Table G1.<br />
A f<strong>our</strong>-<strong>we</strong>ek period in October is not<br />
ideal, as it may contain Harvest Festival, a<br />
particularly popular service (and in some<br />
years it may not contain it, thus making<br />
the measurement more variable). But no<br />
month is without problems, and in<br />
Table G1<br />
Recent levels of adult commitment to<br />
the CoE<br />
Units: thousands of people<br />
For definitions of measures, see text<br />
Year<br />
2000 2001 2002<br />
uSa n/a 781 765<br />
ASA 878 1 868 835<br />
AWA 1031 1 976 937<br />
HWA 1451 1 1332 1291<br />
Electoral<br />
roll<br />
1377 1372 1206 2<br />
Notes<br />
1. The figures for ASA, AWA, and HWA included<br />
<strong>we</strong>ekday <strong>we</strong>ddings and funerals in 2000, but not in<br />
subsequent years.<br />
2. The Electoral Roll was pruned in 2002, and<br />
s<strong>how</strong>s the sharp drop which normally occurs when<br />
this is <strong>do</strong>ne.<br />
S<strong>our</strong>ce: Church Statistics 2001, and CoE<br />
provisional statistics, 2002
HOW DO WE KEEP OUR <strong>PARISH</strong> <strong>CHURCHES</strong>? • APPENDICES 69<br />
Table G2<br />
All-age attendance per church<br />
building (all churches, averaged) at<br />
special services, compared with<br />
usual Sunday attendance (2001)<br />
Christmas Day / Eve attendance 161<br />
HWA 105<br />
Easter attendance 98<br />
Christmas communicants 76<br />
Easter communicants 70<br />
ASA 64<br />
Usual Sunday attendance 58<br />
For definitions, see text<br />
S<strong>our</strong>ce: Church Statistics 2001<br />
ecumenical discussions this was felt to be<br />
the best choice.<br />
The measure which is closest in<br />
meaning to the old uSa is ‘average Sunday<br />
attendance’ (ASA). Overall, the adult ASA<br />
is about 10% higher than the adult uSa,<br />
perhaps for reasons a), b) and c) above;<br />
but no-one knows for sure.<br />
The nearest one can get to the size of<br />
the regular worshipping community at the<br />
church – the number of individual people<br />
who attend once or more per month on<br />
some day of the <strong>we</strong>ek – is probably to use<br />
the highest <strong>we</strong>ekly attendance (HWA);<br />
that is, using the #gures for that <strong>we</strong>ek in<br />
October which had the greatest number<br />
of individuals attending services at that<br />
church on one or more days over the<br />
entire <strong>we</strong>ek. Of c<strong>our</strong>se, this is not perfect,<br />
as some regular attenders will have<br />
attended in a <strong>we</strong>ek different to that in<br />
which the highest attendance occurred,<br />
Table G3<br />
All-age attendance per rural church<br />
(averaged) at special services,<br />
compared with usual Sunday<br />
attendance (1994)<br />
Christmas carol service 72<br />
Harvest Festival 71<br />
Easter Day 59<br />
Christmas communicants 1 55<br />
Easter Day communicants 47<br />
Remembrance Sunday 46<br />
Mothering Sunday 43<br />
Christmas midnight 42<br />
Christmas Day 37<br />
Usual Sunday attendance 2 31<br />
Good Friday 18<br />
Notes<br />
1.Over all Christmas services<br />
2. We <strong>do</strong> not know whether ‘usual Sunday<br />
attendance’ was interpreted by respondents<br />
in the same way as in their annual returns to<br />
the CoE used elsewhere in this appendix.<br />
S<strong>our</strong>ce: Francis and Martineau, Rural<br />
Mission; see Appendix E for details<br />
and this will depress the numbers (and<br />
some very rare attenders may happen to<br />
have turned up during the busiest <strong>we</strong>ek,<br />
which will in$ate them). But it is probably<br />
the best that can be <strong>do</strong>ne. Overall, the<br />
adult HWA is about 70% higher than the<br />
adult uSa, and about the same size as the<br />
electoral roll.<br />
Electoral Roll<br />
The ‘electoral roll’ for a parish church is a<br />
list of people over the age of 16 who have<br />
registered for the roll and are thus entitled<br />
to vote in the election of the Parochial<br />
Church Council (PCC) for that parish<br />
church. Residence in the parish is<br />
common but is not a requirement of<br />
registration (if not resident, one must be a<br />
habitual worshipper at the church). An<br />
individual may be on more than one<br />
electoral roll; I <strong>do</strong> not know <strong>how</strong><br />
common this is.<br />
As enrolment is a voluntary step, it<br />
implies some form of commitment to the<br />
church, and is thus the closest the CoE has<br />
to ‘membership’. The electoral roll is<br />
pruned once every six years, when it drops<br />
sharply in size before starting to grow<br />
again as people ask for their names to be<br />
added.<br />
In considering <strong>how</strong> to allocate funds,<br />
the CoE has sometimes found it useful to<br />
de#ne ‘membership’ as Sunday<br />
attendance (uSa up to 1999, thereafter<br />
ASA) plus one third of the difference<br />
bet<strong>we</strong>en the electoral roll and Sunday<br />
attendance.<br />
Occasional attendance<br />
A #nal set of indicators of commitment is<br />
attendance at special services, such as<br />
Easter Day or Harvest Festival. Tables G2<br />
(for all churches) and G3 (rural churches<br />
only) s<strong>how</strong> that all-age attendance at the<br />
most popular of these can be about two<br />
and a half times the typical Sunday<br />
attendance, about half as high again as<br />
HWA.<br />
Ho<strong>we</strong>ver, although turning up once or<br />
twice a year may provide an indication of<br />
the level of support to be expected if the<br />
church building <strong>we</strong>re under threat of<br />
redundancy (and may even understate<br />
this), it probably tells us little about the<br />
routine level of support, which is what<br />
interests us.<br />
F<strong>our</strong> measures of support<br />
In summary, <strong>we</strong> have f<strong>our</strong> measures of<br />
routine support for an individual church,<br />
as s<strong>how</strong>n in Table G1:<br />
• Usual Sunday attendance (uSa),<br />
the traditional method, for which <strong>we</strong><br />
have many years data;<br />
• Average Sunday attendance<br />
(ASA), a new measure (the average<br />
attendance on f<strong>our</strong> Sundays in<br />
October), which captures the typical<br />
number of individuals attending on<br />
Sundays;<br />
• Highest <strong>we</strong>ekly attendance<br />
(HWA), a new measure (the highest<br />
entire-<strong>we</strong>ek attendance occurring in<br />
a f<strong>our</strong>-<strong>we</strong>ek period in October),<br />
which is probably the nearest <strong>we</strong> can<br />
get to the number of individual<br />
people who worship at the church at<br />
least once per month; and<br />
• Church electoral roll, for which<br />
<strong>we</strong> have many years data: it <strong>do</strong>es not<br />
imply attendance, but <strong>do</strong>es indicate<br />
some level of commitment.<br />
Difficulties<br />
We have already discussed the fact that all<br />
these measures refer to parishes, not<br />
church buildings. All of the measures will<br />
exaggerate the support for church<br />
buildings in multi-church parishes.<br />
In addition, there is a dif#culty in those<br />
cases where services are held in a rota by<br />
neighb<strong>our</strong>ing parishes, as sometimes<br />
happens in rural areas.<br />
To see this, imagine the case where two<br />
neighb<strong>our</strong>ing parishes share services on<br />
alternate Sundays. Suppose ten people<br />
from each parish attend; then there will be<br />
t<strong>we</strong>nty people at each service. The new<br />
measures will s<strong>how</strong> an average attendance<br />
of t<strong>we</strong>nty for each parish, thus exaggerating<br />
the degree of support for each of the<br />
church buildings. Note that this<br />
measurement problem only occurs if<br />
individuals attend service regardless of<br />
which church building is being used.<br />
This problem arises because, for each<br />
parish, only those Sundays when a service<br />
is being held are included in the measure.<br />
If a service is not held, it <strong>do</strong>es not affect<br />
the measure. So the same person can be<br />
counted as attending in two different<br />
parishes. The traditional measure (uSa)<br />
<strong>do</strong>es not have this ‘rota’ problem, because<br />
it counts all Sundays, recording zero<br />
attendance at non-service Sundays, so<br />
would s<strong>how</strong> a uSa of ten people at each<br />
parish (at least, this is <strong>how</strong> it is <strong>do</strong>ne in<br />
some dioceses).<br />
How big a problem is this? I am told<br />
(personal communication, CoE) that the<br />
potential problem was discussed when the<br />
new measures <strong>we</strong>re introduced, and not<br />
expected to be signi#cant. All of this <strong>do</strong>es<br />
emphasise the dif#culty of measuring<br />
levels of support for smaller congregations<br />
who <strong>do</strong> not conform to the traditional<br />
pattern of services every Sunday.
70 TREVOR COOPER • HOW DO WE KEEP OUR <strong>PARISH</strong> <strong>CHURCHES</strong>? • 2004 • www.ecclsoc.org<br />
Table G4<br />
Adult attendance (various measures) and size of electoral roll in CoE parishes (2001)<br />
(12,951 parishes; all figures rounded)<br />
For explanation of measures, see text<br />
Number<br />
of adults<br />
Percentage of parishes<br />
Adult attendance (different measures)<br />
Electoral<br />
roll<br />
uSa ASA AWA HWA<br />
1to5 1 1 1 0<br />
6to10 9 5 5 3<br />
} 3<br />
11 to 20 21 19 17 11 9<br />
21 to 30 13 14 13 10 10<br />
31 to 50 16 17 16 15<br />
51 to 100 24 24 24 26 } 78<br />
Over 100 16 20 24 35<br />
For each column, total 100% = 12,951 parishes<br />
S<strong>our</strong>ce: CoE, personal communication<br />
G3: Church buildings with<br />
low levels of routine<br />
support<br />
In this sub-section, <strong>we</strong> will look at the<br />
various measures of adult support for<br />
churches with low attendance.<br />
How <strong>do</strong>es ASA compare with the older<br />
measure, uSa, for small congregations? As<br />
can be seen from Table G4, the uSa<br />
measure s<strong>how</strong>s more parishes with<br />
attendance of ten adults or fe<strong>we</strong>r than<br />
<strong>do</strong>es the ASA measure (10% as against<br />
6%, all #gures rounded). Similarly there<br />
are more parishes with uSa of eleven to<br />
t<strong>we</strong>nty adults (21%) than have an ASA of<br />
this size (19%).<br />
This is probably for two reasons. First,<br />
as discussed above, ASA is normally a little<br />
higher than uSa simply because of the way<br />
it is counted. This causes no problems.<br />
Secondly, the ASA may exaggerate<br />
attendance, because of the ‘rota’ effect<br />
discussed above. Ho<strong>we</strong>ver, the broad<br />
correspondence bet<strong>we</strong>en HWA and the<br />
electoral roll for these parishes – matching<br />
the global correspondence bet<strong>we</strong>en these<br />
#gures – might suggest that ASA is being<br />
more or less correctly measured at the<br />
lo<strong>we</strong>r end. All <strong>we</strong> can say is that the<br />
number of parishes with very low ASA<br />
attendance might be greater than s<strong>how</strong>n<br />
in Table G4.<br />
It is helpful that <strong>we</strong> can cross-check the<br />
Sunday attendance #gures with another<br />
s<strong>our</strong>ce. This is a strati#ed survey of 25%<br />
of Anglican churches carried out in<br />
September1998 (the English Church<br />
Attendance Survey). These #gures, which<br />
include both adults and children, are<br />
s<strong>how</strong>n in Table G5. Note that those #lling<br />
in the returns <strong>we</strong>re asked to count only<br />
once any individuals attending more than<br />
once on Sunday. This data suggests that<br />
there are rather more tiny congregations<br />
than indicated by the #gure for ASA, with<br />
8% of churches having attendance of ten<br />
people or fe<strong>we</strong>r including children.<br />
We can conclude that at least 6% (800)<br />
of parishes have a typical Sunday<br />
attendance of ten adults or fe<strong>we</strong>r, and the<br />
#gure is probably higher than this. This<br />
#gure is for parishes; it will be higher for<br />
church buildings, but <strong>we</strong> <strong>do</strong> not know<br />
<strong>how</strong> much higher with the data to hand.<br />
The broad picture is clear, and for <strong>our</strong><br />
purposes the precise #gures hardly matter.<br />
How many people have a sense of<br />
routine commitment to the building? For<br />
Table G5<br />
Sunday attendance at CoE churches, all<br />
ages (September 1998)<br />
Attendance<br />
(all<br />
ages)<br />
Churches with this<br />
attendance<br />
% number<br />
1–10 8.0 1300<br />
11–25 21.5 3500<br />
26–50 25.4 4140<br />
51 – 100 23.6 3840<br />
101 – 150 11.0 1790<br />
151 – 200 4.6 750<br />
201 – 300 3.5 570<br />
301 – 400 1.5 240<br />
401 – 500 0.6 100<br />
500+ 0.3 50<br />
100% =<br />
16,280<br />
16,280<br />
S<strong>our</strong>ce: English Church Attendance Survey,<br />
Christian Research (personal communication)<br />
small congregations, the #gure for AWA is<br />
more or less the same as for ASA, no<br />
<strong>do</strong>ubt re$ecting the fact that there are few<br />
services during the <strong>we</strong>ek at these small<br />
churches (as con#rmed by the Rural<br />
Churches Survey).<br />
The #gures for the electoral roll and<br />
HWA in Table G4 are similar to each<br />
other, and perhaps provide the best<br />
measure of support. They s<strong>how</strong> that about<br />
3% of parishes (nearly 400) can count on<br />
ten adults or fe<strong>we</strong>r to support their<br />
church building, or buildings. Something<br />
bet<strong>we</strong>en 9% (electoral roll) and 11%<br />
(HWA) of parishes, approximately 1,300<br />
parishes, can count on the support of<br />
bet<strong>we</strong>en 11 and 20 adults.<br />
On average there are #ve church<br />
buildings for every f<strong>our</strong> parishes. If the<br />
average applies across these smaller<br />
parishes, it implies a minimum of 500<br />
church buildings (and probably more)<br />
with ten or fe<strong>we</strong>r committed adults. On<br />
the next rung of the ladder, there are<br />
probably about 1,600 churches which will<br />
obtain routine support from bet<strong>we</strong>en<br />
eleven and t<strong>we</strong>nty adults.<br />
Note<br />
1. See e.g. Brierley, Tide, page 73 and<br />
following; Statistics: a Tool for Mission (Church<br />
House Publishing, 2000).
HOW DO WE KEEP OUR <strong>PARISH</strong> <strong>CHURCHES</strong>? • ABBREVIATIONS, GLOSSARY, BIBLIOGRAPHY 71<br />
Abbreviations, glossary, bibliography<br />
Abbreviations<br />
CCC: Council for the Care of Churches;<br />
CCT: Churches Conservation Trust;<br />
CoE: Church of England; DAC: Diocesan<br />
Advisory Committee; DCMS: Department<br />
of Culture, Media and Sport; EH: English<br />
Heritage; HCPT: Historic Churches<br />
Preservation Trust; HLF: Heritage Lottery<br />
Fund; PCC: Parochial Church Council.<br />
Glossary<br />
In this report, church is used only of<br />
Anglican buildings, or their worshipping<br />
communities, in England. It excludes<br />
other denominations. It includes parish<br />
churches, daughter churches, chapels,<br />
mission chapels and so forth, but excludes<br />
cathedrals and other greater churches.<br />
A diocese is a bishop’s area of<br />
responsibility, split into several<br />
archdeaconries, which are themselves<br />
split into a number of deaneries.A<br />
diocese will normally have several<br />
hundred parishes, each deanery perhaps<br />
t<strong>we</strong>nty or thirty. A parish may have one or<br />
more church buildings.<br />
The Diocesan Advisory Committee<br />
(DAC) is a statutory body which advises<br />
whether proposed changes and repairs to<br />
church buildings should proceed.<br />
Permission to proceed is called a faculty.<br />
The church electoral roll is a list of<br />
people over the age of 16 who have<br />
registered for the roll and are thus entitled<br />
to vote in the election of the Parochial<br />
Church Council (PCC) for their parish<br />
church. See Appendix G.<br />
Listing, carried out by the Department<br />
of Culture, Media and Sport, indicates<br />
that a building is of particular interest.<br />
There are three grades of listing. Grade I<br />
means that the building is ‘of exceptional<br />
interest’. Grade II* indicates a ‘particularly<br />
important building of more than special<br />
interest’. Grade II buildings are of ‘special<br />
interest, warranting every effort to<br />
preserve them’. An older categorisation,<br />
still applying to a few churches, is into<br />
Grades A, B and C, which <strong>do</strong> not map<br />
precisely onto I, II* and II.<br />
A redundant church building is one<br />
no longer required for use for regular<br />
worship. To become redundant, a church<br />
has to move through a statutory<br />
procedure. See Section 2.<br />
Stipendiary clergy are clergy who are<br />
paid (receive a stipend). They are usually<br />
full-time.<br />
Usual Sunday attendance and<br />
Average Sunday Attendance are<br />
discussed in Appendix G.<br />
Bibliography<br />
Church of England policy The<br />
recently-agreed policy for church<br />
buildings is described with valuable<br />
supporting material in A Future for Church<br />
Buildings (2003), issued by the General<br />
Synod of the Church of England (ref:<br />
GS1514), available from the Church<br />
House Bookshop, 31 Great Smith Street,<br />
SW1P 3BN, .<br />
Raw attendance and #nancial<br />
statistics The CoE issues Church Statistics<br />
each year. Copies can be <strong>do</strong>wnloaded<br />
from the CoE <strong>we</strong>bsite <br />
or obtained from Church House<br />
Bookshop, address above. For<br />
background, see Statistics: a Tool for Mission<br />
(Church House Publishing, 2000).<br />
Christian Research publish a <strong>we</strong>alth on<br />
statistics on all aspects of religious<br />
observance in their series UKCH Religious<br />
Trends, ed. Peter Brierley, 4 volumes<br />
published to date (volume 4 published in<br />
2003, ISBN 1853211494), available from<br />
Christian Research, 4 Footscray Road, SE9<br />
2TZ. Figures relating to rural churches<br />
will be found in Leslie Francis and Jeremy<br />
Martineau, Rural Mission (Acora<br />
Publishing, 2002, ISBN 0954076613),<br />
available from the Arthur Rank Centre,<br />
Stoneleigh Park, Warwickshire, CV82LZ<br />
(). Data<br />
on the #nancial situation of the CoE can<br />
be found in Financial Overview 2003 (ref:<br />
GS1516, issued 2003); Forthcoming<br />
Financial Issues (ref: GS1433, issued 2001);<br />
and First to the Lord (f<strong>our</strong>th impression,<br />
issued 2000), all issued by the CoE,<br />
available from Church House Bookshop,<br />
address above. For a summary of diocesan<br />
#nances, see ‘Digging deeper, cutting<br />
further’, in the Church Times, 25 July 2003.<br />
The ORB survey of attitudes towards<br />
churches is at .<br />
Interpretation of trends in church<br />
participation Of the considerable<br />
literature on levels of participation in<br />
church life, the following have been used<br />
directly. Peter Brierley’s The Tide is<br />
Running Out (Christian Research, 2000,<br />
ISBN 1853211370), address above, uses<br />
data from the 1998 Church Attendance<br />
Survey and previous surveys to explain<br />
what is happening to church attendance,<br />
and to argue for new ways forward. Bob<br />
Jackson’s Hope for the Church: Contemporary<br />
Strategies for Growth (Church House<br />
Publishing, 2002, ISBN 0715155512), uses<br />
statistical evidence to analyse attendance<br />
patterns and suggest <strong>how</strong> churches can<br />
grow. The Myth of the Empty Church (SPCK,<br />
1993, ISBN 0281046433), by Robin Gill,<br />
s<strong>how</strong>s that the decline in the proportion<br />
of the population attending church<br />
stretches back a long way, and that the<br />
Victorians built more churches than <strong>we</strong>re<br />
required (a revised version is now<br />
available, The “Empty” Church Revisited<br />
(Aldershot, 2003, ISBN 0754634620),<br />
published by Ashgate). More<br />
controversially, he argues that empty<br />
buildings are a cause of the decline in<br />
attendance. In Callum Brown’s The Death<br />
of Christian Britain: Understanding<br />
Secularisation 1800–2000 (Routledge, 2001,<br />
ISBN0415241847) the author also takes<br />
the long view, though argues for a more<br />
recent cause for secularisation, related to<br />
the socialising role of women; he argues<br />
that public Christian observance in Britain<br />
will see further decline.<br />
Victorian activity For church<br />
restoration and building in Victorian<br />
times, see Gill, Myth (details above), and<br />
the excellent articles in Chris Brooks &<br />
Andrew Saint (eds.), The Victorian Church:<br />
Architecture and <strong>Society</strong> (Manchester, 1995,<br />
ISBN 0719040205), particularly (for <strong>our</strong><br />
purposes) the articles by Saint, Brooks,<br />
Miele, and Cherry, and the Introduction.<br />
Reports on the overall condition of<br />
churches An old but fascinating study is<br />
the 1953 report, The Preservation of <strong>our</strong><br />
Churches (Church Information Board,<br />
1952). More recent are the Churches Needs<br />
Survey, written by Geoffrey Claridge, and<br />
issued in 1998 by EH and the CCC;and<br />
two reports by Jeremy Eckstein Associates.<br />
The #rst was The Impact of VAT on Church<br />
Properties, commissioned by the Churches<br />
Main Committee, published in 2000, and<br />
available on their <strong>we</strong>bsite at<br />
. The<br />
second, issued in 2001, is An Assessment of<br />
the Needs of Listed Places of Worship in Use<br />
across the UK. I comment on these three<br />
reports in Appendix A. For the<br />
maintenance of historic buildings, see the<br />
Maintain <strong>our</strong> Heritage <strong>we</strong>bsite<br />
.<br />
Reports by individual dioceses The<br />
Manchester Survey of Churches in the<br />
Diocese of Manchester (c. 1997) was
72 TREVOR COOPER • HOW DO WE KEEP OUR <strong>PARISH</strong> <strong>CHURCHES</strong>? • 2004 • www.ecclsoc.org<br />
commissioned jointly by English Heritage<br />
and the diocese of Manchester. It has<br />
valuable insights into an over-churched<br />
urban setting. In Chelmsford the Review<br />
of the Church Buildings of the Diocese (March<br />
2003), , sets the scene in a<br />
useful way. The Peterborough report<br />
Setting God’s People Free (2002),<br />
There are about 16,000 Church of England churches – more churches than<br />
petrol stations. More than 12,000 are listed, with two-thirds of these being in<br />
the highest grades, Grade I or II*. This is by far the largest estate of listed<br />
buildings in the country.<br />
This huge portfolio of buildings is kept by the efforts of church congregations –<br />
in essence small, independent, groups of volunteers. Bet<strong>we</strong>en them they have<br />
been spending more than £80m a year on repairs, only about £30m of which<br />
has come from grants – the remainder is from their own pockets or their efforts<br />
at fund-raising. How <strong>we</strong>ll <strong>do</strong>es this work? And will it – can it – continue?<br />
Details of the cover photographs will be found on the reverse of the title page<br />
ISBN 0 946823 16 2