PARISH CHURCHES? how do we keep our - Ecclesiological Society
PARISH CHURCHES? how do we keep our - Ecclesiological Society
PARISH CHURCHES? how do we keep our - Ecclesiological Society

Create successful ePaper yourself
Turn your PDF publications into a flip-book with our unique Google optimized e-Paper software.
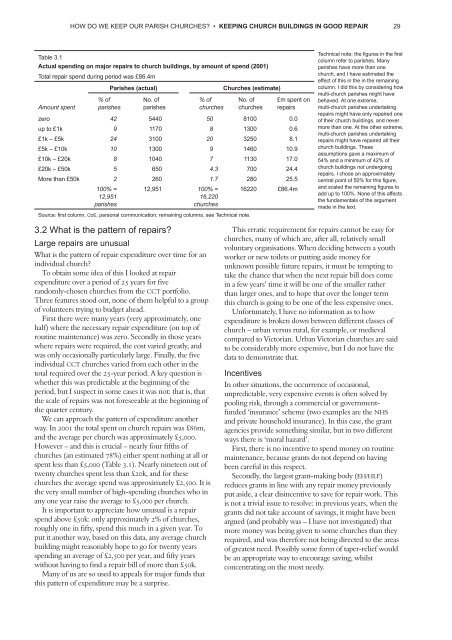
HOW DO WE KEEP OUR <strong>PARISH</strong> <strong>CHURCHES</strong>? • KEEPING CHURCH BUILDINGS IN GOOD REPAIR 29<br />
Table 3.1<br />
Actual spending on major repairs to church buildings, by amount of spend (2001)<br />
Total repair spend during period was £86.4m<br />
Parishes (actual)<br />
Churches (estimate)<br />
Amount spent<br />
%of<br />
parishes<br />
No. of<br />
parishes<br />
%of<br />
churches<br />
No. of<br />
churches<br />
£m spent on<br />
repairs<br />
zero 42 5440 50 8100 0.0<br />
up to £1k 9 1170 8 1300 0.6<br />
£1k – £5k 24 3100 20 3250 8.1<br />
£5k – £10k 10 1300 9 1460 10.9<br />
£10k – £20k 8 1040 7 1130 17.0<br />
£20k – £50k 5 650 4.3 700 24.4<br />
More than £50k 2 260 1.7 280 25.5<br />
100% =<br />
12,951<br />
parishes<br />
12,951 100% =<br />
16,220<br />
churches<br />
S<strong>our</strong>ce: first column, CoE, personal communication; remaining columns, see Technical note.<br />
16220 £86.4m<br />
Technical note: the figures in the first<br />
column refer to parishes. Many<br />
parishes have more than one<br />
church, and I have estimated the<br />
effect of this in the in the remaining<br />
column. I did this by considering <strong>how</strong><br />
multi-church parishes might have<br />
behaved. At one extreme,<br />
multi-church parishes undertaking<br />
repairs might have only repaired one<br />
of their church buildings, and never<br />
more than one. At the other extreme,<br />
multi-church parishes undertaking<br />
repairs might have repaired all their<br />
church buildings. These<br />
assumptions gave a maximum of<br />
54% and a minimum of 42% of<br />
church buildings not undergoing<br />
repairs. I chose an approximately<br />
central point of 50% for this figure,<br />
and scaled the remaining figures to<br />
add up to 100%. None of this affects<br />
the fundamentals of the argument<br />
made in the text.<br />
3.2 What is the pattern of repairs?<br />
Large repairs are unusual<br />
What is the pattern of repair expenditure over time for an<br />
individual church?<br />
To obtain some idea of this I looked at repair<br />
expenditure over a period of 25 years for #ve<br />
ran<strong>do</strong>mly-chosen churches from the CCT portfolio.<br />
Three features stood out, none of them helpful to a group<br />
of volunteers trying to budget ahead.<br />
First there <strong>we</strong>re many years (very approximately, one<br />
half) where the necessary repair expenditure (on top of<br />
routine maintenance) was zero. Secondly in those years<br />
where repairs <strong>we</strong>re required, the cost varied greatly, and<br />
was only occasionally particularly large. Finally, the #ve<br />
individual CCT churches varied from each other in the<br />
total required over the 25-year period. A key question is<br />
whether this was predictable at the beginning of the<br />
period, but I suspect in some cases it was not: that is, that<br />
the scale of repairs was not foreseeable at the beginning of<br />
the quarter century.<br />
We can approach the pattern of expenditure another<br />
way. In 2001 the total spent on church repairs was £86m,<br />
and the average per church was approximately £5,000.<br />
Ho<strong>we</strong>ver – and this is crucial – nearly f<strong>our</strong> #fths of<br />
churches (an estimated 78%) either spent nothing at all or<br />
spent less than £5,000 (Table 3.1). Nearly nineteen out of<br />
t<strong>we</strong>nty churches spent less than £20k, and for these<br />
churches the average spend was approximately £2,500. It is<br />
the very small number of high-spending churches who in<br />
any one year raise the average to £5,000 per church.<br />
It is important to appreciate <strong>how</strong> unusual is a repair<br />
spend above £50k: only approximately 2% of churches,<br />
roughly one in #fty, spend this much in a given year. To<br />
put it another way, based on this data, any average church<br />
building might reasonably hope to go for t<strong>we</strong>nty years<br />
spending an average of £2,500 per year, and #fty years<br />
without having to #nd a repair bill of more than £50k.<br />
Many of us are so used to appeals for major funds that<br />
this pattern of expenditure may be a surprise.<br />
This erratic requirement for repairs cannot be easy for<br />
churches, many of which are, after all, relatively small<br />
voluntary organisations. When deciding bet<strong>we</strong>en a youth<br />
worker or new toilets or putting aside money for<br />
unknown possible future repairs, it must be tempting to<br />
take the chance that when the next repair bill <strong>do</strong>es come<br />
in a few years’ time it will be one of the smaller rather<br />
than larger ones, and to hope that over the longer term<br />
this church is going to be one of the less expensive ones.<br />
Unfortunately, I have no information as to <strong>how</strong><br />
expenditure is broken <strong>do</strong>wn bet<strong>we</strong>en different classes of<br />
church – urban versus rural, for example, or medieval<br />
compared to Victorian. Urban Victorian churches are said<br />
to be considerably more expensive, but I <strong>do</strong> not have the<br />
data to demonstrate that.<br />
Incentives<br />
In other situations, the occurrence of occasional,<br />
unpredictable, very expensive events is often solved by<br />
pooling risk, through a commercial or governmentfunded<br />
‘insurance’ scheme (two examples are the NHS<br />
and private household insurance). In this case, the grant<br />
agencies provide something similar, but in two different<br />
ways there is ‘moral hazard’.<br />
First, there is no incentive to spend money on routine<br />
maintenance, because grants <strong>do</strong> not depend on having<br />
been careful in this respect.<br />
Secondly, the largest grant-making body (EH/HLF)<br />
reduces grants in line with any repair money previously<br />
put aside, a clear disincentive to save for repair work. This<br />
is not a trivial issue to resolve: in previous years, when the<br />
grants did not take account of savings, it might have been<br />
argued (and probably was – I have not investigated) that<br />
more money was being given to some churches than they<br />
required, and was therefore not being directed to the areas<br />
of greatest need. Possibly some form of taper-relief would<br />
be an appropriate way to enc<strong>our</strong>age saving, whilst<br />
concentrating on the most needy.