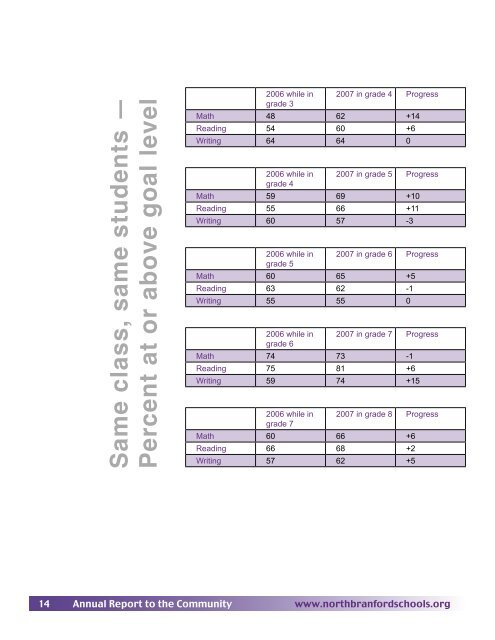
Same class, same students — Percent at or above goal level 2006 while in 2007 in grade 4 Progress grade 3 Math 48 62 +14 Reading 54 60 +6 Writing 64 64 0 2006 while in 2007 in grade 5 Progress grade 4 Math 59 69 +10 Reading 55 66 +11 Writing 60 57 -3 2006 while in 2007 in grade 6 Progress grade 5 Math 60 65 +5 Reading 63 62 -1 Writing 55 55 0 2006 while in 2007 in grade 7 Progress grade 6 Math 74 73 -1 Reading 75 81 +6 Writing 59 74 +15 2006 while in 2007 in grade 8 Progress grade 7 Math 60 66 +6 Reading 66 68 +2 Writing 57 62 +5 14 <strong>Annual</strong> <strong>Report</strong> to <strong>the</strong> Community www.northbranfordschools.org
CMT4 Summary <strong>of</strong> Findings: Goal Level Comparisons 2006-2007 Grade 8 Grade 7 Grade 6 Grade 5 Grade 4 Grade 3 Same grade • The percent <strong>of</strong> students meeting <strong>the</strong> state goal is 50% in math, 57% in reading, and 64% in writing. • Compared to <strong>the</strong> same grade in 2006, <strong>the</strong>re is a 2% increase <strong>of</strong> students meeting goal in math, 3% increase in reading, and no change in writing. Same class: • No information available since grade 3 is <strong>the</strong> first year <strong>of</strong> state assessment administration. Same grade • The percent <strong>of</strong> students meeting <strong>the</strong> state goal is 62% in math, 60% in reading, and 64% in writing. • Compared to <strong>the</strong> same grade in 2006, 3% more students met goal level in math, 5% more in reading, and 4% more in writing. Same class • Compared to <strong>the</strong> same class in 2006, 14% more students met goal level in math, 6% more in reading, and <strong>the</strong>ir performance level was maintained in writing. Same grade • The percent <strong>of</strong> students meeting <strong>the</strong> state goal is 69% in math, 66% in reading, and 57% in writing. • Compared to <strong>the</strong> same grade in 2006, 9% more students met goal level in math, 3% more in reading, and 2% more writing. Same class • Compared to <strong>the</strong> same class in 2006, 10% more students met goal level in math, 11% more in reading, and 3% fewer in writing. Same grade • The percent <strong>of</strong> students meeting <strong>the</strong> state goal is 65% in math, 62% in reading, and 55% in writing. • Compared to <strong>the</strong> same grade in 2006, 9% fewer students met goal in math, a 13% less in reading, and 4% fewer in writing. Same class • Compared to <strong>the</strong> same class in 2006, 5% more students reached goal level in math, 1% less in reading and <strong>the</strong>ir performance level was maintained in writing. Same grade • The percent <strong>of</strong> students meeting <strong>the</strong> state goal is 73% in math, 81% in reading, and 74% in writing. • Compared to <strong>the</strong> same grade in 2006, 13% more students met goal in math, 15% more in reading, and 12% more in writing. Same class • Compared to <strong>the</strong> same class in 2006, 1% fewer students met goal in math, 6% more in reading, and 15% more in writing. Same grade • The percent <strong>of</strong> students meeting <strong>the</strong> state goal is 66% in math, 68% in reading, and 62% in writing. • Compared to <strong>the</strong> same grade in 2006, 5% fewer students met goal in math, 5% fewer in reading, and <strong>the</strong>ir performance level was maintained in writing. Same class • Compared to <strong>the</strong> same class in 2006, 6% more students met goal in math, 3% more in reading, and 5% in writing. CMT4 Summary <strong>of</strong> Findings 15