Pensions Fund Annual Report 2011-12 , item 18. PDF 4 MB
Pensions Fund Annual Report 2011-12 , item 18. PDF 4 MB
Pensions Fund Annual Report 2011-12 , item 18. PDF 4 MB

Create successful ePaper yourself
Turn your PDF publications into a flip-book with our unique Google optimized e-Paper software.
I n v e s t m e n t r e p o r t<br />
Investment performance<br />
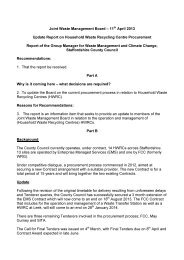
The graph below compares the fund return over the past 10 years against inflation, via the Retail<br />
Prices Index and Average Weekly Earnings. It can be clearly seen that the fund has performed well<br />
over the past decade versus inflation and earnings.<br />
The value of all three measures, 10 years prior to the end of <strong>2011</strong>/20<strong>12</strong>, have been rebased to 100<br />
and the graph shows the performance of each measure on 31 March of each year since.<br />
180.0<br />
170.0<br />
160.0<br />
150.0<br />
140.0<br />
130.0<br />
<strong>12</strong>0.0<br />
110.0<br />
100.0<br />
90.0<br />
80.0<br />
70.0<br />
2002 2003 2004 2005 2006 2007 2008 2009 2010 <strong>2011</strong> 20<strong>12</strong><br />
Average Weekly Earnings<br />
Retail Prices Index<br />
<strong>Fund</strong> return<br />
DRAFT174.8<br />
DRAFT138.1<br />
DRAFT138.0<br />
DRAFT<br />
13