Download - Carl Zeiss, Inc.
Download - Carl Zeiss, Inc.
Download - Carl Zeiss, Inc.

You also want an ePaper? Increase the reach of your titles
YUMPU automatically turns print PDFs into web optimized ePapers that Google loves.
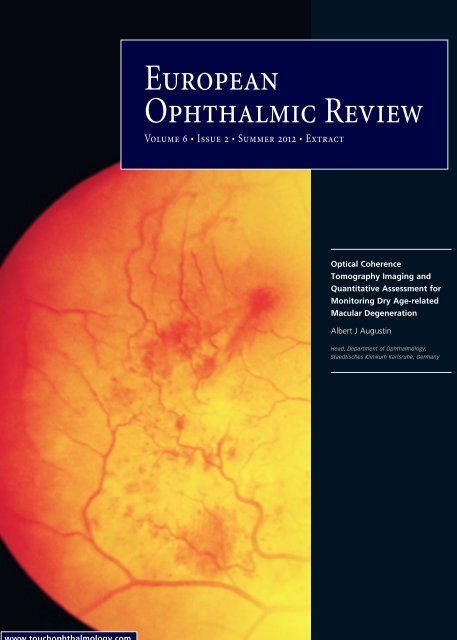
European<br />
Ophthalmic Review<br />
Volume 6 • Issue 2 • Summer 2012 • Extract<br />
Optical Coherence<br />
Tomography Imaging and<br />
Quantitative Assessment for<br />
Monitoring Dry Age-related<br />
Macular Degeneration<br />
Albert J Augustin<br />
Head, Department of Ophthalmology,<br />
Staedtisches Klinikum Karlsruhe, Germany<br />
www.touchophthalmology.com
Imaging<br />
Optical Coherence Tomography Imaging and Quantitative Assessment for<br />
Monitoring Dry Age-related Macular Degeneration<br />
Albert J Augustin<br />
Head, Department of Ophthalmology, Staedtisches Klinikum Karlsruhe, Germany<br />
Abstract<br />
The purpose of this article is to show the feasibility of the ‘Advanced [retinal pigment epithelium] RPE analysis’ software tool to measure<br />
drusen area and volume as well as the area of geographic atrophy (GA) in patients with dry age-related macular degeneration (AMD). The<br />
source data from spectral domain optical coherence tomography (SD-OCT) images obtained from three patients with confirmed dry AMD<br />
using Cirrus HD-OCT (<strong>Carl</strong> <strong>Zeiss</strong> Meditec) were re-evaluated with the new software analysis tool Advanced RPE analysis. The area of<br />
GA as well as drusen area and volume were measured and analysis of results were presented along with calculated values in two clearly<br />
arranged screens. Changes between visits were easily detectable and could be followed over time. Results correlated well with clinical<br />
observation. The conclusion reached was that the new Advanced RPE analysis software allows the automated, objective and quantitative<br />
assessment of atrophic lesions and drusen. It thus could prove to be useful in determining disease stages as well as prognosis more<br />
precisely, and provides the opportunity to monitor the effectiveness of new therapies in clinical trials.<br />
Keywords<br />
Spectral domain optical coherence tomography (SD-OCT), imaging, drusen, geographic atrophy, age-related macular degeneration (AMD),<br />
dry AMD, Advanced retinal pigment epithelium (RPE) analysis tool<br />
Disclosure: The author has no conflicts of interest to declare.<br />
Received: 15 February 2012 Accepted: 20 March 2012 Citation: European Ophthalmic Review, 2012;6(2):72–7<br />
Correspondence: Albert J Augustin, Staedtisches Klinikum Karlsruhe, Augenklinik, Moltkestrasse 90, 76133 Karlsruhe, Germany. E: albertjaugustin@googlemail.com<br />
Support: The publication of this article was funded by <strong>Carl</strong> <strong>Zeiss</strong> Meditec.<br />
Age-related macular degeneration (AMD) is the leading cause of<br />
blindness among elderly individuals in developed industrialised<br />
countries and affects approximately 30–50 million people worldwide. 1–4<br />
There are two forms of AMD: dry AMD (dAMD) which accounts for<br />
about 80 % of all cases of AMD, and neovascular AMD (nAMD). Early<br />
stage AMD is characterised by soft drusen (protein and lipid deposits<br />
between retinal pigment epithelium [RPE] and Bruch’s membrane) and<br />
pigment abnormalities (hyper- or hypopigmentation). Visual acuity is<br />
usually not deteriorated in early stages of AMD. However, they can<br />
progress to late stages of AMD: geographic atrophy (GA; late stage of<br />
dAMD) or neovascular AMD. Vision loss due to AMD is mainly<br />
attributable to these advanced forms. It is estimated that due to<br />
demographic changes, in 2020 the vision-threatening advanced forms<br />
will increase by more than 50 %. 5 Thus, a better understanding of the<br />
pathogenesis may lead to the development of new powerful therapies<br />
and is a matter of public and economic concern.<br />
While there are several therapeutic approaches for nAMD, so far there are<br />
no established guidelines for dry AMD treatment. Although vitamin<br />
supplementation can slow the progression of dAMD in advanced forms,<br />
uncritical administration is not advisable due to possible adverse<br />
reactions. 6,7 New drugs and advanced concepts for the treatment of dry<br />
AMD are waiting for further investigation. 8–11 However, their evaluation of<br />
efficacy against dry AMD turns out to be difficult and time consuming. In<br />
contrast to nAMD, patients with dry AMD can maintain good central visual<br />
acuity until the disease progresses into the foveal centre. Thus,<br />
visual acuity might not be an appropriate clinical end-point in early stage<br />
clinical trials to determine drug efficacy against dry AMD. Therefore, new<br />
reliable clinical trial end-points enabling efficacy evaluation in the shortest<br />
period of time are needed. Furthermore, diagnostic methods should be<br />
established which allow for reliable, objective, automated and quantitative<br />
assessment of disease progression in large patient populations.<br />
As eyes with soft indistinct drusen or retinal pigmentary abnormalities<br />
at baseline are more likely to develop late AMD as compared to eyes<br />
without these lesions, 12 two encouraging options to monitor progression<br />
of dry AMD are the volumetric assessment of drusen as well as<br />
localisation and quantitative assessment of atrophic lesions in GA.<br />
The gold standard for assessing drusen number and size as well as<br />
pigmentary changes are stereoscopic colour fundus photographs<br />
analysed by qualified reading centres. 13,14 Fundus autofluorescence<br />
(FAF) has also been used for imaging of atrophic lesions in GA to<br />
indicate GA progression. 15–17 However, accuracy delineating GA by<br />
fundus photography has been reported to be moderate, 14,18–20 and both<br />
approaches allow for two-dimensional assessment of the macula only,<br />
so volumetric measurement of drusen and quantitative measurement<br />
of disease progression is impossible. Quantitative assessment of<br />
drusen, however, might become an important parameter in clinical<br />
trials to evaluate efficacy of new drugs against AMD. 21,22<br />
2 © TOUCH BRIEFINGS 2012
Monitoring Dry Age-related Macular Degeneration<br />
Here, spectral domain optical coherence tomography (SD-OCT)<br />
imaging offers several advantages: the same scan pattern can be<br />
used to obtain image data on both drusen and atrophic lesions of GA;<br />
it allows for acquiring three-dimensional data providing more detailed<br />
information on disease-specific changes in retinal structures; and it<br />
permits volumetric measurement of drusen for quantitative<br />
assessment of drusen progression as well as determination of lesion<br />
size in GA. 21–28 Bearelly et al. demonstrated that SD-OCT margins of GA<br />
can be easily identified on SD-OCT fundus images and that B-scans<br />
relative to these GA margins can be graded for quantifying<br />
photoreceptor losses, and Lujan et al. reported that SD-OCT fundus<br />
images can be used to identify and measure areas of GA. 25,26<br />
However, manual grading of SD-OCT images is time-consuming and<br />
carries the risk of interobserver variability. Recently, a new SD-OCT<br />
software analysis tool has been developed, mainly based on two new<br />
algorithms, which allows the automated and quantitative assessment<br />
of changes in drusen size and volume as well as in changes of GA<br />
areas and should allow the monitoring patients with AMD. The<br />
software received the Conformité Européenne (CE) mark in November<br />
2011 and the Food and Drug Administration has granted approval to<br />
<strong>Carl</strong> <strong>Zeiss</strong> Meditec (Dublin, California, US) for this new software<br />
analysis tool for Cirrus HD-OCT. Here we present the first feasibility<br />
study of this new analysis tool.<br />
Methods<br />
Source data from SD-OCT images obtained from three patients using<br />
the Cirrus HD-OCT were re-evaluated with the new software analysis<br />
tool Advanced [retinal pigment epithelium] RPE analysis (<strong>Carl</strong> <strong>Zeiss</strong><br />
Meditec). Advanced RPE analysis was performed on macula 512 x 128<br />
scan data from visits of three patients featuring different<br />
characteristics of confirmed dAMD.<br />
Advanced RPE Analysis Tool<br />
The Advanced RPE analysis software analysis tool is part of the new<br />
Cirrus 6.0 software and provides basically two new algorithms.<br />
One measures elevations in the RPE for identifying drusen, and one<br />
measures areas of sub-RPE illumination where the OCT beam is able<br />
to penetrate through to the choroid, indicating that the RPE is<br />
atrophic. Variance in measurements is reduced by identifying the<br />
foveal centre on the OCT fundus image using an automated fovea<br />
localisation algorithm and comparing measurements from regions<br />
within circles of 3 and 5 mm centred on the fovea. The algorithm to<br />
detect the fovea attempts to identify the reduction in tissue between<br />
the RPE and the inner limiting membrane that occurs at the fovea.<br />
In the presence of floaters or significant tissue disruption, this<br />
algorithm may fail. In these cases, the clinician may identify the fovea<br />
manually. All calculations are centred on the fovea as identified by<br />
either the algorithm or the clinician.<br />
Retinal Pigment Epithelium Elevation Map<br />
The RPE elevation map is used to automatically determine drusen<br />
area and volume. It is important to understand that RPE segmentation<br />
is used as the starting point for the drusen analysis. So strictly<br />
speaking this analysis detects elevations in the RPE. To identify<br />
elevations, a curve is fitted to the RPE segmentation that seeks to<br />
exclude deformations of the RPE and follow the curvature of the eye.<br />
The region between the RPE segmentation and the curve fit is<br />
designated as RPE elevation. To allow for some variability in fitting,<br />
only areas where the elevation exceeds 10 pixels (19.5 μm) are used<br />
for calculations of RPE elevation area and volume. The RPE elevation<br />
map is an en face image presented in a pseudo-colour map using a<br />
colour scale that highlights elevations above 20 μm. This map is<br />
presented as a transparent image overlaying the OCT fundus.<br />
Transparency is preset at 50 %, although it can be adjusted manually.<br />
Sub-retinal Pigment Epithelium Slab<br />
The sub-RPE slab is a 6 by 6 mm image that represents a sum of the<br />
OCT reflectivity values measured beneath the RPE. The sub-RPE slab<br />
tends to be brighter in areas where significant OCT light penetrates<br />
below the RPE and returns to be collected. The image tends to be<br />
dimmer in areas of the retina where the RPE is intact because the RPE<br />
is highly scattered and absorbing and tends to prevent light from<br />
penetrating and returning to be detected by the OCT device. When the<br />
RPE has atrophied, the penetration of light beneath the RPE is<br />
increased, and the subsequent bright area on the sub-RPE slab can be<br />
used to determine the area of GA. Geographic atrophy is visualised as<br />
a bright area on the image due to the increased penetration of light<br />
into the choroid where atrophy has occurred in the macula. This<br />
increased light penetration associated with GA arises from the<br />
absence of the RPE and choriocapillaris, which are the two layers of<br />
the eye that normally cause the incident light to scatter and prevent<br />
deeper transmission of light into the choroid. The brightness on the<br />
OCT fundus image results from the summation of this increased light<br />
penetration relative to the surrounding tissue which still contains the<br />
intact RPE and choriocapillaris. This effect is enhanced in the sub-RPE<br />
slab image. The OCT image volume beneath the level of the RPE is<br />
processed to create a two-dimensional en face projection image that<br />
shows bright spots where the atrophy of RPE allows light to penetrate<br />
into the choroid. Segmentation is then performed on this en face<br />
image to identify areas of high sub-RPE illumination.<br />
Presentation of Analysis Results<br />
Within the Advanced RPE analysis tool, there are two screens<br />
available for reviewing the results. The first screen shows both the<br />
sub-RPE illumination results (sub-RPE slab with segmented lesions<br />
shown as outlines) and the RPE elevation (RPE elevation map)<br />
separately as en face images along with the corresponding horizontal<br />
tomograms (B-scan). The second screen shows a map (RPE profile)<br />
that integrates both analyses (RPE elevation and sub-RPE illumination)<br />
visualising all detected disturbances in the RPE. Furthermore, the<br />
following calculated values are presented along with a calculation of<br />
current minus prior and percentage change:<br />
• area of RPE elevations (mm 2 ) within 3 and 5 mm circle;<br />
• volume of RPE elevations (mm 3 ) within 3 and 5 mm circle;<br />
• area of sub-RPE illumination in 5 mm circle; and<br />
• distance measurement (mm) from nearest sub-RPE illumination<br />
to fovea.<br />
Results<br />
Case 1<br />
Case 1 represents data of an 86-year-old female with confirmed<br />
dAMD with drusen and GA in both eyes. Both eyes had cataract<br />
surgery with implantation of a blue light filtering intraocular lens.<br />
There was no history of other eye operations apart from that. Best<br />
corrected visual acuity (BCVA) in the left eye was 0.5 (20/40). SD-OCT<br />
data of the left eye collected at first and last visit (July 2011/January<br />
2012) are compared in this Advanced RPE analysis to monitor disease.<br />
First screen analysis displays RPE elevation map as an overlay on the<br />
EUROPEAN OPHTHALMIC REVIEW 3
Imaging<br />
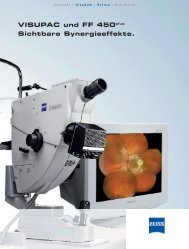
Figure 1: Advanced RPE Analysis of Case 1 – First<br />
Screen Analysis<br />
penetration of light is seen in the corresponding B-scan as well (see<br />
Figure 1, B-scan). The red line indicating the distance from the fovea<br />
to the closest area with sub-RPE illumination is very short and almost<br />
not visible in this analysis as GA has almost but not yet reached the<br />
fovea (see Figure 1, sub-RPE slab, left side).<br />
In the RPE elevation map, RPE elevations are seen, especially within<br />
the 5 mm circle. There are also elevations outside the measurement<br />
area, which is indicated by a warning message. The RPE elevations<br />
indicating drusen increase between the two visits (see Figure 1).<br />
Quantitative conclusions are presented in the calculation analysis in<br />
the second screen (see Figure 2).<br />
(1) Retinal pigment epithelium (RPE) elevation map overlaid on fundus image; (2) Circles on<br />
the RPE elevation map centred on the fovea location; (3) Sub-RPE slab with overlaid<br />
segmentation of sub-RPE illumination; (4) Horizontal tomogram showing RPE elevation<br />
segmentation line; (5) Fovea is marked as a red dot; line from fovea connecting closest sub-<br />
RPE illumination area. On the left side, data of prior visit are provided for direct comparison<br />
with data of the last visit (right side).<br />
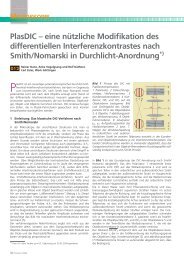
Figure 2: Advanced RPE Analysis of Case 1 – Second<br />
Screen Analysis Exhibiting the RPE Profile, an Image<br />
that Combines the RPE Elevation Map and the Sub-RPE<br />
Illumination Segmentation<br />
Second screen analysis shows the ‘RPE profile’ which integrates RPE<br />
elevation map and sub-RPE illumination: the sub-RPE illumination is<br />
overlaid on the RPE elevation and shown as an outline. This slab shows<br />
the location of the fovea with a dot marking and a circle corresponding<br />
to 5 mm in diameter centred on the fovea. Furthermore, calculated<br />
values are presented in a table (see Figure 2). Calculated values show<br />
that from July 2011 until January 2012 the drusen area increased by<br />
0.4 mm (23.5 % change) within the 5 mm circle, whereas drusen<br />
volume increased from 0.06–0.07 mm 3 . In addition, the atrophic area<br />
changed from 0.6–0.7 mm 2 , which is within the test/retest variability<br />
for these measurements and thus could be regarded as measurement<br />
noise rather than real change (see Figure 2). These results correlate<br />
well with the authors’ clinical observation.<br />
Case 2<br />
Case 2 represents data of a 79-year-old female with confirmed dAMD<br />
with drusen and GA in both eyes. Both eyes had cataract surgery with<br />
implantation of a non-blue light filtering intraocular lens. There was no<br />
history of other eye operations apart from that. Best corrected visual<br />
acuity of the left eye was 0.25 and BCVA of the right eye was 0.16.<br />
SD-OCT data from left and right eye collected at first visit (October<br />
2011) are presented in a ‘Patient report’, which can be printed after<br />
Advanced RPE analysis and can be kept with the patient’s documents.<br />
The Patient report shows all relevant data including RPE elevation<br />
map (1), sub-RPE slab (2), RPE profile (3) and the calculation analysis<br />
(see Figure 3A and B).<br />
The sub-retinal pigment epithelium (RPE) illumination segmentation is overlaid on the RPE<br />
elevation map and shown with an outline. A table with calculated values of RPE elevation<br />
(area and volume) and atrophic area as well as a calculation of current minus prior and<br />
percentage change is also provided. For direct comparison, data of prior visit are provided<br />
on the left side, data of the last visit on the right side.<br />
fundus image. The map shows circles corresponding to 3 and 5 mm in<br />
diameter centred on the fovea. The pseudo-colour aids in identifying<br />
bumps and discontinuities in the RPE. Legends at the lateral margins<br />
of the map show correlation of colour to the height of the elevations.<br />
Furthermore, the sub-RPE slab with overlaid segmentation of sub-RPE<br />
illumination within 5 mm circle centred on the fovea is presented.<br />
Data of the first visit are presented on the left side, data of the last<br />
visit are presented on the right side (see Figure 1).<br />
The sub-RPE slab shows perifoveal regions of increased penetration<br />
of light through the RPE, consistent with GA. This increased<br />
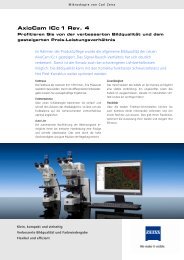
Case 2 represents a typical case of dAMD in which atrophy of the RPE<br />
results in a bright lesion that can be seen as a bright area in the<br />
sub-RPE slab image. Figure 3a shows RPE analysis of the left eye,<br />
Figure 3b shows RPE analysis of the right eye. Both show some<br />
elevations within the 3 mm circle, indicating drusen. The sub-RPE<br />
slabs of both eyes present a central region where the penetration of<br />
light to the choroid is very strong, indicating an area of GA covering<br />
the fovea. The red line usually indicating the distance from the fovea<br />
to the closest area with sub-RPE illumination is not visible in this<br />
analysis as GA covers the fovea already in both eyes. This correlates<br />
well with our clinical observations and the low BCVA of 0.25 (left eye)<br />
and 0.16 (right eye).<br />
Case 3<br />
Case 3 represents data of an 83-year-old male with confirmed dAMD<br />
with drusen and GA in both eyes. Both eyes have cataract with no<br />
history of eye operations. Best corrected visual acuity of the left eye<br />
was 0.16 and BCVA of the right eye was 0.6. SD-OCT data of both eyes<br />
collected at first visit (December 2012) are presented in a Patient<br />
report (see Figure 4A and B).<br />
4<br />
EUROPEAN OPHTHALMIC REVIEW
Monitoring Dry Age-related Macular Degeneration<br />
This is another typical case of dAMD in both eyes. In the left eye (see<br />
Figure 4A) there are few RPE elevations visible in the RPE elevation<br />
map. The sub-RPE slab shows a large central region where the<br />
penetration of light to the choroid is very strong, indicating that GA<br />
already covers the fovea. These results correlate well with our fundus<br />
examinations and the BCVA of 0.16 in the left eye. In the right eye<br />
there is a large perifoveal area with strong penetration of light into the<br />
choroid, indicating that the geographic area has not yet reached<br />
the fovea. Retinal pigment epithelium elevation map shows that there<br />
are some elevations within the 5 mm circle, indicating drusen.<br />
This correlates well with our fundus examination and a BCVA of 0.6 in<br />
the right eye.<br />
Figure 3: Patient Reports (Print-outs) of Advanced RPE<br />
Analysis of Case 2, Presenting Data of the Left Eye<br />
(Figure 3A) and the Right Eye, Respectively (Figure 3B)<br />
A<br />
Discussion<br />
This first feasibility study including case reports of three patients<br />
representing different features of dry AMD shows that with the newly<br />
developed Advanced RPE analysis software analysis tool the status of<br />
the RPE can be objectively and automatically examined in detail and<br />
can be followed over time. Drusen area and volume as well as area of<br />
GA can be measured and analysis results are presented along with<br />
calculated values in two clearly arranged screens. An automated<br />
fovea localisation algorithm assures that measurements from regions<br />
within circles of 3 and 5 mm centred on the fovea are compared, and<br />
as data of prior and current visit are placed side by side, changes<br />
between visits are easily detectable and can be followed over time.<br />
Another major advantage of SD-OCT imaging lies in using only one<br />
type of scan for documenting both en face and cross-sectional<br />
images of the retina. It therefore provides more detailed insight in<br />
retinal alterations of GA patients than FAF, which has already been<br />
described. 25–27 As on the first screen analysis, the fundus image is<br />
presented along with the corresponding B-scans, which offers<br />
the opportunity to comfortably gather detailed information about the<br />
retinal structural changes in these areas (see Figure 1). This<br />
contributes to better understanding of the relationship between GA<br />
enlargement, loss of photoreceptor/RPE and visual loss, and thus<br />
could help to expand the knowledge of disease-specific retinal<br />
alterations and disease progression.<br />
B<br />
Efficacy and reproducibility of both new algorithms for identifying<br />
RPE-elevation and sub-RPE illumination underlying this new tool<br />
have been shown already. Yehoshua et al. evaluated in a prospective<br />
study with 81 eyes the area and enlargement rate of atrophic lesions<br />
with a mean follow-up time of one, 24 years. They demonstrated high<br />
reproducibility of this algorithm and concluded that SD-OCT fundus<br />
images can be used to visualise and quantify GA and that precision is<br />
sufficient to reliably measure lesions as small as 0.12 mm 2 (0.05 DA). 28<br />
Gregori et al. quantitatively assessed drusen volume and area in 103<br />
eyes from 74 patients with drusen and concluded that the new<br />
algorithm was highly reproducible for qualitative and quantitative<br />
assessment of drusen. 22<br />
Using the Advanced RPE analysis tool, we were able to automatically<br />
measure areas of GA as well as drusen area and volume in three<br />
patients with confirmed dAMD. Results from the RPE analysis were<br />
in agreement with our clinical observations in all cases. Although the<br />
authors here present only three cases of dAMD within this first feasibility<br />
study, it seems reasonable to say that the new software provides for the<br />
first time the possibility for automatically quantitative and volumetric<br />
assessment of drusen. As drusen are a meaningful parameter of AMD,<br />
this tool may help to better evaluate disease progression. However, it<br />
(1) Retinal pigment epithelium (RPE) elevation map; (2) Sub-RPE illumination; (3) RPE profile; (4)<br />
Table of calculated values. Sub-RPE illumination indicates an area of geographic atrophy already<br />
covering the fovea in both eyes. Both eyes show some RPE elevations indicating drusen.<br />
has to be kept in mind, that very shallow drusen
Imaging<br />
Figure 4: Patient Reports (Print-outs) of Advanced RPE Analysis of Case 3, Presenting Data of the Left Eye<br />
(Figure 4A) and the Right Eye Respectively (Figure 4B)<br />
A<br />
B<br />
While, in the left eye, the sub-retinal pigment epithelium (RPE) slab shows a large central region of sub-RPE illumination, indicating that the area of geographic atrophy has already covered<br />
the fovea, in the right eye, penetration of light to the choroid appears in the perifoveal region only, indicating that the area of geographic atrophy does not cover the fovea. RPE elevations<br />
(indicating drusen) are visible in both eyes in varying amounts.<br />
deformations must be associated with pigmentary changes and thus<br />
will not appear on fundus photographs. Therefore, both methods offer<br />
complementary information and may thus have an important role in<br />
assessing drusen in patients with AMD. 22<br />
So far, a limitation of the new analysis tool might be that only lesions<br />
fitting within the 5 mm circle centred around the fovea can be<br />
measured and evaluated. However, this might be resolved with new<br />
algorithms that are capable of assembling multiple overlapping<br />
SD-OCT images, so that any area can be measured.<br />
Conclusion<br />
Today, SD-OCT allows for high-speed, high-resolution imaging of<br />
retinal structures and provides non-invasive three-dimensional<br />
information on retinal pathology in situ and in real time. It thus leads<br />
to a more profound understanding of a patient’s RPE status, which<br />
is a relevant structure in all forms of AMD. Within the new Advanced<br />
RPE analysis software, SD-OCT technology is combined with robust<br />
algorithms that allow for automated, quantitative assessment of<br />
drusen and atrophic lesions, and could allow for more objective and<br />
easier classification of AMD. As drusen and atrophic lesions can<br />
be evaluated from the same scan pattern, all forms of AMD can be<br />
assessed quantitatively. Furthermore it allows for the detection of<br />
morphologic alterations over time, which should – in conjunction<br />
with functional testing – aid in the stratification of stages of disease<br />
progression. This would be useful for monitoring progression of<br />
disease over time and provides the opportunity to monitor the<br />
effectiveness of new therapies in clinical trials. Of course, in this<br />
context it is of utmost importance to define and evaluate reliable<br />
and reproducible parameters for grading AMD using SD-OCT. As<br />
the new software tool allows for objective and automated<br />
measurements, large patient populations can be monitored easily.<br />
In this respect it is also advantageous that SD-OCT images based<br />
on former Cirrus HD-OCT software can be re-evaluated with the<br />
new analysis tool. Furthermore, it has already been described that<br />
the junctional zone of GA is the site of disease activity and will<br />
be the target for effective therapeutic strategies against dAMD. 23<br />
Here, the new analysis tool could prove useful as it provides<br />
simultaneous measurement of GA along with three-dimensional<br />
visualisation of the RPE and thus can comfortably be used to<br />
gain new insight in microstructural changes underlying disease<br />
progression. The authors’ results with this new analysis tool are<br />
promising, although further studies evaluating reproducibility,<br />
efficacy and feasibility of this new RPE analysis tool are required. n<br />
1. Resnikoff S, Pascolini D, Etya’ale D, et al., Global data on<br />
visual impairment in the year 2002, Bull World Health Organ,<br />
2004;82:844–51.<br />
2. Klein R, Klein BE, Lee KE, et al., Changes in visual acuity in a<br />
population over a 15-year period: the Beaver Dam Eye Study,<br />
Am J Ophthalmol, 2006;142:532–49.<br />
3. Gehrs KM, Anderson DH, Johnson LV, Hageman GS, Agerelated<br />
macular degeneration –emerging pathogenetic and<br />
therapeutic concepts, Ann Med, 2006;38:450–71.<br />
4. Klein R, Chou CF, Klein BE, et al., Prevalence of age-related<br />
macular degeneration in the US population, Arch Ophthalmol,<br />
2011;129:75–80.<br />
5. Friedman DS, O’Colmain BJ, Muñoz B, et al., Eye Diseases<br />
Prevalence Research Group. Prevalence of age-related<br />
macular degeneration in the United States, Arch Ophthalmol,<br />
2004;122:564–72.<br />
6. Age-Related Eye Disease Study Research Group, A<br />
randomized, placebo-controlled, clinical trial of high-dose<br />
supplementation with vitamins C and E, beta carotene, and<br />
zinc for age-related macular degeneration and vision loss:<br />
AREDS report no. 8, Arch Ophthalmol, 2001; 119:1417–36.<br />
7. Augustin AJ, Schmidt-Erfurth U, Kritische worte zur<br />
ARED-Studie, Ophthalmologe, 2002; 99:299–300.<br />
8. Heidrich H, Harnisch JP, Ranft J, PGE1 bei seniler<br />
maculadegeneration. Pilot-Studie, Klin Monatsbl Augenheilkd,<br />
1989;194:282–4.<br />
9. Ladewig MS, Ladewig K, Güner M, Heidrich H, Prostaglandin<br />
E1 infusion therapy in dry age-related macular degeneration,<br />
Prostaglandins Leukot Essent Fatty Acids, 2005;72:251–6.<br />
10. Multicenter Investigation of Rheopheresis for AMD (MIRA-1)<br />
6<br />
EUROPEAN OPHTHALMIC REVIEW
Monitoring Dry Age-related Macular Degeneration<br />
Study Group, Pulido JS, Multicenter prospective, randomized,<br />
double-masked, placebo-controlled study of rheopheresis to<br />
treat nonexudative age-related macular degeneration:<br />
Interim analysis, Trans Am Ophthalmol Soc, 2002;100:85–108.<br />
11. Zarbin MA, Rosenfeld PJ, Pathway-based therapies for agerelated<br />
macular degeneration: an integrated survey of<br />
emerging treatment alternatives, Retina, 2010;30:1350–67.<br />
12. Klein R, Klein BE, Tomany SC, et al., Ten-year incidence and<br />
progression of age-related maculopathy: The Beaver Dam<br />
eye study, Ophthalmology, 2002;109:1767–79.<br />
13. Klein R, Davis MD, Magli YL, et al., The Wisconsin Age-<br />
Related Maculopathy Grading System, Ophthalmology,<br />
1991; 98:1128–34.<br />
14. Davis MD, Gangnon RE, Lee LY, et al., Age-Related Eye<br />
Disease Study Research Group, The Age-Related Eye<br />
Disease Study severity scale for age-related macular<br />
degeneration: AREDS report no. 17, Arch Ophthalmol,<br />
2005;123:1484 –98.<br />
15. Holz FG, Bindewald-Wittich A, Fleckenstein M, et al.,<br />
Progression of geographic atrophy and impact of fundus<br />
autofluorescence patterns in age-related macular<br />
degeneration, Am J Ophthalmol, 2007; 143:463–72.<br />
16. Holz FG, Bellman C, Staudt S, et al., Fundus autofluorescence<br />
and development of geographic atrophy in age-related<br />
macular degeneration, Invest Ophthalmol Vis Sci,<br />
2001; 42:1051–6.<br />
17. Schmitz-Valckenberg S, Bindewald-Wittich A, Dolar-Szczasny<br />
J, et al., Correlation between the area of increased<br />
autofluorescence surrounding geographic atrophy and<br />
disease progression in patients with AMD, Invest Ophthalmol Vis<br />
Sci, 2006;47:2648 –54.<br />
18. Sunness JS, Ziegler MD, Applegate CA, Issues in quantifying<br />
atrophic macular disease using retinal autofluorescence,<br />
Retina, 2006; 26:666–72.<br />
19. Scholl HP, Peto T, Dandekar S, et al., Inter- and intraobserver<br />
variability in grading lesions of age-related<br />
maculopathy and macular degeneration, Graefes Arch Clin Exp<br />
Ophthalmol, 2003; 241:39–47.<br />
20. Pirbhai A, Sheidow T, Hooper P, Prospective evaluation of<br />
digital non-stereo color fundus photography as a screening<br />
tool in age-related macular degeneration, Am J Ophthalmol,<br />
2005; 139:455–61.<br />
21. Yehoshua Z, Rosenfeld PJ, Gregori G, Penha F, Spectral<br />
domain optical coherence tomography imaging of dry agerelated<br />
macular degeneration, Ophthalmic Surg Lasers Imaging,<br />
2010;41:S6–14.<br />
22. Gregori G, Wang F, Rosenfeld PJ, et al., Spectral domain<br />
optical coherence tomography imaging of drusen in nonexudative<br />
age-related macular degeneration, Ophthalmology,<br />
2011;118:1373–9.<br />
23. Sayegh RG, Simader C, Scheschy U, et al., A systematic<br />
comparison of spectral domain optical coherence<br />
tomography and fundus autofluorescence in patients with<br />
geographic atrophy, Ophthalmology, 2011;118:1844–51.<br />
24. Yehoshua Z, Rosenfeld PJ, Gregori G, et al., Natural history of<br />
drusen morphology in age-related macular degeneration<br />
using spectral domain optical coherence tomography,<br />
Ophthalmology, 2011;118:2434–41.<br />
25. Bearelly S, Chau F, Koreishi A, et al., Spectral domain optical<br />
coherence tomography imaging of geographic atrophy,<br />
Ophthalmology, 2009;116:1762–9.<br />
26. Lujan BJ, Rosenfeld PJ, Gregori G, et al., Spectral domain<br />
optical coherence tomographic imaging of geographic<br />
atrophy, Ophthalmic Surg Lasers Imaging, 2009;40:96–101.<br />
27. Brar M, Kozak I, Cheng L, et al., Correlation between<br />
spectral-domain optical coherence tomography and fundus<br />
autofluorescence at the margins of geographic atrophy,<br />
Am J Ophthalmol, 2009;148:439–44.<br />
28. Yehoshua Z, Rosenfeld PJ, Gregori G, et al., Progression of<br />
geographic atrophy in age-related macular degeneration<br />
imaged with spectral domain optical coherence tomography,<br />
Ophthalmology, 2011;118:679–86.<br />
All content in this publication is the sole property of Touch Group plc. Touch Group plc cannot guarantee the accuracy, adequacy or completeness of any information contained therein, and cannot be held responsible<br />
for any errors or omissions or for the results obtained from the use thereof Where opinion is expressed it is that of the author(s) and does not necessarily coincide with the editorial views of Touch Group plc<br />
7
Saffron House<br />
6–10 Kirby Street<br />
London<br />
EC1N 8TS<br />
EDITORIAL<br />
Tel: +44 (0) 20 7452 5357<br />
Fax: +44 (0) 20 7452 5050<br />
SALES<br />
Tel: +44 (0) 20 7452 5361<br />
Fax: +44 (0) 20 7452 5606<br />
E-mail: info@touchbriefings.com<br />
www.touchbriefings.com<br />
000000-2007-698