Basic Information Sheet: Perennial Estuarine Wetlands - Cram
Basic Information Sheet: Perennial Estuarine Wetlands - Cram
Basic Information Sheet: Perennial Estuarine Wetlands - Cram

Create successful ePaper yourself
Turn your PDF publications into a flip-book with our unique Google optimized e-Paper software.
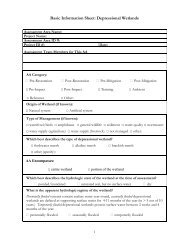
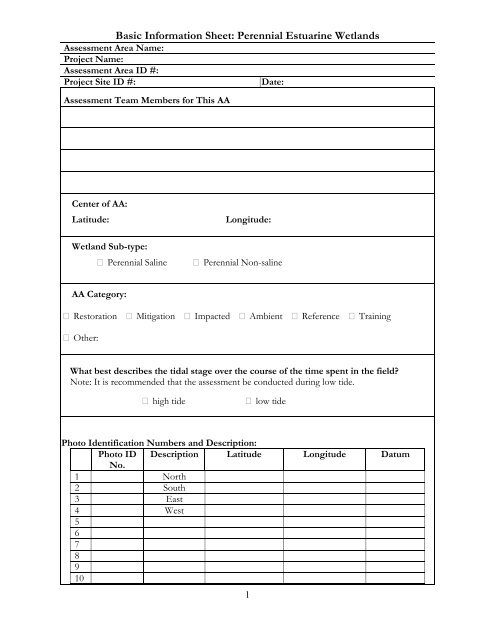
<strong>Basic</strong> <strong>Information</strong> <strong>Sheet</strong>: <strong>Perennial</strong> <strong>Estuarine</strong> <strong>Wetlands</strong><br />
Assessment Area Name:<br />
Project Name:<br />
Assessment Area ID #:<br />
Project Site ID #:<br />
Date:<br />
Assessment Team Members for This AA<br />
Center of AA:<br />
Latitude:<br />
Wetland Sub-type:<br />
<strong>Perennial</strong> Saline<br />
Longitude:<br />
<strong>Perennial</strong> Non-saline<br />
AA Category:<br />
Restoration Mitigation Impacted Ambient Reference Training<br />
Other:<br />
What best describes the tidal stage over the course of the time spent in the field<br />
Note: It is recommended that the assessment be conducted during low tide.<br />
high tide<br />
low tide<br />
Photo Identification Numbers and Description:<br />
Photo ID Description Latitude Longitude Datum<br />
No.<br />
1 North<br />
2 South<br />
3 East<br />
4 West<br />
5<br />
6<br />
7<br />
8<br />
9<br />
10<br />
1
Site Location Description:<br />
Comments:<br />
2
Scoring <strong>Sheet</strong>: <strong>Perennial</strong> <strong>Estuarine</strong> <strong>Wetlands</strong><br />
AA Name:<br />
Attribute 1: Buffer and Landscape Context (pp. 8-14)<br />
Aquatic Area Abundance (D)<br />
Alpha.<br />
Numeric<br />
Date:<br />
Comments<br />
Buffer (based on sub-metrics A-C)<br />
Buffer submetric A:<br />
Percent of AA with Buffer<br />
Buffer submetric B:<br />
Average Buffer Width<br />
Buffer submetric C:<br />
Buffer Condition<br />
Alpha.<br />
Numeric<br />
Final Attribute Score =<br />
Raw Attribute Score = D+[ C x (A x B) ½ ] ½ (Raw Score/24) x 100<br />
Attribute 2: Hydrology Attribute (pp. 15-19)<br />
Water Source<br />
Hydroperiod<br />
Hydrologic Connectivity<br />
Alpha.<br />
Raw Attribute Score = sum of numeric scores<br />
Attribute 3: Physical Structure Attribute (pp. 20-25)<br />
Structural Patch Richness<br />
Topographic Complexity<br />
Alpha.<br />
Raw Attribute Score = sum of numeric scores<br />
Attribute 4: Biotic Structure Attribute (pp. 26-34)<br />
Plant Community Composition (based on sub-metrics A-C)<br />
Plant Community submetric A:<br />
Number of plant layers<br />
Plant Community submetric B:<br />
Number of Co-dominant species<br />
Plant Community submetric C:<br />
Percent Invasion<br />
Plant Community Composition<br />
(numeric average of submetrics A-C)<br />
Horizontal Interspersion<br />
Vertical Biotic Structure<br />
Alpha.<br />
Numeric<br />
Raw Attribute Score = sum of numeric scores<br />
3<br />
Numeric<br />
Numeric<br />
Overall AA Score (average of four final Attribute Scores)<br />
Final Attribute Score =<br />
(Raw Score/36) x 100<br />
Final Attribute Score =<br />
(Raw Score/24) x 100<br />
Final Attribute Score =<br />
(Raw Score/36) x 100
Worksheet for Aquatic Area Abundance Metric for <strong>Estuarine</strong> <strong>Wetlands</strong><br />
Percentage of Transect Lines that Contains<br />
an Aquatic Feature of Any Kind<br />
Segment Direction<br />
North<br />
South<br />
East<br />
West<br />
Average Percentage of Transect Length<br />
that is an Aquatic Feature<br />
Percentage of Transect Length<br />
That is an Aquatic Feature<br />
Percent of AA with Buffer Worksheet.<br />
In the space provided below make a quick sketch of the AA, or perform the assessment directly on the aerial<br />
imagery; indicate where buffer is present, estimate the percentage of the AA perimeter providing buffer functions,<br />
and record the estimate amount in the space provided.<br />
Percent of AA with Buffer: %<br />
Worksheet for calculating average buffer width of AA<br />
Line<br />
A<br />
B<br />
C<br />
D<br />
E<br />
F<br />
G<br />
H<br />
Average Buffer Width<br />
*Round to the nearest integer*<br />
4<br />
Buffer Width (m)
Structural Patch Type Worksheet for <strong>Estuarine</strong> <strong>Wetlands</strong><br />
Circle each type of patch that is observed in the AA and enter the total number of observed patches<br />
in the worksheet below.<br />
STRUCTURAL PATCH TYPE<br />
(circle for presence)<br />
<strong>Estuarine</strong><br />
Minimum Patch Size 3 m 2<br />
Abundant wrackline or organic debris in<br />
channel, on floodplain, or across depressional 1<br />
wetland plain<br />
Animal mounds and burrows 1<br />
Bank slumps or undercut banks in channels or<br />
along shoreline<br />
1<br />
Debris jams 1<br />
Filamentous macroalgae or algal mats 1<br />
Large Woody Debris 1<br />
Non-vegetated flats or bare ground<br />
(sandflats, mudflats, gravel flats, etc.)<br />
1<br />
Pannes or pools on floodplain 1<br />
Plant hummocks and/or sediment mounds 1<br />
Point bars and in-channel bars 1<br />
Pools or depressions in channels<br />
(wet or dry channels )<br />
1<br />
Secondary channels 1<br />
Shellfish beds (living) 1<br />
Soil cracks 1<br />
Standing snags (at least 3 m tall) 1<br />
Submerged vegetation 1<br />
Total Possible 16<br />
No. Observed Patch Types<br />
(enter here and use in Table 14 below)<br />
5
Worksheet for AA Topographic Complexity<br />
At two locations in the AA, make a sketch of the profile from the AA boundary to AA boundary. Try to capture the<br />
major channels, slopes and intervening micro-topographic relief. Based on these sketches and the profiles in Figure<br />
8, choose a description in Table 16 that best describes the overall topographic complexity of the AA.<br />
North to South<br />
East to West<br />
6
Plant Community Metric Worksheet: Co-dominant species richness<br />
(A dominant species represents ≥10% relative cover)<br />
Special Note:<br />
* Combine the counts of co-dominant species from all layers to identify the total species count. Each plant species is only counted once<br />
when calculating the Number of Co-dominant Species and Percent Invasion submetric scores, regardless of the numbers of layers in<br />
which it occurs.<br />
Floating or Canopy-forming Invasive Short (1.5 m)<br />
Invasive<br />
Total number of co-dominant<br />
species for all layers combined<br />
(enter here and use in Table 18)<br />
Percent Invasion<br />
*Round to the nearest whole number<br />
(integer)*<br />
(enter here and use in Table 18)<br />
7
Horizontal Interspersion Complexity Worksheet.<br />
Use the spaces below to make a quick sketch of the AA in plan view, outlining the major plant zones (this should<br />
take no longer than 10 minutes). Assign the zones names and record them on the right. Each zone should comprise<br />
as least 5% of the AA. Based on the sketch, choose a single profile from Figure 10 that best represents the AA<br />
overall.<br />
Assigned zones:<br />
1)<br />
2)<br />
3)<br />
4)<br />
5)<br />
6)<br />
Table 21: Wetland disturbances and conversions.<br />
Has a major disturbance occurred at this<br />
wetland<br />
If yes, was it a flood, fire, landslide, or other flood fire landslide other<br />
If yes, then how severe is the disturbance<br />
Has this wetland been converted from<br />
another type If yes, then what was the<br />
previous type<br />
Yes<br />
No<br />
likely to affect likely to affect likely to affect<br />
site next 5 or site next 3-5 site next 1-2<br />
more years years<br />
years<br />
depressional vernal pool<br />
vernal pool<br />
system<br />
non-confined confined seasonal<br />
riverine riverine estuarine<br />
perennial saline perennial nonsaline<br />
estuarine<br />
estuarine<br />
wet meadow<br />
lacustrine seep or spring playa<br />
8
Stressor Checklist Worksheet<br />
HYDROLOGY ATTRIBUTE<br />
(WITHIN 50 M OF AA)<br />
Point Source (PS) discharges (POTW, other non-stormwater discharge)<br />
Non-point Source (Non-PS) discharges (urban runoff, farm drainage)<br />
Flow diversions or unnatural inflows<br />
Dams (reservoirs, detention basins, recharge basins)<br />
Flow obstructions (culverts, paved stream crossings)<br />
Weir/drop structure, tide gates<br />
Dredged inlet/channel<br />
Engineered channel (riprap, armored channel bank, bed)<br />
Dike/levees<br />
Groundwater extraction<br />
Ditches (borrow, agricultural drainage, mosquito control, etc.)<br />
Actively managed hydrology<br />
Comments<br />
Present<br />
Significant<br />
negative<br />
effect on AA<br />
PHYSICAL STRUCTURE ATTRIBUTE<br />
(WITHIN 50 M OF AA)<br />
Filling or dumping of sediment or soils (N/A for restoration areas)<br />
Grading/ compaction (N/A for restoration areas)<br />
Plowing/Discing (N/A for restoration areas)<br />
Resource extraction (sediment, gravel, oil and/or gas)<br />
Vegetation management<br />
Excessive sediment or organic debris from watershed<br />
Excessive runoff from watershed<br />
Nutrient impaired (PS or Non-PS pollution)<br />
Heavy metal impaired (PS or Non-PS pollution)<br />
Pesticides or trace organics impaired (PS or Non-PS pollution)<br />
Bacteria and pathogens impaired (PS or Non-PS pollution)<br />
Trash or refuse<br />
Comments<br />
Present<br />
Significant<br />
negative<br />
effect on AA<br />
9
BIOTIC STRUCTURE ATTRIBUTE<br />
(WITHIN 50 M OF AA)<br />
Mowing, grazing, excessive herbivory (within AA)<br />
Excessive human visitation<br />
Predation and habitat destruction by non-native vertebrates (e.g.,<br />
Virginia opossum and domestic predators, such as feral pets)<br />
Tree cutting/sapling removal<br />
Removal of woody debris<br />
Treatment of non-native and nuisance plant species<br />
Pesticide application or vector control<br />
Biological resource extraction or stocking (fisheries, aquaculture)<br />
Excessive organic debris in matrix (for vernal pools)<br />
Lack of vegetation management to conserve natural resources<br />
Lack of treatment of invasive plants adjacent to AA or buffer<br />
Comments<br />
Present<br />
Significant<br />
negative<br />
effect on AA<br />
BUFFER AND LANDSCAPE CONTEXT ATTRIBUTE<br />
(WITHIN 500 M OF AA)<br />
Urban residential<br />
Industrial/commercial<br />
Military training/Air traffic<br />
Dams (or other major flow regulation or disruption)<br />
Dryland farming<br />
Intensive row-crop agriculture<br />
Orchards/nurseries<br />
Commercial feedlots<br />
Dairies<br />
Ranching (enclosed livestock grazing or horse paddock or feedlot)<br />
Transportation corridor<br />
Rangeland (livestock rangeland also managed for native vegetation)<br />
Sports fields and urban parklands (golf courses, soccer fields, etc.)<br />
Passive recreation (bird-watching, hiking, etc.)<br />
Active recreation (off-road vehicles, mountain biking, hunting, fishing)<br />
Physical resource extraction (rock, sediment, oil/gas)<br />
Biological resource extraction (aquaculture, commercial fisheries)<br />
Comments<br />
Present<br />
Significant<br />
negative<br />
effect on AA<br />
10