California rapid assessment method C - Cram
California rapid assessment method C - Cram
California rapid assessment method C - Cram

Create successful ePaper yourself
Turn your PDF publications into a flip-book with our unique Google optimized e-Paper software.
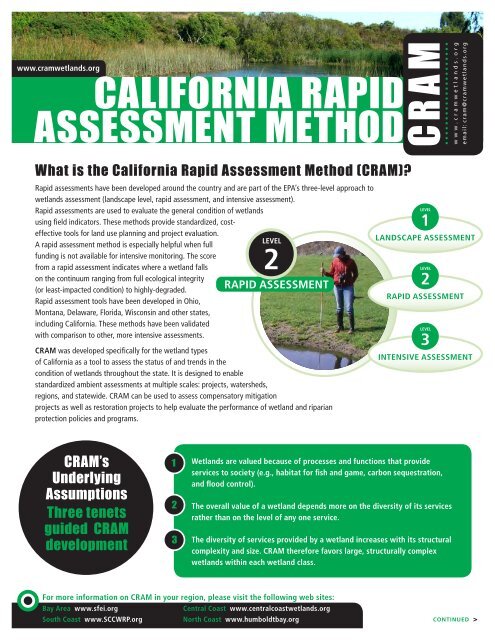
LEVELwww.cramwetlands.org<strong>California</strong> RapidAssessment MethodCRAMwww.cramwetlands.orgemail: cram@cramwetlands.orgWhat is the <strong>California</strong> Rapid Assessment Method (CRAM)?Rapid <strong>assessment</strong>s have been developed around the country and are part of the EPA’s three-level approach towetlands <strong>assessment</strong> (landscape level, <strong>rapid</strong> <strong>assessment</strong>, and intensive <strong>assessment</strong>).Rapid <strong>assessment</strong>s are used to evaluate the general condition of wetlandsusing field indicators. These <strong>method</strong>s provide standardized, costeffectivetools for land use planning and project evaluation.A <strong>rapid</strong> <strong>assessment</strong> <strong>method</strong> is especially helpful when fullfunding is not available for intensive monitoring. The scorefrom a <strong>rapid</strong> <strong>assessment</strong> indicates where a wetland fallson the continuum ranging from full ecological integrity(or least-impacted condition) to highly-degraded.Rapid <strong>assessment</strong> tools have been developed in Ohio,SMENT Montana, Delaware, Florida, Wisconsin and other states,including <strong>California</strong>. These <strong>method</strong>s have been validatedwith comparison to other, more intensive <strong>assessment</strong>s.LEVEL2RAPID ASSESSMENTCRAM was developed specifically for the wetland typesof <strong>California</strong> as a tool to assess the status of and trends in thecondition of wetlands throughout the state. It is designed to enablestandardized ambient <strong>assessment</strong>s at multiple scales: projects, watersheds,regions, and statewide. CRAM can be used to assess compensatory mitigationprojects as well as restoration projects to help evaluate the performance of wetland and riparianprotection policies and programs.LEVEL1LANDSCAPE ASSESSMENTLEVEL2RAPID ASSESSMENTLEVEL3INTENSIVE ASSESSMENTCRAM’sUnderlyingAssumptionsThree tenetsguided CRAMdevelopment123Wetlands are valued because of processes and functions that provideservices to society (e.g., habitat for fish and game, carbon sequestration,and flood control).The overall value of a wetland depends more on the diversity of its servicesrather than on the level of any one service.The diversity of services provided by a wetland increases with its structuralcomplexity and size. CRAM therefore favors large, structurally complexwetlands within each wetland class.For more information on CRAM in your region, please visit the following web sites:Bay Area www.sfei.orgCentral Coast www.centralcoastwetlands.orgSouth Coast www.SCCWRP.orgNorth Coast www.humboldtbay.orgcontinued >
How does CRAM work?A CRAM <strong>assessment</strong> takes a team of two people less than 4 hrs of field time plus one half day ofoffice preparation and data analysis. CRAM can be applied to seven main types of wetlands (riverineand riparian, lacustrine, depressional, estuarine, wet meadows, vernal pools, and playas).CRAM allows real-time data collection with eCRAM, which is a PC-based imagery-delivery anddata-entry system that interfaces with the CRAM website.<strong>California</strong> RapidAssessment MethodCRAMThe maximum CRAM score possible represents the best condition that is likely to be achievedfor the type of wetland being assessed. The overall score for a wetland therefore indicates conditionrelative to the best achievable condition for that wetland type in the state. Local conditionsWetland1 23 4Conditioncan be constrained by the particular Landscape context of a wetland (in the landscape, as a project, etc.), whichshould be considered when comparing ContextHydrologyPhysicalBioticthe CRAM score to an ambient population of wetlands. StructureStructureCRAM assesses wetland condition based on four attributes.Each of the four attributes has associated metrics, which are scored by matching the correct score from a list of descriptive narrative conditionsfor each metric to what is observed in the wetland. Metric scores are then compiled into numerical scores for each attribute and anoverall score for the wetland. These standardized scores can then be used for comparison to other CRAM scores at different scales.WETLANDCONDITION1 23 4NDSCAPEONTEXTDROLOGYRUCTURERUCTUREM SCORELandscape contextdescribes the area around awetland. The land near thewetland and the adjacentlandscape can determinewhether or not a wetland isCARPINTERIA SALT MARSHbuffered from adjacent stressorsand, therefore, is a key attributefor overall wetland condition.Stressors1 2Landscape CRAM provides guidelines for identifying stressors that mightContextHydrologyaccount for low scores. A CRAM <strong>assessment</strong> is accompanied by astressor checklist that allows researchers and managers to explorepossible relationships between CRAM scoresand particular stressors.Stressor Worksheet ChecklistBIOTIC STRUCTURE ATTRIBUTE (WITHIN 50 M OF AA)Present and likelyto have negativeeffect on AAMowing, grazing, excessiveherbivory (within AA)0 20 40 60 80 100Excessive human visitationPERECENT MAXIMUM POSSIBLE SCORETree cutting/sapling removalRemoval of woody debrisWetlandConditionTreatment of non-native andnuisance plant specieswww.cramwetlands.org*1 2LandscapeContextHydrologyis the most important direct determinantof wetland function. Thephysical structure of a wetland islargely determined by the magnitude,duration, and intensity ofwater movement. The hydrologyof a wetland also affects nutrientcycling, sediment entrapment,and pollution filtration.WETLAND CONDITIONLandscapeContextHydrologyHydrologyBioticStructurePhysicalStructureCRAM ScorePhysical structureand the physical complexity of awetland relates to its capacity forsupporting a diverse biologicalcommunity. This attribute looksat the diversity and spatialorganization of physical aspectsof the wetland habitat.3 4PhysicalStructure560 20 40 60 80 100CRAM Score (%)For more information,3please visit the CRAM website4atwww.cramwetlands.orgPhysicalBioticStructure8583808870100698278Biotic Statewide structure Average *of a wetland includes all ofits plants This and Site algae. Theseprimary producers Statewide average support is based*on CRAM calibration data.wetland wildlife higher in thefood web, and also affectwater flow energy and cyclingand water quality.CRAM Score carpenteria salt marshCarpinteria Biotic Salt MarshStructureSTATEWIDE AVERAGE *THIS SITE*Statewide average is basedon CRAM calibration data.Structure