Mars Case Study - BAE Systems GXP Geospatial eXploitation ...
Mars Case Study - BAE Systems GXP Geospatial eXploitation ...
Mars Case Study - BAE Systems GXP Geospatial eXploitation ...

Create successful ePaper yourself
Turn your PDF publications into a flip-book with our unique Google optimized e-Paper software.
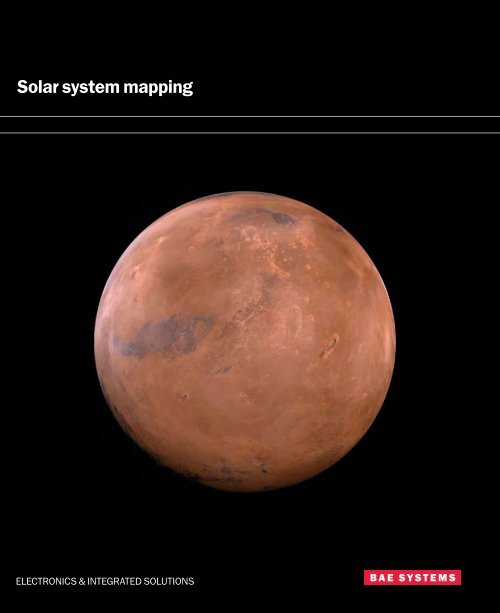
Solar system mapping<br />
ELECTRONICS & INTEGRATED SOLUTIONS
CASE STUDY<br />
Agency employs photogrammetric technology to study and map geologic features<br />
of the solar system<br />
Customer: U.S. Geological Survey (USGS)<br />
Industry: Planetary sciences<br />
Background<br />
The USGS is the primary producer of digital and hardcopy planetary maps in the U.S. Its<br />
Astrogeology team, based in Flagstaff, Arizona, studies the properties and evolution of<br />
planets and their satellites, asteroids, and comets. Using images and samples collected<br />
by spacecraft expeditions, USGS researchers analyze and measure soil, water, terrain,<br />
atmospheric conditions, and other properties that characterize objects in the solar system.<br />
Results of these studies are used to construct topographic, geologic, and thematic<br />
maps, globes, digital elevation models (DEMs), and 3D-flythrough simulations to support<br />
geophysical studies, education, and the planning and operation of subsequent missions.<br />
The opportunity<br />
<strong>Mars</strong> is approximately half the size of Earth. Its surface is dotted with impact craters and<br />
covered with surprisingly Earthlike, but often very large, features such as volcanoes, canyons,<br />
polar caps, and channels. The current atmosphere is thin, cold, and dry, but the channels and<br />
other features hint that water flowed on the surface at one time, and may have temporarily<br />
formed oceans. These features distinguish <strong>Mars</strong> as the solar-system body most similar to<br />
Earth in its surface properties. The continuing investigation of <strong>Mars</strong> may thus fill gaps in our<br />
understanding of planetary conditions under which life can originate and flourish, and the<br />
climatic shifts that can lead to its demise.<br />
The challenge<br />
Since its formation in the early 1960s, the USGS Astrogeology team has amassed large<br />
collections of imagery and supporting data. Synthesizing these data into maps that can be<br />
used by scientists, engineers, and the general public has always been one of its primary —<br />
yet most challenging — roles. Raw legacy images of <strong>Mars</strong>, the moon, and other targets from<br />
early missions retain great value, and have yet to be superseded in resolution for some areas<br />
in some cases.<br />
Perspective views of the Columbia Hills inside<br />
Gusev Crater as seen from the north (top) and<br />
southwest (bottom), based on stereo analysis<br />
of High-Resolution Imaging Science Experiment<br />
(HiRISE) images. The images are false-colored to<br />
approximate the appearance of <strong>Mars</strong> and vertically<br />
exaggerated 1.5x. The <strong>Mars</strong> Exploration Rover<br />
(MER) Spirit climbed over Husband Hill, shown in the<br />
top image, and is currently exploring Home Plate,<br />
which is just visible beyond it. The rover’s panoramic<br />
view from the summit of Husband Hill appears<br />
across the top of this page.<br />
The first space missions relied on photographic film. Digital imaging supplanted photography<br />
in the 1970s, but even as late as the 1980s, most map products were the result of analog<br />
processing, manual measurements, and other human syntheses of image data. Early base<br />
maps consisted of unrectified photomosaics produced by hand. Additional images were used<br />
to interpret missing details, and shaded relief drawings were created by airbrush. Topographic<br />
contours were painstakingly collected from stereo imagery on analog plotters, and maps were<br />
produced at a range of scales from global to local.<br />
In the past decade, pushbroom imagers have largely superseded framing cameras for orbital<br />
reconnaissance. The size of individual images has jumped from the megapixel to gigapixel<br />
level, and the total volume of imagery from moon and <strong>Mars</strong> missions planned for the next<br />
few years is expected to reach hundreds of terabytes. Today, stereo-imaging capabilities are<br />
built into many orbital scanners and most framing camera systems on landers and rovers;<br />
the latter now carry microscopes of ever-increasing power. Hyperspectral imagers provide
compositional information that must be georeferenced, while radar images unveil the cloudshrouded<br />
surfaces of Venus and Saturn’s giant satellite Titan, and may soon reveal whether<br />
useful deposits of water ice are trapped in the permanent shadows near the poles of the moon.<br />
Finally, laser altimetry has become an essential tool in planetary mapping, as dense global<br />
datasets provide the most precise definition of geodetic coordinates to which images and other<br />
data must be tied to make more detailed maps.<br />
The solution<br />
USGS staff are involved in all stages of the planetary exploration and mapping process<br />
— in many cases they help to design, build, and test innovative new camera systems. Once<br />
images and supporting data are safely on Earth, they must be catalogued, processed into<br />
map products, and delivered to the customer. Ultimately, products go to NASA’s Planetary<br />
Data System, where they are archived for future users, but the immediate customer is often a<br />
team running another mission, urgently in need of maps to plan its next day, week, or year of<br />
exploration. Flexibility and efficiency of the mapping software are therefore key concerns.<br />
The USGS has chosen an approach that makes synergistic use of both public domain<br />
software written in-house, as well as commercial photogrammetric software. It uses<br />
<strong>BAE</strong> <strong>Systems</strong>’ SOCET SET®to accomplish its planetary mapping tasks, and its own system,<br />
Integrated Software for Imagers and Spectrometers (ISIS), provides an end-to-end capability<br />
for processing planetary images into orthophoto mosaics for use as base maps. By writing<br />
the software in-house, the USGS maintains the flexibility to read, decompress, calibrate, and<br />
model data geometrically from each new sensor as it becomes available.<br />
ISIS is built to use the special format known as Spacecraft and Planetary ephemeredes,<br />
Instrument C-matrix and Event (SPICE) kernels to store all orientation data for NASA and many<br />
foreign planetary missions. ISIS incorporates the bundle adjustment software that has been<br />
used over the past several decades to define the geodetic control networks of 23 planets and<br />
satellites, and to tie hundreds of thousands of images into these networks. Finally, ISIS offers<br />
cutting-edge tools that researchers can use to analyze the photometric and spectroscopic<br />
content of images. The USGS has developed a production capability for shape-from-shading<br />
(photoclinometry) that can be used to make DEMs from single images (where the surface<br />
reflectivity is uniform), or to refine stereo DEMs by adding detail down to the limit of image<br />
resolution.<br />
For stereo analysis, the USGS turns to commercial software. ISIS programs translate<br />
the images and SPICE orientation data into formats that SOCET SET can recognize. The<br />
production and quality control of stereo DEMs and orthoimages is carried out in SOCET SET’s<br />
general-purpose digital photogrammetric workstation (DPW) environment.<br />
The USGS produced the global topographic<br />
map of <strong>Mars</strong>, above, from nearly 1000<br />
Viking Orbiter images by conventional<br />
analog photogrammetric methods.<br />
A team of analysts labored for most of the<br />
1980s to complete this product, which<br />
has a post spacing of 1 km, though most<br />
of the points are actually interpolated from<br />
widely spaced contours. The topographic<br />
model below, based on a single HiRISE<br />
stereo pair, contains approximately the<br />
same number of height points, spaced 1m<br />
apart. Using SOCET SET®, its production<br />
required 60 hours of automated matching<br />
and 90 hours of interactive quality control<br />
and editing. The model shows debris flows<br />
associated with the central peak of the<br />
Mojave crater. Modern digital processing<br />
methods, including SOCET SET, make it<br />
practical to process gigabytes of image<br />
data for an individual research project.<br />
-2792<br />
Evaluation (m)<br />
-4840<br />
The DPW provides a complete workflow, including:<br />
• Modules for multi-sensor triangulation<br />
• Automatic stereo matching using the automatic terrain extraction (ATE) module to generate DEMs<br />
• Quality control and DEM editing with stereo viewing using the interactive terrain editing (ITE) module<br />
• Tools for map finishing and data analysis that complement those in ISIS<br />
ATE is exceptionally flexible and can be tuned to produce detailed DEMs from images of widely<br />
varying size, quality, and scene content. The ITE module was an equally important factor in<br />
2000 m
the Astrogeology team’s selection of SOCET SET. A final interactive viewing and editing step is<br />
essential to guarantee the quality of DEMs produced automatically. It sometimes is the only<br />
way to make DEMs from image sets that are small in size but large in scientific value, such as<br />
the Huygens probe’s close-up images of Titan’s surface.<br />
Flexible, generic sensor models included with SOCET SET are instrumental in supporting<br />
analysis of the full range of framing cameras and pushbroom scanners flown to the moon and<br />
planets. The USGS continually works closely with <strong>BAE</strong> <strong>Systems</strong> to improve this modeling. The<br />
C++ programming environment of the SOCET SET Developer’s Toolkit (DevKit) has enabled<br />
the USGS to extend these built-in capabilities by writing its own sensor models for unique<br />
instruments, such as the imaging radars flown to Venus and Titan. One of the advantages of<br />
using SOCET SET is that pushbroom scanner data, frame images, and custom-modeled radar<br />
scenes can be mixed freely in the bundle adjustment and DEM-generation steps, providing<br />
opportunities for synergistic use of differing datasets. In addition to modeling unique sensors,<br />
the USGS uses the DevKit to write some of the software used to import data from ISIS into<br />
SOCET SET, and to export DEMs and orthoimages back to ISIS.<br />
Conclusion<br />
Owing to the availability of new software technology such as ISIS and SOCET SET to create a<br />
powerful, systematic framework for processing image data, the USGS has made remarkable<br />
progress in refining solar system map production. Older maps, produced by laborious manual<br />
methods, are superseded as well as complemented by the new, much-more-accurate output<br />
products available from digital cameras such as High-Resolution Stereo Camera (HRSC),<br />
Microscopic Imager, and High-Resolution Imagining Science Experiment (HiRISE) camera in<br />
the powerful ISIS/SOCET SET environment. SOCET SET’s versatility as an end-to-end digital<br />
photogrammetric workflow, with especially strong functionality in the areas of ATE and ITE, is<br />
ideal for generating these deliverables, but the key component is SOCET SET’s DevKit, which<br />
enables programmers to customize the product to work with unique datasets.<br />
Perspective views of Victoria Crater from the<br />
southwest. Top image shows a 0.3 m-per-pixel color<br />
image from HiRISE that has been draped over a<br />
1 m DEM made from a HiRISE stereo pair, with no<br />
vertical exaggeration. Bottom image shows a<br />
close-up view of Duck Bay, where the MER<br />
Opportunity will attempt to enter the crater and<br />
study the sediments exposed in its walls. Slope<br />
measurements based on the HiRISE DEM were<br />
critical to determining the safest point of entry.<br />
The rover itself is barely visible on the far side of<br />
Duck Bay in this image, taken in 2006.<br />
<strong>Mars</strong>, the “Red Planet,” named by the Romans after their<br />
god of war (because of its blood-like color), has always been<br />
a major focus of extraterrestrial exploration because of its<br />
geologic similarity to Earth and its potential for life.<br />
Early planetary geology studies in Flagstaff were led by<br />
Eugene Shoemaker, recognized by many in the field as the<br />
father of planetary geology (as a discipline distinct from<br />
astronomy). Shoemaker founded the branch of Astrogeology<br />
within the USGS in Flagstaff in 1965, where much of the<br />
original use of photogrammetry and remote sensing to<br />
measure and map the solar system took place. After his<br />
death in 1997, a vial of his remains was carried to the Moon<br />
by the Lunar Prospector, making him the first human to be<br />
interred on another world.
Highlights of <strong>Mars</strong> imaging<br />
Highlights from three current <strong>Mars</strong> missions provide an idea of the wide range of data that<br />
the USGS is analyzing with SOCET SET® and ISIS. The first of these spacecraft to reach<br />
<strong>Mars</strong>, in December 2003, was the <strong>Mars</strong> Express orbiter. USGS scientists are part of<br />
the team for the HRSC, the first camera designed explicitly for photogrammetric mapping<br />
to be flown to another planet. The nine-line scanner design of the HRSC allows collection<br />
of multi-angle stereo images, as well as four color bands in a single pass. The ground<br />
sample distance ranges upward from 12.5 m; nearly two-thirds of <strong>Mars</strong> has been imaged at<br />
50 m-per- pixel or better. In a detailed comparison between stereo DEMs produced at several<br />
member institutions, SOCET SET compared well with automatic matching algorithms on<br />
the cutting edge of research, and was the only complete system providing its own bundle<br />
adjustment solution and the possibility of interactive DEM editing. The USGS group was the<br />
first to demonstrate refinement of the stereo DEM with shape-from-shading.<br />
<strong>Mars</strong> Express was followed closely by two NASA <strong>Mars</strong> Exploration Rovers (MER), Spirit and<br />
Opportunity, which landed on opposite sides of <strong>Mars</strong> in January, 2004. Both are still operating,<br />
nearly three years into a mission planned to last only 90 days. Eight cameras arranged as stereo<br />
pairs are used to navigate the rovers to targets of scientific interest, reconstruct their paths, and<br />
map out the spectral properties of geologic features. The primary responsibility of the USGS,<br />
however, is for the ninth camera: a Microscopic Imager (MI) carried on the end of each rover’s<br />
robotic arm. The MI views a 3-cm-square area at 30 micrometers per pixel. Imaging sequences<br />
commonly include motion toward or away from the target (to bring different areas into correct focus),<br />
and motion across the target surface to build up overlapping coverage that can be used to produce<br />
stereo DEMs and image mosaics. Registering the MI images to the much-lower-resolution color<br />
images from the rover’s other cameras, and integrating the close-ups of patches of rock and soil<br />
into the many coordinate systems used to track the rover’s motions across <strong>Mars</strong>, constitute<br />
novel challenges.<br />
The largest spacecraft ever sent to <strong>Mars</strong>, the NASA <strong>Mars</strong> Reconnaissance Orbiter (MRO), arrived<br />
at <strong>Mars</strong> in March, 2006, and entered its mapping orbit in November. From this low orbit, the HiRISE<br />
camera scans the surface at a scale of 0.3 m-per-pixel. The camera uses multiple, overlapping<br />
detectors to build up a pushbroom image 20,000 pixels wide, with three-color bands covering the<br />
central 4000 pixels. Unlike HRSC, the instrument does not have a built-in stereo capability, but<br />
stereo pairs can be acquired by rolling the entire spacecraft to either side to re-image a target on<br />
a later orbit. The HiRISE team plans to take at least 1000 such stereo pairs, totaling roughly two<br />
trillion pixels, and covering perhaps 0.1% of the surface of <strong>Mars</strong>. The USGS is using SOCET SET to<br />
make DEMs from a small fraction of these pairs, focusing on providing the MER team with detailed<br />
maps of their rovers’ locations and validating the safety of candidate landing sites for the next<br />
generation of landers and rovers.<br />
The vast size of the HiRISE images is the primary challenge. Fortunately, the high signal-to-noise<br />
ratio, along with the density of surface features, ensures that automatic matching works well.<br />
The USGS has written software to synthesize the separate channels into the view as seen by an<br />
idealized camera with a single, giant pushbroom array. A final difficulty arises in tying such highresolution<br />
imagery to the laser altimeter ground control. With HiRISE, and even with somewhat<br />
lower-resolution sensors, such as HRSC, it can be difficult to identify and localize features in the<br />
altimetry dataset that can be used as control points. Importing not only the interpolated altimetry<br />
contours, but also the altimeter ground tracks, into SOCET SET is critical to locating well sampled<br />
features that can be used for horizontal, as well as vertical, control.<br />
Color-coded, shaded relief maps of part of the “Martian<br />
Grand Canyon,” Vallis Marineris, show the improvement in<br />
detail that <strong>Mars</strong> Express HRSC images provide. Left: laser<br />
altimetry data are the best global topographic dataset for<br />
<strong>Mars</strong>. Center: HRSC stereo DEM, produced in SOCET SET.<br />
Right: USGS shape-from-shading software adds additional<br />
detail to the stereo DEM. Total relief in the area shown is<br />
approximately 3 km from green to red.<br />
Hematite-rich “blueberries” revealed by the MI onboard the<br />
MER Opportunity. Contour interval 0.25 mm; no vertical<br />
exaggeration.<br />
60<br />
45<br />
30<br />
15<br />
0<br />
Slope (°)<br />
This impact crater in the Centauri Montes region has<br />
achieved celebrity because before/after images indicate<br />
that a bright streak of material flowed down the crater wall<br />
within the past few years. Topography and slopes (shown<br />
here in color, superimposed over the HiRISE image) are<br />
being used by scientists to model the formation of the<br />
streak and assess whether it was merely a dry debris flow or<br />
involved the release of ground water.<br />
Images courtesy of the USGS.<br />
bright streak<br />
10 mm<br />
1000m<br />
For more images and information, visit: http://astrogeology.usgs.gov/<br />
© 2007 <strong>BAE</strong> <strong>Systems</strong>. All trademarks used are the property of their<br />
respective owners.<br />
MARS 10/07
Anaglyph of Victoria Crater<br />
Use the 3D glasses provided to view the image in stereo