Annual Report & Accounts 2007 - Euromoney Institutional Investor ...
Annual Report & Accounts 2007 - Euromoney Institutional Investor ...
Annual Report & Accounts 2007 - Euromoney Institutional Investor ...

Create successful ePaper yourself
Turn your PDF publications into a flip-book with our unique Google optimized e-Paper software.
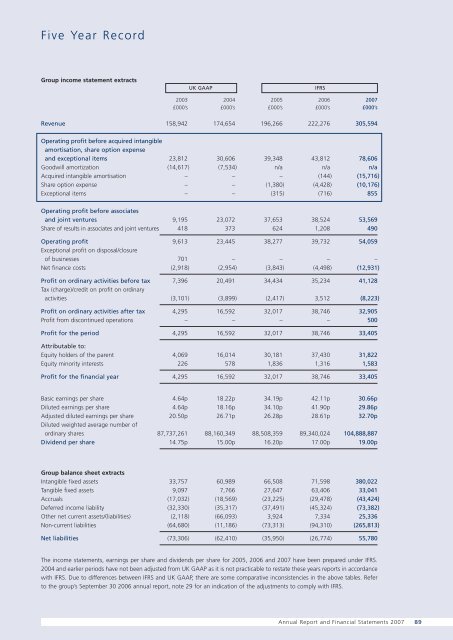
Five Year Record<br />
Group income statement extracts<br />
UK GAAP<br />
IFRS<br />
2003 2004 2005 2006 <strong>2007</strong><br />
£000’s £000’s £000’s £000’s £000’s<br />
Revenue 158,942 174,654 196,266 222,276 305,594<br />
Operating profit before acquired intangible<br />
amortisation, share option expense<br />
and exceptional items 23,812 30,606 39,348 43,812 78,606<br />
Goodwill amortization (14,617) (7,534) n/a n/a n/a<br />
Acquired intangible amortisation – – – (144) (15,716)<br />
Share option expense – – (1,380) (4,428) (10,176)<br />
Exceptional items – – (315) (716) 855<br />
Operating profit before associates<br />
and joint ventures 9,195 23,072 37,653 38,524 53,569<br />
Share of results in associates and joint ventures 418 373 624 1,208 490<br />
Operating profit 9,613 23,445 38,277 39,732 54,059<br />
Exceptional profit on disposal/closure<br />
of businesses 701 – – – –<br />
Net finance costs (2,918) (2,954) (3,843) (4,498) (12,931)<br />
Profit on ordinary activities before tax 7,396 20,491 34,434 35,234 41,128<br />
Tax (charge)/credit on profit on ordinary<br />
activities (3,101) (3,899) (2,417) 3,512 (8,223)<br />
Profit on ordinary activities after tax 4,295 16,592 32,017 38,746 32,905<br />
Profit from discontinued operations – – – – 500<br />
Profit for the period 4,295 16,592 32,017 38,746 33,405<br />
Attributable to:<br />
Equity holders of the parent 4,069 16,014 30,181 37,430 31,822<br />
Equity minority interests 226 578 1,836 1,316 1,583<br />
Profit for the financial year 4,295 16,592 32,017 38,746 33,405<br />
Basic earnings per share 4.64p 18.22p 34.19p 42.11p 30.66p<br />
Diluted earnings per share 4.64p 18.16p 34.10p 41.90p 29.86p<br />
Adjusted diluted earnings per share 20.50p 26.71p 26.28p 28.61p 32.70p<br />
Diluted weighted average number of<br />
ordinary shares 87,737,261 88,160,349 88,508,359 89,340,024 104,888,887<br />
Dividend per share 14.75p 15.00p 16.20p 17.00p 19.00p<br />
Group balance sheet extracts<br />
Intangible fixed assets 33,757 60,989 66,508 71,598 380,022<br />
Tangible fixed assets 9,097 7,766 27,647 63,406 33,041<br />
Accruals (17,032) (18,569) (23,225) (29,478) (43,424)<br />
Deferred income liability (32,330) (35,317) (37,491) (45,324) (73,382)<br />
Other net current assets/(liabilities) (2,118) (66,093) 3,924 7,334 25,336<br />
Non-current liabilities (64,680) (11,186) (73,313) (94,310) (265,813)<br />
Net liabilities (73,306) (62,410) (35,950) (26,774) 55,780<br />
The income statements, earnings per share and dividends per share for 2005, 2006 and <strong>2007</strong> have been prepared under IFRS.<br />
2004 and earlier periods have not been adjusted from UK GAAP as it is not practicable to restate these years reports in accordance<br />
with IFRS. Due to differences between IFRS and UK GAAP, there are some comparative inconsistencies in the above tables. Refer<br />
to the group’s September 30 2006 annual report, note 29 for an indication of the adjustments to comply with IFRS.<br />
<strong>Annual</strong> <strong>Report</strong> and Financial Statements <strong>2007</strong> 89