Book 5:Lee County Storm Tide Atlas - Southwest Florida Regional ...
Book 5:Lee County Storm Tide Atlas - Southwest Florida Regional ...
Book 5:Lee County Storm Tide Atlas - Southwest Florida Regional ...

Create successful ePaper yourself
Turn your PDF publications into a flip-book with our unique Google optimized e-Paper software.
Volume VII-9 <strong>Southwest</strong> <strong>Florida</strong><br />
Statewide <strong>Regional</strong> Evacuation Studies Program<br />
impacts. Finally, the NWS is exploring the possibility of issuing explicit <strong>Storm</strong> Surge Warnings which<br />
could be implemented in the next couple of years. In all of these efforts, the NWS is working to<br />
provide specific and quantitative information to support decision-making at the local level 1 . NOAA<br />
continues to emphasize that the hurricane forecasts are not 100% accurate and dependent upon<br />
many factors.<br />
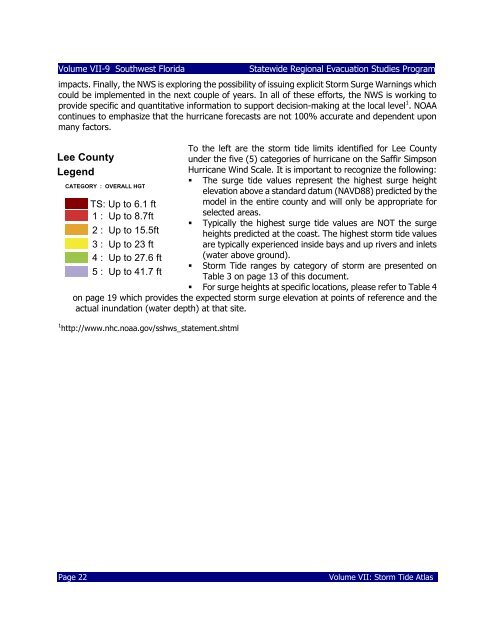
<strong>Lee</strong> <strong>County</strong><br />
Legend<br />
CATEGORY : OVERALL HGT<br />
TS: Up to 6.1 ft<br />
1 : Up to 8.7ft<br />
2 : Up to 15.5ft<br />
3 : Up to 23 ft<br />
4 : Up to 27.6 ft<br />
5 : Up to 41.7 ft<br />
To the left are the storm tide limits identified for <strong>Lee</strong> <strong>County</strong><br />
under the five (5) categories of hurricane on the Saffir Simpson<br />
Hurricane Wind Scale. It is important to recognize the following:<br />
• The surge tide values represent the highest surge height<br />
elevation above a standard datum (NAVD88) predicted by the<br />
model in the entire county and will only be appropriate for<br />
selected areas.<br />
• Typically the highest surge tide values are NOT the surge<br />
heights predicted at the coast. The highest storm tide values<br />
are typically experienced inside bays and up rivers and inlets<br />
(water above ground).<br />
• <strong>Storm</strong> <strong>Tide</strong> ranges by category of storm are presented on<br />
Table 3 on page 13 of this document.<br />
• For surge heights at specific locations, please refer to Table 4<br />
on page 19 which provides the expected storm surge elevation at points of reference and the<br />
actual inundation (water depth) at that site.<br />
1 http://www.nhc.noaa.gov/sshws_statement.shtml<br />
Page 22<br />
Volume VII: <strong>Storm</strong> <strong>Tide</strong> <strong>Atlas</strong>