Track Record - Public Transport Victoria
Track Record - Public Transport Victoria
Track Record - Public Transport Victoria
You also want an ePaper? Increase the reach of your titles
YUMPU automatically turns print PDFs into web optimized ePapers that Google loves.
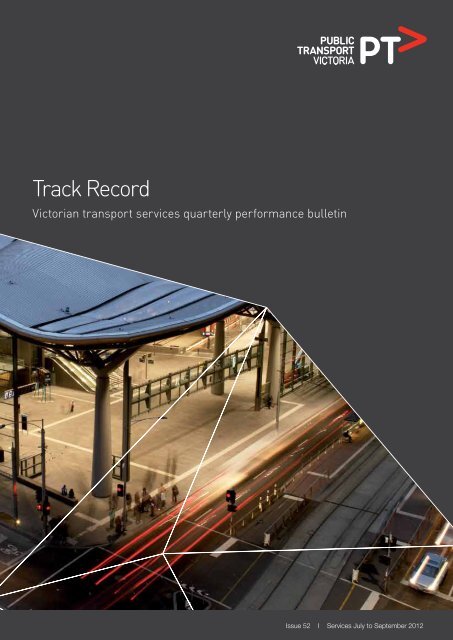
<strong>Track</strong> <strong>Record</strong><br />
<strong>Victoria</strong>n transport services quarterly performance bulletin<br />
Issue 52 I Services July to September 2012
2 <strong>Track</strong> <strong>Record</strong> Quarterly services bulletin<br />
Contents<br />
Introduction 3<br />
Punctuality and reliability 4<br />
Punctuality 4<br />
Reliability 5<br />
Customer compensation 6<br />
Payments 6<br />
Customer satisfaction 9<br />
Metropolitan modes 9<br />
Metropolitan trains 11<br />
Metropolitan trams 11<br />
Metropolitan buses 12<br />
V/Line modes 12<br />
Patronage 14<br />
Metropolitan trains, trams and buses 14<br />
Regional train, coach and bus 16<br />
Ticketing equipment 18
<strong>Track</strong> <strong>Record</strong> Quarterly services bulletin 3<br />
Introduction<br />
<strong>Track</strong> <strong>Record</strong> Quarterly provides a regular update on the performance of <strong>Victoria</strong>’s public transport<br />
network.<br />
<strong>Public</strong> <strong>Transport</strong> <strong>Victoria</strong> (PTV) administers <strong>Victoria</strong>’s train, tram and bus services. It provides a single<br />
contact point for customers wanting information on public transport timetables, services, tickets and<br />
improvement projects.<br />
PTV was established in April 2012 to improve public transport in <strong>Victoria</strong>.<br />
Some of the basics are already being addressed. Improved maintenance and renewal of the network,<br />
better management of rolling stock, simplified timetables and better coordination between modes are<br />
all providing better outcomes for customers.<br />
During the quarter, the network reported a range of improvements in some areas.<br />
Metropolitan train on-time performance was better than ever with more than 90 per cent of trains<br />
running consistently on-time each month since April.<br />
Quarterly on-time performance also improved for all other modes, although slightly down on the same<br />
quarter last year. Service delivery remained steady across the network.<br />
Overall performance of Metro Trains and Yarra Trams improved with both operators receiving an<br />
incentive payment ($3,244,000 and $224,000 respectively). V/Line paid a penalty of $1,323,000<br />
for under-performance.<br />
Customer satisfaction with the metropolitan public transport network was significantly higher than both<br />
last quarter and the same time last year. The most notable improvement in customer satisfaction was<br />
related to train and the ‘running of services’ and ‘personal security’.<br />
PTV’s patronage surveys show that more people than ever are using public transport. Patronage<br />
increased by 3.4 per cent during 2011 – 2012 with an extra 19 million trips made by passengers.
4 <strong>Track</strong> <strong>Record</strong> Quarterly services bulletin<br />
Punctuality and reliability<br />
Punctuality<br />
Metro’s performance continued to improve during the quarter. More than 90 per cent of trains have<br />
consistently run on-time each month since April 2012.<br />
Tram, bus and V/Line on-time performance also improved compared to last quarter:<br />
> > metropolitan trains and trams are considered punctual if they arrive no more than 59 seconds<br />
before or four minutes and 59 seconds after the scheduled time in the timetable<br />
> > metropolitan buses are considered on-time if they arrive no more than 59 seconds early or five<br />
minutes and 59 seconds late<br />
> > long distance regional trains are considered on-time if they arrive no more than 10 minutes<br />
and 59 seconds late at their destination<br />
> > short distance regional trains are considered on-time if they arrive no more than five minutes<br />
and 59 seconds late.<br />
Table 1<br />
Train, tram and bus punctuality – percentage of services on-time<br />
Jul – Sep<br />
2011<br />
Oct – Dec<br />
2011<br />
Jan – Mar<br />
2012<br />
Apr – Jun<br />
2012<br />
Jul – Sep<br />
2012<br />
Metropolitan trains 90.3% 89.5% 88.4% 91.3% 92.6%<br />
Metropolitan trams – average over route 82.6% 81.2% 81.3% 81.7% 82.3%<br />
Metropolitan trams – at destination 73.0% 70.9% 70.9% 71.4% 72.4%<br />
V/Line trains 88.4% 87.4% 84.9% 84.4% 85.6%<br />
Metropolitan buses 94.3% 94.0% 94.5% 93.9% 94.6%<br />
Figure 1<br />
Train, tram and bus punctuality – percentage of services on-time<br />
100<br />
90<br />
80<br />
70<br />
60<br />
Jul – Sep 2011 Oct – Dec 2011 Jan – Mar 2012 Apr – Jun 2012 Jul – Sep 2012<br />
Metropolitan trains<br />
V/Line trains<br />
Metropolitan trams – average over route<br />
Metropolitan buses<br />
Metropolitan trams – at destination
<strong>Track</strong> <strong>Record</strong> Quarterly services bulletin 5<br />
Reliability<br />
The percentage of the timetable delivered across the network remained stable this quarter:<br />
> > metropolitan train reliability is measured as the percentage of the timetable that is delivered.<br />
Non-delivery of services includes cancellations, trains that run short and trains that bypass<br />
the City or Westona loops<br />
> > metropolitan tram reliability is based on the percentage of the timetable delivered. Non delivery<br />
of services includes cancellations and trams that run short<br />
> > metropolitan bus reliability is the percentage of services that operate and are completed<br />
> > regional train reliability is measured as the percentage of scheduled services that are delivered.<br />
Table 2<br />
Train, tram and bus reliability – percentage of timetable delivered<br />
Jul – Sep<br />
2011<br />
Oct – Dec<br />
2011<br />
Jan – Mar<br />
2012<br />
Apr – Jun<br />
2012<br />
Jul – Sep<br />
2012<br />
Metropolitan trains 98.8% 98.4% 98.4% 98.5% 98.5%<br />
Metropolitan trams 99.3% 99.1% 99.0% 99.1% 99.2%<br />
V/Line trains 98.5% 97.6% 97.7% 97.6% 97.2%<br />
Metropolitan buses >99.9% >99.9% >99.9% >99.9% >99.9%<br />
Figure 2<br />
Train, tram and bus reliability – percentage of timetable delivered<br />
100.0<br />
99.5<br />
99.0<br />
98.5<br />
98.0<br />
97.5<br />
97.0<br />
Jul – Sep 2011 Oct – Dec 2011 Jan – Mar 2012 Apr – Jun 2012 Jul – Sep 2012<br />
Metropolitan trains<br />
V/Line trains<br />
Metropolitan trams – average over route<br />
Metropolitan buses
6 <strong>Track</strong> <strong>Record</strong> Quarterly services bulletin<br />
Customer compensation<br />
Train and tram operators are expected to deliver a punctual and reliable service for customers.<br />
<strong>Public</strong> <strong>Transport</strong> <strong>Victoria</strong> insists that operators do everything they can to deliver services in line with<br />
the agreed timetable. Where operators fall short, they are required to pay compensation to customers,<br />
in the form of complimentary travel. Only customers who travel with a periodical ticket of four weeks or<br />
more are eligible to receive compensation.<br />
Table 3 Service level thresholds for compensation (%)<br />
Metropolitan trains Metropolitan trams V/Line<br />
Punctuality arrival by 4 minutes, 59 seconds 88% 77% –<br />
arrival by 5 minutes, 59 seconds – – 92%*<br />
Reliability % of timetable delivered 88% 98% –<br />
% of services delivered – – 96%<br />
* For long distance V/Line services, on-time arrival is defined as arriving no later than 10 minutes and 59 seconds after the<br />
timetabled arrival time.<br />
Metropolitan trains and trams<br />
> > No passenger compensation was paid out during the quarter<br />
V/Line<br />
> > July – Customer compensation was payable for punctuality on all corridors except Ararat /<br />
Maryborough and Seymour. Compensation was payable for reliability on the Albury corridor;<br />
> > August – Customer compensation was payable for punctuality on the Albury, Bairnsdale, Bendigo,<br />
Geelong, Gippsland and Swan Hill / Echuca corridors. Compensation was payable for reliability<br />
on the Gippsland corridor;<br />
> > September – Customer compensation was payable for punctuality on all corridors except Ararat /<br />
Maryborough, Ballarat and Seymour. Compensation was payable for reliability on the Albury<br />
and Bendigo corridors.<br />
Payments<br />
Metro Trains and Yarra Trams receive regular payments from <strong>Public</strong> <strong>Transport</strong> <strong>Victoria</strong> to cover the<br />
delivery of services and the operation and development of the networks. The terms of these payments<br />
are outlined in operator franchise agreements.<br />
PTV requires that operators meet agreed performance targets. Penalties or incentives are paid<br />
depending on how operators perform against these targets.<br />
Incentive payments are based on a detailed measure of the passenger impact of service disruptions.<br />
These include delays, cancellations, short services and a number of other disruption types (including<br />
trains that bypass the City and / or Westona loops).<br />
Each disruption is multiplied by an agreed ‘passenger weight’ for that service which depends on<br />
the route, the time of day, and the direction of the service. Longer delays result in higher penalties.<br />
Operators can receive bonus payments or incur penalties depending on whether the level of disruption<br />
is above or below agreed levels in the contracts.
<strong>Track</strong> <strong>Record</strong> Quarterly services bulletin 7<br />
Table 4<br />
Metropolitan train payments ($‘000s)<br />
Jul – Sep<br />
2011<br />
Oct – Dec<br />
2011<br />
Jan – Mar<br />
2012<br />
Apr – Jun<br />
2012<br />
Jul – Sep<br />
2012<br />
Base contract 36,703 35,714 35,916 40,298 33,913<br />
Incentive / penalty 2750 533 –2706 –472 3244<br />
Customer Experience<br />
Performance Regime<br />
309 – – 213<br />
Ticketing revenue guarantee payment 72,561 72,561 77,594 79,318 77,636<br />
Maintenance & projects 1 76,462 68,230 45,464 65,842 67,572<br />
Rolling stock 2 30,661 25,412 32,402 36,226 29,864<br />
Operations & systems 3 16,891 9801 12,789 13,856 17,838<br />
Total 236,337 212,526 201,460 235,460 230,067<br />
Table 5<br />
Metropolitan tram payments ($‘000s)<br />
Jul – Sep<br />
2011<br />
Oct – Dec<br />
2011<br />
Jan – Mar<br />
2012<br />
Apr – Jun<br />
2012<br />
Jul – Sep<br />
2012<br />
Base contract 7173 7892 8177 7601 2504<br />
Incentive / penalty 1072 –164 –323 139 224<br />
Customer Experience<br />
Performance Regime<br />
361 – – 373<br />
Ticketing revenue guarantee payment 55,822 55,822 52,912 54,088 60,935<br />
Maintenance & projects 1 18,304 25,927 6745 16,226 15,094<br />
Rolling stock 8767 8767 8767 8767 8767<br />
Operations & systems 4 2629 4040 2467 2902 3154<br />
Total 94,128 102,284 78,745 90,062 90,678<br />
1<br />
Maintenance & projects combines the capital projects and maintenance payments<br />
2<br />
Metropolitan train rolling stock payments include rolling stock adjustments and exams<br />
3<br />
Metropolitan <br />
train Operations & systems payments include business systems upgrades, driver establishment payments,<br />
electricity and employee entitlements payments.<br />
4<br />
Metropolitan <br />
tram Operations & systems payments include business systems upgrades, electricity and employee entitlements<br />
payments.
8 <strong>Track</strong> <strong>Record</strong> Quarterly services bulletin<br />
V/Line<br />
Regional train and coach payments are made to the V/Line Corporation which is a<br />
State-owned enterprise.<br />
As with other private operators, PTV requires that V/Line also meet agreed performance targets. If<br />
passenger disruption is lower than the agreed targets, incentive payments are paid by PTV to the<br />
operator. If passenger disruption is higher, operators must pay the penalty.<br />
Table 6<br />
Regional train and coach payments ($‘000s)<br />
Jul – Sep<br />
2011<br />
Oct – Dec<br />
2011<br />
Jan – Mar<br />
2012<br />
Apr – Jun<br />
2012<br />
Jul – Sep<br />
2012<br />
Base contract 71,582 73,732 71,806 70,987 76,232<br />
Incentive / penalty –331 –600 –766 –771 –1323<br />
Farebox 20,377 19,046 23,613 22,671 21,964<br />
Infrastructure 211 18 – – –<br />
Rolling stock 8953 8953 8953 8953 8953<br />
Total 100,792 101,149 103,606 101,840 105,826<br />
Buses<br />
PTV has individual contracts with bus operators to run services in Melbourne and regional areas.<br />
Payments are made to these operators to help deliver route and school bus services.<br />
Table 7<br />
Metropolitan, regional and school bus payments ($‘000s)<br />
Jul – Sep 2011 Oct – Dec 2011 Jan – Mar 2012 Apr – Jun 2012 Jul – Sep 2012<br />
Metropolitan 139,734 136,945 137,594 138,960 140,452<br />
Regional 30,730 30,337 31,582 32,074 32,368<br />
School 50,755 51,179 34,647 51,982 53,247<br />
Total 221,219 218,461 203,823 223,016 226,067
<strong>Track</strong> <strong>Record</strong> Quarterly services bulletin 9<br />
Customer satisfaction<br />
Satisfaction with the metropolitan public transport network (63.6) was significantly higher than both last<br />
quarter (61.4) and the same quarter last year (61.9).<br />
There was a significant increase in customer satisfaction with metropolitan trains during the quarter.<br />
The operator scored 68.0, the highest train satisfaction result since April 2009.<br />
The most notable improvements were a 3.2 point increase in satisfaction with ‘running of services’ and<br />
a 3.6 point increase in satisfaction with ‘personal security’.<br />
Improved service delivery during the quarter, along with the well-publicised rollout of Protective Service<br />
Officers has driven the improvement in overall satisfaction with metropolitan trains.<br />
Satisfaction with metropolitan trams (73.1) and metropolitan buses (75.4) were both slightly higher than<br />
the previous quarter.<br />
Satisfaction with V/Line trains increased from 74.6 last quarter to 76.7, and satisfaction with V/Line<br />
coaches remained steady at 81.0.<br />
Customer satisfaction ratings<br />
Most results for customer satisfaction in the past two reports differ to those published in previous<br />
<strong>Track</strong> <strong>Record</strong> bulletins. All results have now been transferred to the 0 – 10 scale which has been<br />
used since April 2009. Results were previously reported in a six-point scale.<br />
Metropolitan modes<br />
September quarter 2012<br />
Table 6 Metropolitan public transport modes overall satisfaction, September quarter 2010<br />
to September quarter 2012<br />
Jul – Sep<br />
2010<br />
Oct – Dec<br />
2010<br />
Jan – Mar<br />
2011<br />
Apr – Jun<br />
2011<br />
Jul – Sep<br />
2011<br />
Oct – Dec<br />
2011<br />
Jan – Mar<br />
2012<br />
Apr – Jun<br />
2012<br />
Jul – Sep<br />
2012<br />
Metropolitan overall* 59.5 60.7 60.9 59.0 61.9 62.7 63.0 61.4 63.6<br />
* Note: these results are still presented in the six-point scale.<br />
Figure 3 Metropolitan public transport modes overall satisfaction, September quarter 2010<br />
to September quarter 2012<br />
80<br />
VERY<br />
SATISFIED<br />
75<br />
70<br />
65<br />
SOMEWHAT<br />
SATISFIED<br />
60<br />
55<br />
50<br />
Jul – Sep<br />
2010<br />
Oct – Dec<br />
2010<br />
Jan – Mar<br />
2011<br />
Apr – Jun<br />
2011<br />
Jul – Sep<br />
2011<br />
Oct – Dec<br />
2011<br />
Jan – Mar<br />
2012<br />
Apr – Jun<br />
2012<br />
Jul – Sep<br />
2012<br />
Significant change from previous quarter
10 <strong>Track</strong> <strong>Record</strong> Quarterly services bulletin<br />
Table 9 Metropolitan trains, trams and buses individual overall satisfaction, September quarter 2010<br />
to September quarter 2012<br />
Jul – Sep<br />
2010<br />
Oct – Dec<br />
2010<br />
Jan – Mar<br />
2011<br />
Apr – Jun<br />
2011<br />
Jul – Sep<br />
2011<br />
Oct – Dec<br />
2011<br />
Jan – Mar<br />
2012<br />
Apr – Jun<br />
2012<br />
Jul – Sep<br />
2012<br />
Metropolitan<br />
trains<br />
Metropolitan<br />
trams<br />
Metropolitan<br />
buses<br />
62.9 65.7 64.6 63.5 66.0 67.7 67.8 65.7 68.0<br />
71.1 71.8 71.4 72.1 72.1 73.6 73.0 72.4 73.1<br />
74.5 74.4 74.5 73.3 75.7 75.4 75.4 74.7 75.4<br />
Figure 4 Metropolitan trains, trams and buses individual overall satisfaction, September quarter 2010<br />
to September quarter 2012<br />
VERY<br />
SATISFIED<br />
80<br />
75<br />
70<br />
65<br />
SOMEWHAT<br />
SATISFIED<br />
60<br />
55<br />
50<br />
Jul – Sep<br />
2010<br />
Oct – Dec<br />
2010<br />
Jan – Mar<br />
2011<br />
Apr – Jun<br />
2011<br />
Jul – Sep<br />
2011<br />
Oct – Dec<br />
2011<br />
Jan – Mar<br />
2012<br />
Apr – Jun<br />
2012<br />
Jul – Sep<br />
2012<br />
Metropolitan trains<br />
Metropolitan trams<br />
Metropolitan buses
<strong>Track</strong> <strong>Record</strong> Quarterly services bulletin 11<br />
Metropolitan trains<br />
Figure 5 Satisfaction with key service aspects for metropolitan trains, September quarter 2012<br />
SERVICE ASPECTS ARE<br />
RANKED HIGHEST TO LOWEST<br />
BY SATISFACTION INDEX<br />
SIGNIFICANT<br />
CHANGE FROM<br />
PREVIOUS<br />
QUARTER<br />
Overall satisfaction<br />
68.0<br />
Metcard ticketing<br />
Train staff<br />
80.1<br />
79.2<br />
Information<br />
Running of services<br />
Personal security<br />
Passenger travel experience<br />
Train stations<br />
myki ticketing<br />
Price<br />
69.8<br />
69.0<br />
67.2<br />
66.8<br />
66.6<br />
63.2<br />
63.2<br />
0<br />
10 20 30 40 50 60 70 80 90 100<br />
Metropolitan trams<br />
Figure 6 Satisfaction with key service aspects for metropolitan trams, September quarter 2012<br />
SERVICE ASPECTS ARE<br />
RANKED HIGHEST TO LOWEST<br />
BY SATISFACTION INDEX<br />
SIGNIFICANT<br />
CHANGE FROM<br />
PREVIOUS<br />
QUARTER<br />
Overall satisfaction<br />
Tram staff<br />
Metcard ticketing<br />
Personal security<br />
Tram stops<br />
Running of services<br />
Information<br />
Passenger travel experience<br />
Price<br />
myki ticketing<br />
73.1<br />
74.7<br />
74.0<br />
73.4<br />
72.6<br />
72.5<br />
70.0<br />
68.6<br />
63.0<br />
61.3<br />
0<br />
10 20 30 40 50 60 70 80 90 100
12 <strong>Track</strong> <strong>Record</strong> Quarterly services bulletin<br />
Metropolitan buses<br />
Figure 7 Satisfaction with key service aspects for metropolitan buses, September quarter 2012<br />
SERVICE ASPECTS ARE<br />
RANKED HIGHEST TO LOWEST<br />
BY SATISFACTION INDEX<br />
SIGNIFICANT<br />
CHANGE FROM<br />
PREVIOUS<br />
QUARTER<br />
Overall satisfaction<br />
Bus staff<br />
Metcard ticketing<br />
Passenger travel experience<br />
Personal security<br />
Running of services<br />
Bus stops<br />
Information<br />
Price<br />
myki ticketing<br />
75.4<br />
79.9<br />
79.5<br />
78.3<br />
77.3<br />
72.7<br />
72.0<br />
71.1<br />
67.9<br />
64.2<br />
0<br />
10 20 30 40 50 60 70 80 90 100<br />
V/Line modes<br />
Table 10 V/Line trains and coaches individual overall satisfaction, September quarter 2010<br />
to September quarter 2012<br />
Jul – Sep<br />
2010<br />
Oct – Dec<br />
2010<br />
Jan – Mar<br />
2011<br />
Apr – Jun<br />
2011<br />
Jul – Sep<br />
2011<br />
Oct – Dec<br />
2011<br />
Jan – Mar<br />
2012<br />
Apr – Jun<br />
2012<br />
Jul – Sep<br />
2012<br />
V/Line trains 76.3 77.4 77.3 77.0 76.5 77.1 77.3 74.6 76.7<br />
V/Line coaches 81.3 81.5 82.9 85.3 80.7 84.1 81.3 80.3 81.0<br />
Figure 8 V/Line trains and coaches individual overall satisfaction, September quarter 2010<br />
to September quarter 2012<br />
90<br />
85<br />
VERY<br />
SATISFIED<br />
80<br />
75<br />
70<br />
65<br />
SOMEWHAT<br />
SATISFIED<br />
60<br />
Jul – Sep<br />
2010<br />
Oct – Dec<br />
2010<br />
Jan – Mar<br />
2011<br />
Apr – Jun<br />
2011<br />
Jul – Sep<br />
2011<br />
Oct – Dec<br />
2011<br />
Jan – Mar<br />
2012<br />
Apr – Jun<br />
2012<br />
Jul – Sep<br />
2012<br />
V/Line trains<br />
V/Line coaches
<strong>Track</strong> <strong>Record</strong> Quarterly services bulletin 13<br />
V/Line trains<br />
Figure 9 Satisfaction with key service aspects for V/Line trains, September quarter 2012<br />
SERVICE ASPECTS ARE<br />
RANKED HIGHEST TO LOWEST<br />
BY SATISFACTION INDEX<br />
SIGNIFICANT<br />
CHANGE FROM<br />
PREVIOUS<br />
QUARTER<br />
Overall satisfaction<br />
76.7<br />
V/Line staff<br />
V/Line ticketing<br />
Price<br />
Personal security<br />
V/Line train stations<br />
Information<br />
Passenger travel experience<br />
Running of services<br />
85.0<br />
80.3<br />
79.7<br />
77.6<br />
77.1<br />
75.9<br />
74.9<br />
74.8<br />
0<br />
10 20 30 40 50 60 70 80 90 100<br />
V/Line coaches<br />
Figure 10 Satisfaction with key service aspects for V/Line coaches, September quarter 2012<br />
SERVICE ASPECTS ARE<br />
RANKED HIGHEST TO LOWEST<br />
BY SATISFACTION INDEX<br />
SIGNIFICANT<br />
CHANGE FROM<br />
PREVIOUS<br />
QUARTER<br />
Overall satisfaction<br />
V/Line staff<br />
Personal security<br />
Passenger travel experience<br />
Information<br />
Price<br />
Running of services<br />
V/Line coach stops<br />
V/Line ticketing<br />
81.0<br />
86.7<br />
83.7<br />
79.3<br />
78.7<br />
77.9<br />
76.8<br />
76.3<br />
74.2<br />
0<br />
10 20 30 40 50 60 70 80 90 100<br />
Note: The Customer Satisfaction Monitor for <strong>Victoria</strong>n taxis is now managed by the <strong>Victoria</strong>n Taxi<br />
Directorate. Please see www.taxi.vic.gov.au for more details.
14 <strong>Track</strong> <strong>Record</strong> Quarterly services bulletin<br />
Patronage<br />
Metropolitan trains, trams and buses<br />
Patronage on Melbourne’s public transport network increased by 3.4 per cent during 2011 – 2012,<br />
with an extra 19 million trips made by passengers.<br />
Some 537 million public transport trips were made in Melbourne in the past year, including 222 million<br />
trips on trains, nearly 192 million on trams and 123 million on buses.<br />
Tram had its second biggest year since the 1950s and is now carrying almost 192 million passenger<br />
trips a year, with patronage growing 4.5 per cent in the past year and by 23.7 per cent over the past<br />
five years.<br />
The most significant growth continued to be on the bus network, with use of buses growing by 56 per<br />
cent over the past six years, including a massive 16 per cent jump in patronage in the past year.<br />
After a long period of sustained growth, train patronage fell slightly for the year ending June 2012,<br />
although most recent figures indicate that patronage is growing again.<br />
While the overall yearly figure for train was slightly down, trips in peak times continued to grow by<br />
around 3 per cent in the morning and afternoon peaks. In the most recent quarter (April – June), train<br />
had its second strongest quarter on record with 58.9 million trips made by passengers.<br />
The slight decline in train patronage can be attributed to a number of factors including lower retail<br />
sales in the city, the broader impact of a downturn in the global economy, decline in petrol prices<br />
and the highly publicised period of poor performance in April 2011 when Metro’s punctuality fell<br />
to just 76 per cent – the lowest level in decades.<br />
Figure 11 Metropolitan train, tram and bus patronage<br />
250<br />
200<br />
Patronage (millions)<br />
150<br />
100<br />
50<br />
0<br />
1998<br />
– 99<br />
1999<br />
– 00<br />
2000<br />
– 01<br />
2001<br />
– 02<br />
2002<br />
– 03<br />
2003<br />
– 04<br />
2004<br />
– 05<br />
2005<br />
– 06<br />
2006<br />
– 07<br />
2007<br />
– 08<br />
2008<br />
– 09<br />
2009<br />
– 10<br />
2010<br />
– 11<br />
2011<br />
– 12<br />
Financial Year<br />
Metropolitan train Tram Metropolitan bus
<strong>Track</strong> <strong>Record</strong> Quarterly services bulletin 15<br />
Table 11<br />
Metropolitan train, tram and bus patronage<br />
Metropolitan train Metropolitan tram Metropolitan bus Metropolitan total<br />
Financial<br />
Year<br />
Boardings<br />
(million)<br />
Annual<br />
growth (%)<br />
Boardings<br />
(million)<br />
Annual<br />
growth (%)<br />
Boardings<br />
(million)<br />
Annual<br />
growth (%)<br />
Boardings<br />
(million)<br />
Annual<br />
growth (%)<br />
1998 – 1999 118.0 4.4% 120.4 3.1% 91.5 –0.8% 329.9 2.5%<br />
1999 – 2000 124.2 5.3% 127.3 5.7% 91.6 0.1% 343.1 4.0%<br />
2000 – 2001 130.3 4.9% 129.4 1.6% 92.0 0.4% 351.7 2.5%<br />
2001 – 2002 131.8 1.2% 131.9 1.9% 92.0 0.0% 355.7 1.1%<br />
2002 – 2003 133.8 1.5% 134.7 2.1% 93.9 2.1% 362.4 1.9%<br />
2003 – 2004 134.9 0.8% 135.9 0.9% 93.6 –0.3% 364.4 4 0.6%<br />
2004 – 2005 145.1 3 4.0% 4 145.3 3 2.0% 4 90.0 stable 4 380.4 3 2.5% 4<br />
2005 – 2006 159.1 1 9.7% 1 149.6 1 2.9% 1 79.1 1,3 stable 1,3 387.8 3 4.9% 4<br />
2006 – 2007 178.6 12.2% 154.9 3.6% 85.0 7.4% 418.4 7.9%<br />
2007 – 2008 201.2 12.7% 158.3 2.2% 91.3 7.4% 450.8 7.7%<br />
2008 – 2009 213.9 6.3% 178.1 12.5% 99.5 9.0% 491.5 9.0%<br />
2009 – 2010 219.3 2.7% 5 175.6 –1.2% 5 102.1 3.9% 5 497.0 1.5% 5<br />
2010 – 2011 228.9 4.3% 5 182.7 4.1% 5 106.1 3.7% 5 517.7 4.1% 5<br />
2011 – 2012 222.0 –3.3% 5 191.6 4.5% 5 123.2 15.8% 5 536.8 3.4% 5<br />
Notes:<br />
1<br />
Figures exclude additional patronage associated with the Commonwealth Games.<br />
2<br />
Bus includes metropolitan school bus services.<br />
3<br />
Patronage estimates for the three metropolitan modes are estimated using a different methodology from 2004 – 2005.<br />
This change in methodology means a step-change in patronage estimates from 2003 – 2004 to 2004 – 2005 for train and<br />
tram and 2004 – 2005 to 2005 – 2006 for bus. This needs to be considered when comparing estimates across years.<br />
4<br />
The double line in the above table shows the break in series.<br />
5<br />
Growth figures for 2004 – 2005 by modes and 2005 – 2006 for all modes are estimates arrived at jointly by DOI, Metlink<br />
and the operators. They are not derived from the previous years patronage figures because of the change in measurement<br />
methodology described in point 3 above.<br />
6<br />
From 2009 – 2010, patronage growth rates have been adjusted for calendar effects. The calendar effect adjustment results<br />
in a more accurate measure of the underlying growth rate by removing the effect that differing number of school holidays,<br />
weekends and public holidays may have upon the apparent growth rate.
16 <strong>Track</strong> <strong>Record</strong> Quarterly services bulletin<br />
Regional train, coach and bus<br />
Total regional patronage grew by 4.5 per cent to a total of 29.8 million passenger trips in 2011 – 2012.<br />
V/Line has experienced sustained growth since 2005, adding on average around one million<br />
passenger trips a year.<br />
Regional train patronage grew by 3.5 per cent, or approximately 900,000 trips (7.4 per cent in<br />
2010 – 2011) while coach patronage grew by 36.6 per cent, or 400,000 trips.<br />
All regional train lines experienced patronage increases: Geelong 130,000 additional trips, Bendigo<br />
90,000, Ballarat 110,000, Gippsland 90,000 and Seymour 80,000.<br />
Regional bus patronage grew by 2.7 per cent in 2011 – 2012, with 14.3 million passenger trips taken.<br />
Figure 12 Regional train, coach and bus patronage<br />
16<br />
14<br />
12<br />
Patronage (millions)<br />
10<br />
8<br />
6<br />
4<br />
2<br />
0<br />
1998<br />
– 99<br />
1999<br />
– 00<br />
2000<br />
– 01<br />
2001<br />
– 02<br />
2002<br />
– 03<br />
2003<br />
– 04<br />
2004<br />
– 05<br />
2005<br />
– 06<br />
2006<br />
– 07<br />
2007<br />
– 08<br />
2008<br />
– 09<br />
2009<br />
– 10<br />
2010<br />
– 11<br />
2011<br />
– 12<br />
Financial Year<br />
Regional train Regional coach Regional bus
<strong>Track</strong> <strong>Record</strong> Quarterly services bulletin 17<br />
Table 12<br />
Regional train, coach and bus patronage<br />
Regional train Regional coach Regional bus Regional total<br />
Financial<br />
Year<br />
Boardings<br />
(million)<br />
Annual<br />
growth (%)<br />
Boardings<br />
(million)<br />
Annual<br />
growth (%)<br />
Boardings<br />
(million)<br />
Annual<br />
growth (%)<br />
Boardings<br />
(million)<br />
Annual<br />
growth (%)<br />
1998 – 2099 6.845 4.8% 1.012 –10.6% 10.477 2 stable 18.3 1.1%<br />
1999 – 2000 7.406 8.2% 1.071 5.9% 10.577 2 1.0% 19.1 3.9%<br />
2000 – 2001 7.930 7.1% 0.971 –9.3% 11.085 2 4.8% 20.0 4.9%<br />
2001 – 2002 7.737 –2.4% 0.968 –0.4% 11.096 2 0.1% 19.8 –0.9%<br />
2002 – 2003 7.475 –3.4% 0.985 1.7% 10.496 2 –5.4% 19.0 –4.3%<br />
2003 – 2004 6.863 –8.2% 0.902 –8.4% 10.664 2 1.6% 18.4 –2.8%<br />
2004 – 2005 6.378 –7.1% 0.871 –3.5% 10.675 2 0.1% 17.9 –2.7%<br />
2005 – 2006 6.593 1 3.4% 1 0.898 3.1% 11.268 2 5.6% 18.8 4.7%<br />
2006 – 2007 8.849 34.2% 0.874 –2.7% 12.268 2 8.9% 22.0 17.2%<br />
2007 – 2008 11.008 24.4% 0.959 9.7% 12.977 5.8% 24.9 13.4%<br />
2008 – 2009 12.050 9.5% 1.119 16.7% 13.099 0.9% 26.3 5.3%<br />
2009 – 2010 12.562 4.4% 3 1.143 2.2% 3 13.471 3.2% 3 27.2 3.7% 3<br />
2010 – 2011 13.494 7.4% 1.159 1.5% 14.819 9.8% 29.5 8.3%<br />
2011 – 2012 13.997 3.5% 1.554 36.6% 14.291 2.7% 29.8 4.5%<br />
Notes:<br />
1<br />
Figures exclude additional patronage associated with the Commonwealth Games.<br />
2<br />
Based on ‘country & urban figures reported in DOT / DOI annual reports, less ‘V/Line marketed’ coach patronage which<br />
is included in ‘regional coach’ figures. Also known as ‘country & urban’ or ‘town & inter-town’.<br />
3<br />
From 2009 – 2010, patronage growth rates have been adjusted for calendar effects. The calendar effect adjustment results<br />
in a more accurate measure of the underlying growth rate by removing the effect that differing number of school holidays,<br />
weekends and public holidays may have upon the apparent growth rate
18 <strong>Track</strong> <strong>Record</strong> Quarterly services bulletin<br />
Ticketing equipment<br />
This section provides information on the availability of Metcard ticketing vending and validating<br />
equipment across the quarter.<br />
Table 13 Availability of Metcard equipment (%)<br />
Target<br />
Jul – Sep<br />
2011<br />
Oct – Dec<br />
2011<br />
Jan – Mar<br />
2012<br />
Apr – Jun<br />
2012<br />
Jul – Sep<br />
2012<br />
Vending machines 98.26% 98.83% 98.74% 98.79% 99.21% 99.45%<br />
Validators 99.47% 99.60% 99.55% 99.52% 99.69% 99.75%<br />
Jul – Sep<br />
2011<br />
Oct – Dec<br />
2011<br />
Jan – Mar<br />
2012<br />
Apr – Jun<br />
2012<br />
Jul – Sep<br />
2012<br />
Tram vending machines 97.8% 97.0% 97.7% 98.3% 98.7%<br />
Tram validators 99.0% 98.9% 99.3% 99.1% 99.5%<br />
Bus issuing machines 99.5% 99.5% 99.5% 99.6% 99.6%<br />
Bus validators 99.6% 99.6% 99.7% 99.7% 99.8%<br />
Figure 13 Availability of Metcard ticketing equipment, April quarter 2009 to September quarter 2012 (%)<br />
Availability of ticketing equipment (%)<br />
100<br />
95<br />
90<br />
85<br />
Apr – Jun 2009<br />
Jul – Sep 2009<br />
Oct – Dec 2009<br />
Jan – Mar 2010<br />
Apr – Jun 2010<br />
Jul – Sep 2010<br />
Oct – Dec 2010<br />
Jan – Mar 2011<br />
Apr – Jun 2011<br />
Jul – Sep 2011<br />
Oct – Dec 2011<br />
Jan – Mar 2012<br />
Apr – Jun 2012<br />
Jul – Sep 2012<br />
Train vending machines<br />
Tram vending machines<br />
Bus vending machines<br />
Train validators<br />
Tram validators<br />
Bus validators
<strong>Track</strong> <strong>Record</strong> Quarterly services bulletin 19<br />
Figure 14 Incidents of vandalism on Metcard ticketing equipment<br />
Vandalism incidents per quarter<br />
8000<br />
7000<br />
6000<br />
5000<br />
4000<br />
3000<br />
2000<br />
1000<br />
0<br />
Mar 2001<br />
Sep 2001<br />
Sep 2002<br />
Sep 2002<br />
Sep 2003<br />
Sep 2003<br />
Sep 2004<br />
Sep 2004<br />
Sep 2005<br />
Sep 2005<br />
Sep 2006<br />
Sep 2006<br />
Sep 2007<br />
Sep 2007<br />
Sep 2008<br />
Sep 2008<br />
Sep 2009<br />
Sep 2009<br />
Sep 2010<br />
Sep 2010<br />
Sep 2011<br />
Sep 2011<br />
Sep 2012
For more information visit ptv.vic.gov.au<br />
or call 1800 800 007 (6am – midnight daily)<br />
<strong>Public</strong> <strong>Transport</strong> <strong>Victoria</strong> is your central stop<br />
for information on public transport services,<br />
fares, tickets and initiatives. Up-to-date<br />
information is available via our website,<br />
call centre and mobile applications.<br />
© State of <strong>Victoria</strong> 2013<br />
PTVH0106


