Track Record - Public Transport Victoria
Track Record - Public Transport Victoria
Track Record - Public Transport Victoria

You also want an ePaper? Increase the reach of your titles
YUMPU automatically turns print PDFs into web optimized ePapers that Google loves.
14 <strong>Track</strong> <strong>Record</strong> Quarterly services bulletin<br />
Patronage<br />
Metropolitan trains, trams and buses<br />
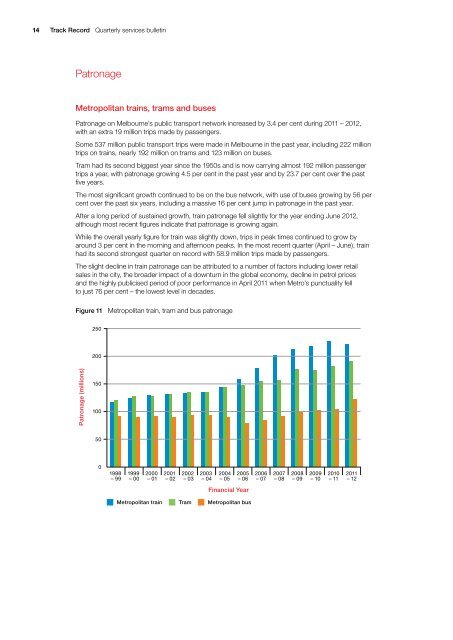
Patronage on Melbourne’s public transport network increased by 3.4 per cent during 2011 – 2012,<br />
with an extra 19 million trips made by passengers.<br />
Some 537 million public transport trips were made in Melbourne in the past year, including 222 million<br />
trips on trains, nearly 192 million on trams and 123 million on buses.<br />
Tram had its second biggest year since the 1950s and is now carrying almost 192 million passenger<br />
trips a year, with patronage growing 4.5 per cent in the past year and by 23.7 per cent over the past<br />
five years.<br />
The most significant growth continued to be on the bus network, with use of buses growing by 56 per<br />
cent over the past six years, including a massive 16 per cent jump in patronage in the past year.<br />
After a long period of sustained growth, train patronage fell slightly for the year ending June 2012,<br />
although most recent figures indicate that patronage is growing again.<br />
While the overall yearly figure for train was slightly down, trips in peak times continued to grow by<br />
around 3 per cent in the morning and afternoon peaks. In the most recent quarter (April – June), train<br />
had its second strongest quarter on record with 58.9 million trips made by passengers.<br />
The slight decline in train patronage can be attributed to a number of factors including lower retail<br />
sales in the city, the broader impact of a downturn in the global economy, decline in petrol prices<br />
and the highly publicised period of poor performance in April 2011 when Metro’s punctuality fell<br />
to just 76 per cent – the lowest level in decades.<br />
Figure 11 Metropolitan train, tram and bus patronage<br />
250<br />
200<br />
Patronage (millions)<br />
150<br />
100<br />
50<br />
0<br />
1998<br />
– 99<br />
1999<br />
– 00<br />
2000<br />
– 01<br />
2001<br />
– 02<br />
2002<br />
– 03<br />
2003<br />
– 04<br />
2004<br />
– 05<br />
2005<br />
– 06<br />
2006<br />
– 07<br />
2007<br />
– 08<br />
2008<br />
– 09<br />
2009<br />
– 10<br />
2010<br />
– 11<br />
2011<br />
– 12<br />
Financial Year<br />
Metropolitan train Tram Metropolitan bus