
You also want an ePaper? Increase the reach of your titles
YUMPU automatically turns print PDFs into web optimized ePapers that Google loves.
USA<br />
REPORT<br />
QUARTERLY<br />
CONSTRUCTION<br />
COST REPORT<br />
SECOND QUARTER 2012
USA<br />
REPORT<br />
AT A<br />
GLANCE<br />
While less than expected, the pace of economic<br />
expansion in the first quarter of 2012 (2.2% quarterly<br />
increase in GDP) followed the general upward trend of<br />
the past few years; and, in addition, the all-important<br />
bellwethers of consumer spending and consumer<br />
confidence also continued to improve. Nevertheless,<br />
to overcome the damage the recession did to jobs,<br />
income, wealth and confidence, the economy still<br />
needs to achieve consistently stronger growth and job<br />
production.<br />
Looking at the construction industry, the Architectural<br />
Billings Index, while no longer showing declines,<br />
is reporting anemic figures best characterized as<br />
“bouncing along the bottom”. Reflecting this fragility,<br />
the economic Laws of Supply and Demand continue to<br />
mute construction price increases.<br />
On a brighter note, construction of multifamily units will<br />
lead the U.S. building industry again this year, allowing<br />
“housing” to contribute to growth for the first time in<br />
several years.<br />
Single-family home starts Ð which fell to a five-year<br />
low in 2011 Ð are starting to recover and we expect<br />
that activity will continue to increase through 2012 as<br />
the overall economy and employment opportunities<br />
improve.<br />
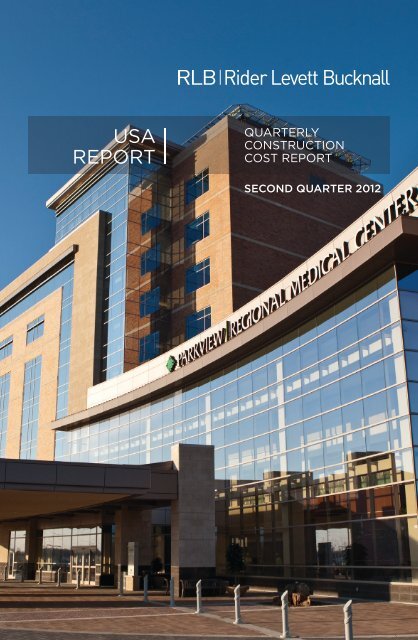
PARKVIEW REGIONAL MEDICAL CENTER<br />
FORT WAYNE, INDIANA<br />
Completed in the spring of 2012, the new 900,000 square foot Parkview Regional<br />
Medical Center features over 400 all-private rooms, critical care and surgery centers,<br />
verified Level II Adult and Pediatric Trauma Centers, and specialty centers for heart,<br />
cancer, women’s and children’s health, and orthopedics. Among the facility’s stateof-the-art<br />
elements are work areas and hallways equipped with ‘smart’ technology,<br />
including a nurse tracking and call system, adjustable lighting, over-bed lifts, boommounted<br />
equipment, and smart beds which can weigh a patient, connect to the<br />
patient’s electronic medical record, and detect side rail positions and bed height to<br />
monitor patient safety.<br />
<strong>Rider</strong> <strong>Levett</strong> <strong>Bucknall</strong> – doing business as RLB|Garrison and in partnership with<br />
The Carter Group – provided move coordination and building load readiness for the new<br />
facility, including development and implementation of a comprehensive building and<br />
patient readiness master schedule and coordination of FF&E deliveries and installations.<br />
Renderings courtesy of Parkview Regional Medical Center.<br />
1
USA<br />
REPORT<br />
NATIONAL<br />
CONSTRUCTION<br />
COST INDEX<br />
The National Construction Cost<br />
Index shows the changing<br />
cost of construction between<br />
April 2007 and April 2012, relative<br />
to a base of 100 at April 2001. Index<br />
recalibrated as of April 2011.<br />
Date<br />
Cost Index<br />
April 2007 138.74<br />
July 2007 142.38<br />
October 2007 145.63<br />
January 2008 147.78<br />
April 2008 150.40<br />
July 2008 152.36<br />
October 2008 154.04<br />
January 2009 152.95<br />
April 2009 145.19<br />
July 2009 143.35<br />
October 2009 142.48<br />
January 2010 141.80<br />
April 2010 142.21<br />
July 2010 142.58<br />
October 2010 142.60<br />
January 2011 142.77<br />
April 2011 143.42<br />
July 2011 144.53<br />
October 2011 145.29<br />
January 2012 145.73<br />
April 2012 146.35<br />
Welcome to the second quarter 2012 issue of our series<br />
of <strong>Rider</strong> <strong>Levett</strong> <strong>Bucknall</strong> Quarterly Cost Reports!<br />
This issue contains data current to April 1, 2012.<br />
According to the U.S. Department of Commerce, construction put in<br />
place during March 2012 was estimated at a seasonally adjusted annual<br />
rate of $808.1 billion, which is 0.1% above the revised February estimate<br />
of $807.3 billion. The March 2012 figure is 6.0% above the March 2011<br />
estimate. The total value of construction for the first three months of<br />
this year was $171.2 billion, 6.7% above the same period in 2011.<br />
2
160<br />
155<br />
150<br />
145<br />
140<br />
135<br />
130<br />
125<br />
April 2012<br />
120<br />
2007 2008 2009 2010 2011 2012<br />
KEY UNITED STATES STATISTICS<br />
Q2 2011 Q3 2011 Q4 2011 Q1 2012<br />
Gross Domestic Product (GDP) 1.3% 1.8% 2.8% 2.2%<br />
Consumer Price Index (CPI) 225.7 226.9 225.7 229.4<br />
Inflation 1.0% 0.5% -0.5% 1.6%<br />
Architectural Billings Index (ABI) 46.3 46.9 52.0 50.4<br />
Construction Put in Place $772.3 $787.2 $816.4 $808.1<br />
Unemployment 9.1% 9.1% 8.7% 8.2%<br />
Construction Unemployment 15.6% 13.3% 16.0% 17.2%<br />
GDP represented in percent change from the preceding quarter, seasonally adjusted at annual rates. CPI quarterly<br />
figures represent the monthly value at the end of the quarter. Inflation rates represent the total price of inflation from the<br />
previous quarter, based on the change in the Consumer Price Index. ABI is derived from a monthly American Institute<br />
of Architects survey of architectural firms of their work on the boards, reported at the end of the period. Construction<br />
Put in Place figures represent total value of construction dollars in billions spent at a seasonally adjusted annual rate<br />
taken at the end of each quarter. General Unemployment rates are based on the total population 16 years and older.<br />
Construction Unemployment rates represent only the percent of experienced private wage and salary workers in the<br />
construction industry 16 years and older. Unemployment rates are seasonally adjusted, reported at the end of the period.<br />
Sources: U.S. Bureau of Labor Statistics, Bureau of Economic Analysis, American Institute of Architects<br />
3
USA<br />
REPORT<br />
INDICATIVE CONSTRUCTION COSTS<br />
The data in the chart below represents estimates of current building costs in each respective market. Costs may<br />
vary as a consequence of factors such as site conditions, climatic conditions, standards of specification, market<br />
conditions, etc. Values represent hard construction costs based on U.S. dollars per square foot of gross floor area.<br />
OFFICES RETAIL SHOPPING HOTELS<br />
PRIME SECONDARY CENTER STRIP 5 STAR 3 STAR<br />
LOCATION LOW HIGH LOW HIGH LOW HIGH LOW HIGH LOW HIGH LOW HIGH<br />
HOSPITAL INDUSTRIAL PARKING RESIDENTIAL<br />
GENERAL WAREHOUSE GROUND BASEMENT MULTIFAMILY SINGLE FAMILY<br />
LOW HIGH LOW HIGH LOW HIGH LOW HIGH LOW HIGH LOW HIGH<br />
EDUCATION<br />
ELEMENTARY HIGH SCHOOL UNIVERSITY<br />
LOW HIGH LOW HIGH LOW HIGH<br />
Boston 200 280 175 245 120 210 90 145 250 400 160 250 375 550 70 100 60 90 80 110 135 220 165 325 220 300 240 350 275 400<br />
Denver 140 225 100 150 80 130 65 125 185 280 105 165 330 385 65 110 40 70 60 95 70 185 60 350 115 150 140 210 170 285<br />
Honolulu 210 390 175 290 150 360 120 315 380 550 235 400 345 560 105 165 65 100 100 190 140 325 205 560 245 345 300 450 325 530<br />
Las Vegas 140 285 105 190 115 480 65 145 325 465 120 225 285 455 50 100 50 85 60 150 70 400 90 350 180 315 200 455 235 455<br />
Los Angeles 180 280 120 195 110 195 80 140 250 390 170 245 350 550 70 120 60 95 85 130 135 215 120 280 250 350 280 410 295 430<br />
New York 205 350 180 270 140 250 115 160 320 475 185 265 450 600 90 130 65 105 85 125 140 250 175 350 190 340 220 375 275 400<br />
Phoenix 125 230 100 155 105 165 70 125 210 350 110 160 290 420 55 100 40 65 60 100 80 185 100 300 140 200 170 240 210 375<br />
Portland 165 210 115 160 110 195 90 130 175 265 130 170 320 435 75 110 65 85 85 125 110 195 100 250 180 235 190 250 235 340<br />
San Francisco 195 300 140 220 120 220 110 165 265 410 190 260 360 570 80 130 70 100 90 140 145 230 140 300 260 360 290 420 310 440<br />
Seattle 165 205 115 160 115 200 95 135 185 275 140 180 320 435 75 110 65 85 85 125 120 235 100 235 205 250 230 300 265 395<br />
Washington, DC 175 240 130 185 95 190 75 135 230 375 150 230 350 500 70 100 55 80 75 100 100 185 120 250 190 250 220 275 250 375<br />
ARCHITECTURAL BILLINGS INDEX<br />
As of February 1, 2012, Chicago-based construction management firm<br />
Garrison, Inc. has joined property and construction consultancy <strong>Rider</strong><br />
<strong>Levett</strong> <strong>Bucknall</strong> and is now doing business in Chicago as RLB|Garrison.<br />
Garrison, Inc. specializes in Owner’s Representative and Construction<br />
Consulting services in the midwest and was established in 1985, starting<br />
with a commission on the redevelopment of the two million square foot<br />
Prudential Plaza project in Chicago’s East Loop. Subsequent assignments<br />
expanded their offerings to include forensic consulting, medical<br />
equipment consultation, procurement, and transition planning/occupancy<br />
services.<br />
Currently, RLB|Garrison is finalizing coordination for the procurement,<br />
delivery, installation, and budget management of all furniture, fixtures, and<br />
equipment at the new Central DuPage Hospital Bed Tower along with the<br />
CDH Comprehensive Outpatient Cancer Treatment and Imaging Center in<br />
Warrenville, Illinois.<br />
4<br />
65<br />
60<br />
55<br />
50<br />
45<br />
40<br />
35<br />
March 2012<br />
2007 2008 2009 2010 2011 2012<br />
The Architecture Billings Index (ABI), produced by the<br />
American Institute of Architects (AIA), is a leading economic<br />
indicator that provides an approximate 9- to 12-month<br />
glimpse into the future of nonresidential construction<br />
spending activity. The monthly ABI scores are derived<br />
from a “Work-on-the-Boards” survey asking AIA-member<br />
firms whether their billings increased, decreased, or stayed<br />
the same as compared to the prior month. A score above<br />
50 indicates an aggregate increase in billings (i.e. market<br />
growth), and a score below 50 indicates a decline.<br />
5
USA<br />
REPORT<br />
COMPARATIVE COST INDEX<br />
20,000<br />
19,000<br />
18,000<br />
17,000<br />
16,000<br />
15,000<br />
14,000<br />
13,000<br />
12,000<br />
11,000<br />
10,000<br />
9,000<br />
April 2012<br />
2007 2008 2009 2010 2011 2012<br />
Each quarter we look at the<br />
comparative cost of construction<br />
in 11 U.S. cities, indexing them to<br />
show how costs are changing in<br />
each city in particular, and against<br />
the costs in the other 10 locations.<br />
This Comparative Cost Index tracks<br />
the true bid cost of construction,<br />
which includes, in addition to costs<br />
of labor and materials, general<br />
contractor and subcontractor<br />
overhead costs and fees (profit).<br />
The index also includes applicable<br />
sales/use taxes that standard<br />
construction contracts attract.<br />
City<br />
January April %<br />
2012 2012 Change<br />
• Boston 16,728 16,841 0.67%<br />
• Denver 11,720 11,749 0.25%<br />
• Honolulu 17,556 17,699 0.81%<br />
• Las Vegas 11,684 11,754 0.60%<br />
• Los Angeles 15,777 15,786 0.06%<br />
• New York 19,528 19,624 0.49%<br />
• Phoenix 11,686 11,752 0.56%<br />
• Portland 12,297 12,300 0.02%<br />
• San Francisco 17,294 17,295 0.01%<br />
• Seattle 13,348 13,444 0.72%<br />
• Washington, DC 15,566 15,633 0.43%<br />
6
Our research suggests that between January 1, 2012 and April 1, 2012, the<br />
national average increase in construction cost was approximately 0.4%.<br />
While inflation across all cities was moderate, Boston, Honolulu,<br />
Las Vegas, and Seattle reported higher relative increases of between<br />
0.6% and approximately 0.8%. On the low end of the spectrum were Los<br />
Angeles, Portland, and San Francisco, all of which reported quarterly<br />
increases of less than 0.1%.<br />
COST INDEX Boston<br />
The following escalation charts track changes in<br />
the cost of construction each quarter in many of<br />
the cities where <strong>Rider</strong> <strong>Levett</strong> <strong>Bucknall</strong> offices are<br />
located. Each chart graphs the percentage change<br />
per period and the cumulative percentage change<br />
throughout the charted timeline.<br />
Percentage change per quarter<br />
Cumulative percentage change for the<br />
period shown<br />
5%<br />
0<br />
0.19%<br />
0.82%<br />
0.64%<br />
0.03%<br />
0.67%<br />
-5%<br />
Apr ’11 Jul ’11 Oct ’11 Jan ’12 Apr ’12<br />
5%<br />
COST INDEX Denver<br />
7%<br />
COST INDEX Honolulu<br />
0.56%<br />
0.42% 0.45% 0.32% 0.25%<br />
3.11%<br />
0<br />
0<br />
0.95%<br />
0.11%<br />
1.08%<br />
0.81%<br />
-5%<br />
Apr ’11 Jul ’11 Oct ’11 Jan ’12 Apr ’12<br />
-3%<br />
Apr ’11 Jul ’11 Oct ’11 Jan ’12 Apr ’12<br />
5%<br />
COST INDEX Las Vegas<br />
5%<br />
COST INDEX Los Angeles<br />
0<br />
0.33%<br />
0.25%<br />
0.52%<br />
0.55% 0.60%<br />
0<br />
0.32%<br />
0.67%<br />
0.68%<br />
0.19% 0.06%<br />
-5%<br />
Apr ’11 Jul ’11 Oct ’11 Jan ’12 Apr ’12<br />
-5%<br />
Apr ’11 Jul ’11 Oct ’11 Jan ’12 Apr ’12<br />
7
USA<br />
REPORT<br />
5%<br />
COST INDEX New York<br />
5%<br />
COST INDEX Phoenix<br />
0<br />
0.72%<br />
1.06%<br />
0.65%<br />
0.03%<br />
0.49%<br />
0<br />
0.48%<br />
0.56% 0.59% 0.46% 0.56%<br />
-5%<br />
Apr ’11 Jul ’11 Oct ’11 Jan ’12 Apr ’12<br />
-5%<br />
Apr ’11 Jul ’11 Oct ’11 Jan ’12 Apr ’12<br />
5%<br />
COST INDEX Portland<br />
5%<br />
COST INDEX San Francisco<br />
0<br />
0.43%<br />
0.68%<br />
0.70%<br />
0.23%<br />
0.02%<br />
0<br />
0.31%<br />
0.48%<br />
0.67%<br />
0.25%<br />
0.01%<br />
-5%<br />
Apr ’11 Jul ’11 Oct ’11 Jan ’12 Apr ’12<br />
-5%<br />
Apr ’11 Jul ’11 Oct ’11 Jan ’12 Apr ’12<br />
5%<br />
COST INDEX Seattle<br />
5%<br />
COST INDEX Washington, DC<br />
0<br />
0.50%<br />
0.21%<br />
0.19%<br />
0.22%<br />
0.72%<br />
0<br />
0.23%<br />
0.24%<br />
0.55%<br />
0.02%<br />
0.43%<br />
-5%<br />
Apr ’11 Jul ’11 Oct ’11 Jan ’12 Apr ’12<br />
-5%<br />
Apr ’11 Jul ’11 Oct ’11 Jan ’12 Apr ’12<br />
8<br />
While the information in this publication is believed to be correct, no responsibility is accepted<br />
for its accuracy. Persons desiring to utilize any information appearing in this publication should<br />
verify its applicability to their specific circumstances.<br />
This issue was compiled by Sara Libby with contributions from Julian Anderson, Paul Brussow,<br />
Chris Burris, Martin Grace, Cassie Idehara, Dan Junge, Scott Macpherson, Chris McCarthy,<br />
Gus Oppermann, Grant Owen, Evans Pomegas, and Graham Roy.<br />
© May 2012 by <strong>Rider</strong> <strong>Levett</strong> <strong>Bucknall</strong> Ltd.
Please don’t hesitate to contact us if we can provide you with<br />
more information or if we can be of service to you in any way.<br />
BARBADOS<br />
Phone: +1 246 435 5795<br />
E-mail: robert.hoyle@bb.rlb.com<br />
Contact: Robert Hoyle<br />
BOSTON<br />
Phone: +1 617 737 9339<br />
E-mail: BOS@us.rlb.com<br />
Contact: Grant Owen<br />
CALGARY<br />
Phone: +1 403 571 0505<br />
E-mail: YYC@ca.rlb.com<br />
Contact: Roy Baxter<br />
CAYMAN ISLANDS<br />
Phone: +1 345 946 6063<br />
E-mail: martyn.bould@ky.rlb.com<br />
Contact: Martyn Bould<br />
NEW LOCATION:<br />
CHICAGO<br />
Phone: +1 312 819 4250<br />
E-mail: ORD@us.rlb.com<br />
Contact: Robert Garrison<br />
Montie Garrison<br />
DENVER<br />
Phone: +1 720 904 1480<br />
E-mail: DEN@us.rlb.com<br />
Contact: Peter Knowles<br />
GUAM<br />
Phone: +1 671 473 9054<br />
E-mail: GUM@us.rlb.com<br />
Contact: Emile le Roux<br />
HILO<br />
Phone: +1 808 883 3379<br />
E-mail: ITO@us.rlb.com<br />
Contact: Kevin Mitchell<br />
HONOLULU<br />
Phone: +1 808 521 2641<br />
E-mail: HNL@us.rlb.com<br />
Contact: Tony Smith<br />
Paul Brussow<br />
Maelyn Uyehara<br />
KENNEWICK<br />
Phone: +1 509 735 3056<br />
E-mail: PSC@us.rlb.com<br />
Contact: Nick Castorina<br />
LAS VEGAS<br />
Phone: +1 702 227 8818<br />
E-mail: LAS@us.rlb.com<br />
Contact: Simon James<br />
LOS ANGELES<br />
Phone: +1 213 689 1103<br />
E-mail: LAX@us.rlb.com<br />
Contact: Graham Roy<br />
NEW YORK<br />
Phone: +1 212 952 1300<br />
E-mail: EWR@us.rlb.com<br />
Contact: Grant Owen<br />
ORLANDO<br />
Conventional Wisdom Corp.<br />
Phone: +1 407 905 0002<br />
E-mail: ideas@cwisdom.com<br />
Web: www.cwisdom.com<br />
Contact: David O’Neal<br />
Rick Schmidt<br />
PHOENIX<br />
Phone: +1 602 443 4848<br />
E-mail: PHX@us.rlb.com<br />
Contact: Julian Anderson<br />
Scott Macpherson<br />
John Jozwick<br />
PORTLAND<br />
Phone: +1 503 226 2730<br />
E-mail: PDX@us.rlb.com<br />
Contact: Graham Roy<br />
SAN FRANCISCO<br />
Phone: +1 415 362 2613<br />
E-mail: SFO@us.rlb.com<br />
Contact: Graham Roy<br />
SEATTLE (Downtown)<br />
Phone: +1 206 223 2055<br />
E-mail: SEA@us.rlb.com<br />
Contact: Chris Burris<br />
SEATTLE (Monroe)<br />
Phone: +1 360 805 0413<br />
E-mail: PAE@us.rlb.com<br />
Contact: Justin Dinius<br />
TUCSON<br />
Phone: +1 520 202 7378<br />
E-mail: TUS@us.rlb.com<br />
Contact: Joel Brown<br />
WAIKOLOA<br />
Phone: +1 808 883 3379<br />
E-mail: KOA@us.rlb.com<br />
Contact: Kevin Mitchell<br />
WASHINGTON, DC<br />
Phone: +1 202 457 1450<br />
E-mail: DCA@us.rlb.com<br />
Contact: Grant Owen
LOCATIONS<br />
RIDER LEVETT BUCKNALL<br />
Barbados I Boston I Calgary I Chicago<br />
Cayman Islands I Denver I Guam I Hilo I Honolulu<br />
Kennewick I Las Vegas I Los Angeles I Monroe<br />
New York I Phoenix I Portland I San Francisco<br />
Seattle I Tucson I Waikoloa I Washington, DC<br />
CONVENTIONAL WISDOM<br />
Orlando<br />
www.americas.rlb.com