Rebalancing and Returns.indd - Dimensional Fund Advisors
Rebalancing and Returns.indd - Dimensional Fund Advisors
Rebalancing and Returns.indd - Dimensional Fund Advisors

You also want an ePaper? Increase the reach of your titles
YUMPU automatically turns print PDFs into web optimized ePapers that Google loves.
<strong>Rebalancing</strong> <strong>and</strong> <strong>Returns</strong> 15<br />
Value, Small Neutral, <strong>and</strong> Small Growth). 8 The fixed income portion of the portfolio<br />
has 10% in one-month US Treasury bills, 10% in five-year US Treasury notes, 10% in<br />
long-term government bonds, <strong>and</strong> 10% in long-term corporate bonds. 9<br />
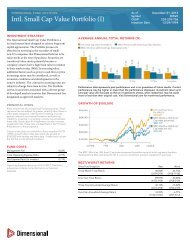
If the portfolio is never rebalanced, the allocation drifts from the initial 60/40 combination<br />
<strong>and</strong> becomes increasingly concentrated in stocks, as shown in the top panel<br />
of Exhibit 1. The equity allocation increases from 60% in 1926 to 90% by 1955, <strong>and</strong><br />
reaches 99.8% in 2008. The bottom panel of Exhibit 1 displays the weights in each<br />
asset class <strong>and</strong> shows that even within equities, the portfolio becomes overexposed<br />
to the highest-returning asset class. The Small Value portfolio initially had 8% of the<br />
portfolio allocation in 1927, but grew to 63% in 2008.<br />
To determine whether rebalancing increases returns, I compare the returns of the nonrebalanced<br />
portfolio to one that is simply rebalanced to target annually. Because 82<br />
years is a long time not to rebalance, even for an extremely long-lived <strong>and</strong> incredibly<br />
inattentive investor, I also consider cases where the portfolio is seldom rebalanced,<br />
at intervals of 5, 10, or 20 years. Because these rebalancing strategies do not require<br />
many trades, the effect of transactions cost would be minimal <strong>and</strong> are thus ignored in<br />
this analysis.<br />
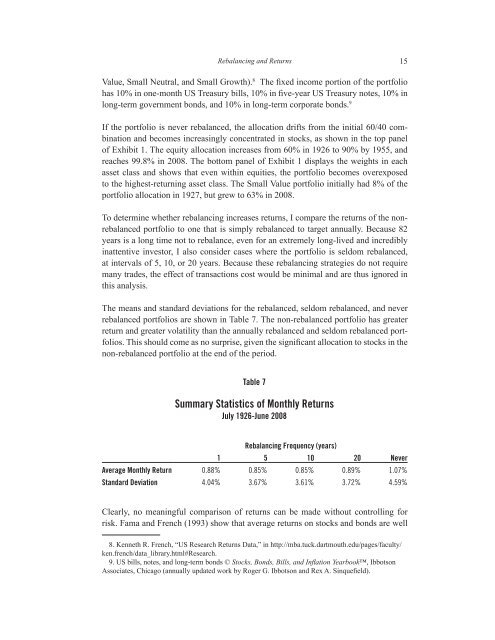
The means <strong>and</strong> st<strong>and</strong>ard deviations for the rebalanced, seldom rebalanced, <strong>and</strong> never<br />
rebalanced portfolios are shown in Table 7. The non-rebalanced portfolio has greater<br />
return <strong>and</strong> greater volatility than the annually rebalanced <strong>and</strong> seldom rebalanced portfolios.<br />
This should come as no surprise, given the significant allocation to stocks in the<br />
non-rebalanced portfolio at the end of the period.<br />
Table 7<br />
Summary Statistics of Monthly <strong>Returns</strong><br />
July 1926-June 2008<br />
<strong>Rebalancing</strong> Frequency (years)<br />
1 5 10 20 Never<br />
Average Monthly Return 0.88% 0.85% 0.85% 0.89% 1.07%<br />
St<strong>and</strong>ard Deviation 4.04% 3.67% 3.61% 3.72% 4.59%<br />
Clearly, no meaningful comparison of returns can be made without controlling for<br />
risk. Fama <strong>and</strong> French (1993) show that average returns on stocks <strong>and</strong> bonds are well<br />
8. Kenneth R. French, “US Research <strong>Returns</strong> Data,” in http://mba.tuck.dartmouth.edu/pages/faculty/<br />
ken.french/data_library.html#Research.<br />
9. US bills, notes, <strong>and</strong> long-term bonds © Stocks, Bonds, Bills, <strong>and</strong> Inflation Yearbook, Ibbotson<br />
Associates, Chicago (annually updated work by Roger G. Ibbotson <strong>and</strong> Rex A. Sinquefield).