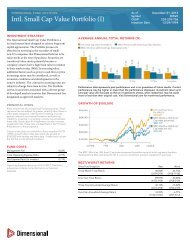
18 <strong>Dimensional</strong> <strong>Fund</strong> <strong>Advisors</strong> explained by their exposures to five risk factors: the market return in excess of the onemonth Treasury bill rate (MKT), the return on small capitalization stocks in excess of the return on large capitalization stocks (SMB), the return on value stocks in excess of the return on growth stocks (HML), the return on long-term government bonds in excess of the one-month Treasury bill rate (TERM), <strong>and</strong> the return of long-term corporate bonds in excess of the return on long-term government bonds (DEF). Any return that cannot be explained by these five risk factors appears in the alpha term of a five-factor regression. The factor loadings on the five Fama/French risk factors are plotted for both the nonrebalanced <strong>and</strong> the annually rebalanced portfolios in Exhibit 2. Because the coefficients in the five-factor regression may not be constant over the entire 82-year sample, I estimate rolling five-factor regressions using the previous 60 months of data. For example, coefficients reported for December 1990 are estimated using monthly data from January 1986 to December 1990. The risk factor exposures display a tendency to trend in a particular direction in the non-rebalanced portfolio, as shown in the top panel of Exhibit 2. The TERM <strong>and</strong> DEF risk factors mainly explain bond returns, <strong>and</strong> thus it is no surprise that the exposures to these two factors tend to zero as the share of bonds in the non-rebalanced portfolio gets close to zero. The coefficient on the market factor increases from about 0.6 to 1, echoing the increasing overall share of stocks in the nonrebalanced portfolio. The loadings on SMB <strong>and</strong> HML also trend upward, reflecting the increased exposures to small <strong>and</strong> value stocks. In contrast, maintaining the targeted risk exposures, which should be the primary goal of rebalancing, is successfully achieved in the annually rebalanced portfolio. The factor loadings of the rebalanced portfolio, shown in the lower panel of Exhibit 2, are fairly stable over the entire sample. If rebalancing produces returns in excess of the risks captured by these five factors, the five-factor alphas of the rebalanced portfolio should be larger than the alpha of the portfolios that are seldom or never rebalanced. The differences in alpha, plotted in the upper panel of Exhibit 3, should be positive on average. Aside from some large positive differences in the 1930s, the alphas of the rebalanced portfolio do not appear to be reliably larger than the portfolios rebalanced seldom or never. In fact, looking at the t-statistics for the differences in the lower panel of Exhibit 3, these differences are significantly positive about the same number of times they are significantly negative. A few significant instances, both negative <strong>and</strong> positive, are exactly what one should expect from r<strong>and</strong>om noise given so many observations. The results from the analysis of 82 years of data highlight the danger when interpreting return differences over short samples. Over short samples, it is possible that rebalanced portfolios can have higher risk-adjusted returns than portfolios rebalanced infrequently or not at all. However, the historical data shows that the reverse also occurs. Over the entire 82-year sample, it is clear that the rebalanced portfolio had no significant advantage over the portfolios rebalanced less frequently. It would be premature to declare the existence of positive rebalancing return benefits using 10 to 20 years of data because the period is too short <strong>and</strong> the data is too volatile to distinguish higher expected returns from luck.
<strong>Rebalancing</strong> <strong>and</strong> <strong>Returns</strong> 19 Exhibit 3 Difference in Alphas from Rolling Five-Factor Regressions June 1931-June 2008 Annually Rebalanced Alpha – Infrequent or Never Rebalanced Alpha T-Statistic