Rebalancing and Returns.indd - Dimensional Fund Advisors
Rebalancing and Returns.indd - Dimensional Fund Advisors
Rebalancing and Returns.indd - Dimensional Fund Advisors

You also want an ePaper? Increase the reach of your titles
YUMPU automatically turns print PDFs into web optimized ePapers that Google loves.
<strong>Rebalancing</strong> <strong>and</strong> <strong>Returns</strong> 5<br />
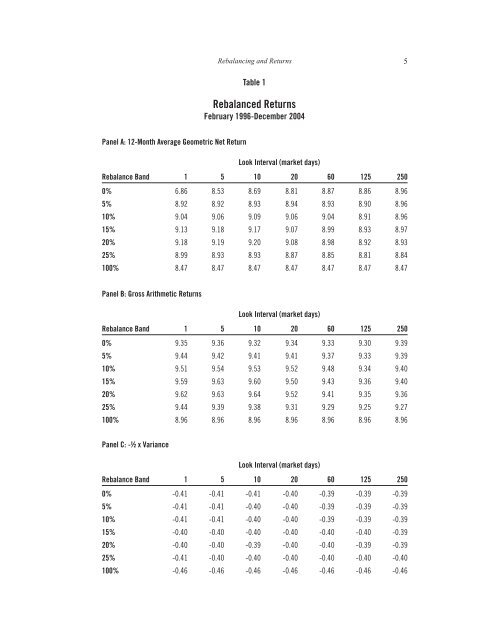
Table 1<br />
Rebalanced <strong>Returns</strong><br />
February 1996-December 2004<br />
Panel A: 12-Month Average Geometric Net Return<br />
Look Interval (market days)<br />
Rebalance B<strong>and</strong> 1 5 10 20 60 125 250<br />
0% 6.86 8.53 8.69 8.81 8.87 8.86 8.96<br />
5% 8.92 8.92 8.93 8.94 8.93 8.90 8.96<br />
10% 9.04 9.06 9.09 9.06 9.04 8.91 8.96<br />
15% 9.13 9.18 9.17 9.07 8.99 8.93 8.97<br />
20% 9.18 9.19 9.20 9.08 8.98 8.92 8.93<br />
25% 8.99 8.93 8.93 8.87 8.85 8.81 8.84<br />
100% 8.47 8.47 8.47 8.47 8.47 8.47 8.47<br />
Panel B: Gross Arithmetic <strong>Returns</strong><br />
Look Interval (market days)<br />
Rebalance B<strong>and</strong> 1 5 10 20 60 125 250<br />
0% 9.35 9.36 9.32 9.34 9.33 9.30 9.39<br />
5% 9.44 9.42 9.41 9.41 9.37 9.33 9.39<br />
10% 9.51 9.54 9.53 9.52 9.48 9.34 9.40<br />
15% 9.59 9.63 9.60 9.50 9.43 9.36 9.40<br />
20% 9.62 9.63 9.64 9.52 9.41 9.35 9.36<br />
25% 9.44 9.39 9.38 9.31 9.29 9.25 9.27<br />
100% 8.96 8.96 8.96 8.96 8.96 8.96 8.96<br />
Panel C: -½ x Variance<br />
Look Interval (market days)<br />
Rebalance B<strong>and</strong> 1 5 10 20 60 125 250<br />
0% -0.41 -0.41 -0.41 -0.40 -0.39 -0.39 -0.39<br />
5% -0.41 -0.41 -0.40 -0.40 -0.39 -0.39 -0.39<br />
10% -0.41 -0.41 -0.40 -0.40 -0.39 -0.39 -0.39<br />
15% -0.40 -0.40 -0.40 -0.40 -0.40 -0.40 -0.39<br />
20% -0.40 -0.40 -0.39 -0.40 -0.40 -0.39 -0.39<br />
25% -0.41 -0.40 -0.40 -0.40 -0.40 -0.40 -0.40<br />
100% -0.46 -0.46 -0.46 -0.46 -0.46 -0.46 -0.46