- Page 1 and 2: X-Ray Data Booklet X-RAY DATA BOOKL
- Page 3 and 4: X-Ray Data Booklet Physical Constan
- Page 5 and 6: C E N T E R F O R X - R A Y O P T I
- Page 7 and 8: 3. Scattering Processes 3-1 3.1 Sca
- Page 9 and 10: Data Booklet Authors X-Ray Data Boo
- Page 11 and 12: Data Booklet Authors http://xdb.lbl
- Page 13 and 14: 1 X-Ray Data Booklet Section 1.1 EL
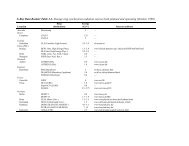
- Page 15 and 16: Table 1-1. Electron binding energie
- Page 17 and 18: Table 1-1. Electron binding energie
- Page 19 and 20: Table 1-1. Electron binding energie
- Page 21 and 22: Table 1-2 Table 1-1. Electron bindi
- Page 23 and 24: Table 1-2 28 Ni 8333 1008.6† 870.
- Page 25 and 26: Table 1-2 Table 1-1. Electron bindi
- Page 27 and 28: Table 1-2 51 Sb 33.3† 32.1† 52
- Page 29 and 30: Table 1-2 Table 1-1. Electron bindi
- Page 31 and 32: Table 1-2 75 Re 273.9† 260.5† 4
- Page 33: 1 X-Ray Data Booklet Section 1.2 X-
- Page 37 and 38: 41 Nb 16,615.1 16,521.0 18,622.5 2,
- Page 39 and 40: 82 Pb 74,969.4 72,804.2 84,936 10,5
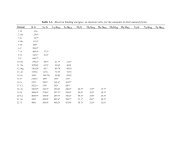
- Page 41 and 42: Table 1-3. Energies and intensities
- Page 43 and 44: Table 1-3. Energies and intensities
- Page 45 and 46: Energy (eV) Element Line Table 1-3.
- Page 47 and 48: Table 1-3. Energies and intensities
- Page 49 and 50: Table 1-3. Energies and intensities
- Page 51 and 52: Energy (eV) Element Line Table 1-3.
- Page 53 and 54: 1 X-Ray Data Booklet Section 1.3 FL
- Page 55 and 56: 1 X-Ray Data Booklet Section 1.4 PR
- Page 57 and 58: 1 X-Ray Data Booklet Section 1.5 SU
- Page 59 and 60: 1 Fig. 1-4. Subshell photoemission
- Page 61 and 62: 1 Fig. 1-4. Subshell photoemission
- Page 63 and 64: X-Ray Data Booklet Section 1.5 SUBS
- Page 65 and 66: 10 1 0.1 Nitrogen (N) Z = 7 Total 1
- Page 67 and 68: 10 1 0.1 3p Nickel (Ni) Z = 28 Tota
- Page 69 and 70: X-Ray Data Booklet Section 1.6 MASS
- Page 71 and 72: 10 6 Nitrogen (N) 10 4 10 2 10 0 10
- Page 73 and 74: 10 6 Nickel (Ni) 10 4 10 2 10 0 10
- Page 75 and 76: X-Ray Data Booklet Section 1.7 ATOM
- Page 77 and 78: 8 Oxygen (O) 12 Aluminum (Al) f 1 4
- Page 79 and 80: 60 40 Ruthenium (Ru) 80 Tungsten (W
- Page 81 and 82: http://xdb.lbl.gov/Section1/Sec_1-8
- Page 83 and 84: http://xdb.lbl.gov/Section1/Sec_1-8
- Page 85 and 86:
http://xdb.lbl.gov/Section1/Sec_1-8
- Page 87 and 88:
X-Ray Data Booklet Section 1.8 ENER
- Page 89 and 90:
Table 1-4. Ionization energies, in
- Page 91 and 92:
X-ray_Elements http://xdb.lbl.gov/S
- Page 93 and 94:
Test Electron Binding Energies in e
- Page 95 and 96:
Lithium | CXRO | ALS | Please send
- Page 97 and 98:
Lithium | CXRO | ALS | Please send
- Page 99 and 100:
Boron | CXRO | ALS | Please send qu
- Page 101 and 102:
Carbon | CXRO | ALS | Please send q
- Page 103 and 104:
Nitrogen Please send questions or c
- Page 105 and 106:
Nitrogen Please send questions or c
- Page 107 and 108:
Fluorine Please send questions or c
- Page 109 and 110:
Sodium Electron Binding Energies in
- Page 111 and 112:
Magnesium Electron Binding Energies
- Page 113 and 114:
Aluminium Electron Binding Energies
- Page 115 and 116:
Silicon Electron Binding Energies i
- Page 117 and 118:
Silicon Electron Binding Energies i
- Page 119 and 120:
Sulfur Electron Binding Energies in
- Page 121 and 122:
Chlorine Electron Binding Energies
- Page 123 and 124:
Argon Electron Binding Energies in
- Page 125 and 126:
Potassium Electron Binding Energies
- Page 127 and 128:
Calcium Electron Binding Energies i
- Page 129 and 130:
Scandium Electron Binding Energies
- Page 131 and 132:
Titanium Electron Binding Energies
- Page 133 and 134:
Vanadium Electron Binding Energies
- Page 135 and 136:
Chromium Electron Binding Energies
- Page 137 and 138:
Manganese Electron Binding Energies
- Page 139 and 140:
Iron Electron Binding Energies in e
- Page 141 and 142:
http://xdb.lbl.gov/Section1/Periodi
- Page 143 and 144:
http://xdb.lbl.gov/Section1/Periodi
- Page 145 and 146:
Fe Electron Binding Energies in ele
- Page 147 and 148:
Fe Electron Binding Energies in ele
- Page 149 and 150:
Gallium Electron Binding Energies i
- Page 151 and 152:
http://xdb.lbl.gov/Section1/Periodi
- Page 153 and 154:
Arsenic Electron Binding Energies i
- Page 155 and 156:
http://xdb.lbl.gov/Section1/Periodi
- Page 157 and 158:
http://xdb.lbl.gov/Section1/Periodi
- Page 159 and 160:
Krypton Electron Binding Energies i
- Page 161 and 162:
Rubidium Electron Binding Energies
- Page 163 and 164:
Strontium Electron Binding Energies
- Page 165 and 166:
Yttrium Electron Binding Energies i
- Page 167 and 168:
Zirconium Electron Binding Energies
- Page 169 and 170:
Niobium Electron Binding Energies i
- Page 171 and 172:
Molybdenum Electron Binding Energie
- Page 173 and 174:
Technetium Electron Binding Energie
- Page 175 and 176:
Ruthenium Electron Binding Energies
- Page 177 and 178:
Rhodium Electron Binding Energies i
- Page 179 and 180:
Palladium Electron Binding Energies
- Page 181 and 182:
Silver Electron Binding Energies in
- Page 183 and 184:
Cadmium Electron Binding Energies i
- Page 185 and 186:
Indium Electron Binding Energies in
- Page 187 and 188:
Tin Electron Binding Energies in el
- Page 189 and 190:
Antimony Electron Binding Energies
- Page 191 and 192:
Tellurium Electron Binding Energies
- Page 193 and 194:
Iodine Electron Binding Energies in
- Page 195 and 196:
Xenon Electron Binding Energies in
- Page 197 and 198:
http://xdb.lbl.gov/Section1/Periodi
- Page 199 and 200:
http://xdb.lbl.gov/Section1/Periodi
- Page 201 and 202:
Hafnium Electron Binding Energies i
- Page 203 and 204:
Tantalum Electron Binding Energies
- Page 205 and 206:
http://xdb.lbl.gov/Section1/Periodi
- Page 207 and 208:
Rhenium Electron Binding Energies i
- Page 209 and 210:
Osmium Electron Binding Energies in
- Page 211 and 212:
Iridium Electron Binding Energies i
- Page 213 and 214:
http://xdb.lbl.gov/Section1/Periodi
- Page 215 and 216:
http://xdb.lbl.gov/Section1/Periodi
- Page 217 and 218:
Mercury Electron Binding Energies i
- Page 219 and 220:
Thallium Electron Binding Energies
- Page 221 and 222:
http://xdb.lbl.gov/Section1/Periodi
- Page 223 and 224:
http://xdb.lbl.gov/Section1/Periodi
- Page 225 and 226:
http://xdb.lbl.gov/Section1/Periodi
- Page 227 and 228:
http://xdb.lbl.gov/Section1/Periodi
- Page 229 and 230:
http://xdb.lbl.gov/Section1/Periodi
- Page 231 and 232:
Radon Electron Binding Energies in
- Page 233 and 234:
Actinium Electron Binding Energies
- Page 235 and 236:
Rutherfordium Electron Binding Ener
- Page 237 and 238:
http://xdb.lbl.gov/Section1/Periodi
- Page 239 and 240:
Meitnerium Electron Binding Energie
- Page 241 and 242:
http://xdb.lbl.gov/Section1/Periodi
- Page 243 and 244:
http://xdb.lbl.gov/Section1/Periodi
- Page 245 and 246:
Cerium Electron Binding Energies in
- Page 247 and 248:
Praseodymium Electron Binding Energ
- Page 249 and 250:
Neodymium Electron Binding Energies
- Page 251 and 252:
Promethium Electron Binding Energie
- Page 253 and 254:
Samarium Electron Binding Energies
- Page 255 and 256:
Europium Electron Binding Energies
- Page 257 and 258:
Gadolinium Electron Binding Energie
- Page 259 and 260:
Terbium Electron Binding Energies i
- Page 261 and 262:
Dysprosium Electron Binding Energie
- Page 263 and 264:
Holmium Electron Binding Energies i
- Page 265 and 266:
Erbium Electron Binding Energies in
- Page 267 and 268:
Thulium Electron Binding Energies i
- Page 269 and 270:
Ytterbium Electron Binding Energies
- Page 271 and 272:
Lutetium Electron Binding Energies
- Page 273 and 274:
Thallium Electron Binding Energies
- Page 275 and 276:
Protactinium Electron Binding Energ
- Page 277 and 278:
Plutonium Electron Binding Energies
- Page 279 and 280:
Americium Electron Binding Energies
- Page 281 and 282:
Curium Electron Binding Energies in
- Page 283 and 284:
Berkelium Electron Binding Energies
- Page 285 and 286:
http://xdb.lbl.gov/Section1/Periodi
- Page 287 and 288:
Fermium Electron Configuration = [R
- Page 289 and 290:
Nobelium Electron Configuration = [
- Page 291 and 292:
Uranium Electron Binding Energies i
- Page 293 and 294:
Neptunium Electron Binding Energies
- Page 295 and 296:
X-Ray Data Booklet Order Form X-Ray
- Page 297 and 298:
SECTION 2 X-Ray Data Booklet Sectio
- Page 299 and 300:
SECTION 2 In practical units [photo
- Page 301 and 302:
SECTION 2 Fig. 2-2. Normalized inte
- Page 303 and 304:
SECTION 2 wiggler. B.1 Wiggler radi
- Page 305 and 306:
SECTION 2 Here, the J’s are Besse
- Page 307 and 308:
SECTION 2 Fig. 2-5. The angular dis
- Page 309 and 310:
SECTION 2 (18) where Z 0 = 377 ohms
- Page 311 and 312:
SECTION 2 Fig. 2-7. The angular fun
- Page 313 and 314:
SECTION 2 and where the single-elec
- Page 315 and 316:
SECTION 2 parameters as operating v
- Page 317 and 318:
History of Synchrotron Radiation So
- Page 319 and 320:
History of Synchrotron Radiation So
- Page 321 and 322:
History of Synchrotron Radiation So
- Page 323 and 324:
History of Synchrotron Radiation So
- Page 325 and 326:
History of Synchrotron Radiation So
- Page 327 and 328:
History of Synchrotron Radiation So
- Page 329 and 330:
History of Synchrotron Radiation So
- Page 331 and 332:
History of Synchrotron Radiation So
- Page 333 and 334:
http://xdb.lbl.gov/Section2/Sec_2-3
- Page 335 and 336:
http://xdb.lbl.gov/Section2/Sec_2-3
- Page 337 and 338:
X-Ray Data Booklet Table 2-1. Stora
- Page 339 and 340:
Location Spain Barcelona Sweden Lun
- Page 341 and 342:
ScatteringProcess X-Ray Data Bookle
- Page 343 and 344:
ScatteringProcess where . The kinet
- Page 345 and 346:
ScatteringProcess (Springer-Verlag,
- Page 347 and 348:
Section 3-2 Electron Ranges in Matt
- Page 349 and 350:
Section 3-2 Electron Ranges in Matt
- Page 351 and 352:
Section 3-2 Electron Ranges in Matt
- Page 353 and 354:
Section 3-2 Electron Ranges in Matt
- Page 355 and 356:
Fig. 3-3. Plot of the CSDA range, a
- Page 357 and 358:
Fig. 3-4. Inelastic mean free paths
- Page 359 and 360:
Section 4. Optics 4. Optics Content
- Page 361 and 362:
SECTION 4 rays make a small angle (
- Page 363 and 364:
SECTION 4 and can be found at the w
- Page 365 and 366:
SECTION 4 are called gratings and a
- Page 367 and 368:
SECTION 4 8 α-Quartz, silicon diox
- Page 369 and 370:
SECTION 4 28 Gypsum, calcium sulfat
- Page 371 and 372:
SECTION 4 44 Ammonium () 8.80 (CHOH
- Page 373 and 374:
SECTION 4 59 Rubidium hydrogen phth
- Page 375 and 376:
normally requires modeling or simul
- Page 377 and 378:
1.0 0.8 d = 4.5 nm Γ = 0.4 Reflect
- Page 379 and 380:
Table 4-1. Selected data for crysta
- Page 381 and 382:
Table 4-1. Selected data for crysta
- Page 383 and 384:
4 X-Ray Data Booklet Section 4.2 Sp
- Page 385 and 386:
4 Fig. 4-4. Specular reflectivities
- Page 387 and 388:
4 = 12.41 g/cm 3 ), and gold (ρ =
- Page 389 and 390:
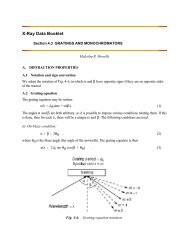
X-Ray Data Booklet Section 4.3 GRAT
- Page 391 and 392:
CD. Gratings with varied line spaci
- Page 393 and 394:
C 011 = - 1 r C 020 = S 2 C 022 = -
- Page 395 and 396:
C. DISPERSION PROPERTIES Dispersion
- Page 397 and 398:
2. H. A. Rowland, “On Concave Gra
- Page 399 and 400:
2 (II) FIXED IN AND OUT DIRECTIONS:
- Page 401 and 402:
4 Table 1: Ellipse coefficients Q i
- Page 403 and 404:
6 *Table 3: Coefficients C ijk of t
- Page 405 and 406:
8 B.3 Calculation of ray aberration
- Page 407 and 408:
10 R ⎧ h 2 E0 P P 4 1 2 1 4 = + (
- Page 409 and 410:
34. Welford, W. T., Aberrations of
- Page 411 and 412:
4 set of zone plate-defining parame
- Page 413 and 414:
4 Fig. 4-8. A Fresnel zone plate le
- Page 415 and 416:
X-Ray Data Booklet Section 4.5 X-RA
- Page 417 and 418:
B. GAS PROPORTIONAL COUNTERS Gas pr
- Page 419 and 420:
Finally, photographic film is also
- Page 421 and 422:
Table 5-1 X-Ray Data Booklet Sectio
- Page 423 and 424:
Table 5-1 molar volume, ideal gas a
- Page 425 and 426:
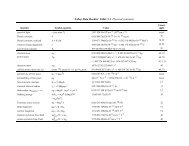
Table 5-1. Physical constants(conti
- Page 427 and 428:
Table 5-2 7 14.00674 0.808 -210.00
- Page 429 and 430:
Table 5-2 1 S 0 14.000 0.248 S 0 5.
- Page 431 and 432:
Table 5-2 63 Europium 151.964 5.244
- Page 433 and 434:
Table 5-2 89 Actinium (227) — 105
- Page 435 and 436:
X-Ray Data Booklet Table 5-2. Prope
- Page 437 and 438:
Table 5-2. Properties of the elemen
- Page 439 and 440:
http://xdb.lbl.gov/Section5/Sec_5-3
- Page 441 and 442:
http://xdb.lbl.gov/Section5/Sec_5-3
- Page 443 and 444:
X-Ray Data Booklet Section 5.3 ELEC
- Page 445 and 446:
Motion of charged particles in a un
- Page 447 and 448:
Table 5-3. Radiation weighting fact
- Page 449 and 450:
General X-Ray Formulas Wavelength a
- Page 451 and 452:
Snell’s law: sin φ ′ = sin φ
- Page 453 and 454:
Refractive index of plasma is √ n
- Page 455 and 456:
Spatially coherent power available
- Page 457:
Lithography Minimum printable line