A push for cleaner industrial production - EEB
A push for cleaner industrial production - EEB
A push for cleaner industrial production - EEB

You also want an ePaper? Increase the reach of your titles
YUMPU automatically turns print PDFs into web optimized ePapers that Google loves.
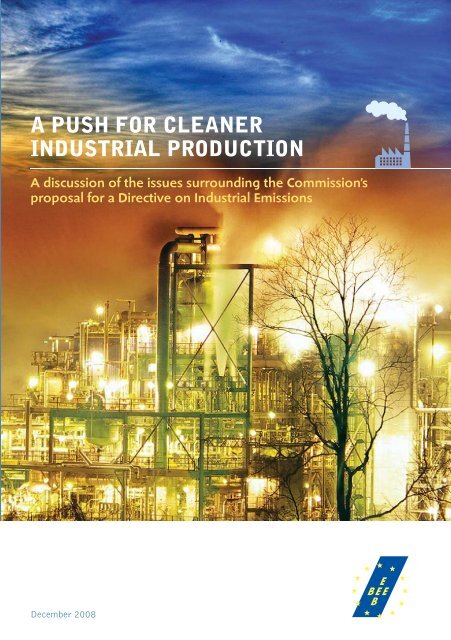
A PUSH FOR CLEANER<br />
INDUSTRIAL PRODUCTION<br />
A discussion of the issues surrounding the Commission’s<br />
proposal <strong>for</strong> a Directive on Industrial Emissions<br />
December 2008
<strong>EEB</strong> PUBLICATION NUMBER 2008/013<br />
Editor responsible<br />
John Hontelez<br />
Edited by<br />
Christian Schaible, <strong>EEB</strong> Chemicals and Industry Policy Officer and Doreen Fedrigo,<br />
<strong>EEB</strong> EU Policy Unit Coordinator<br />
European Environmental Bureau - <strong>EEB</strong> (aisbl)<br />
Boulevard de Waterloo 34 | B-1000 Brussels | Belgium<br />
Tel.: +32 2 289 1090 | Fax: +32 2 289 1099<br />
E-mail: eeb@eeb.org<br />
Website: www.eeb.org<br />
AN INTERNATIONAL NON-PROFIT ASSOCIATION<br />
<strong>EEB</strong> also gratefully acknowledges <strong>for</strong>mer <strong>EEB</strong> staff member Catherine Ganzleben <strong>for</strong><br />
preparing this report. The sole responsibility <strong>for</strong> the content of this document lies with<br />
<strong>EEB</strong>. This publication reflects the authors’ views and does not commit the donors.<br />
The <strong>EEB</strong> gratefully acknowledges financial support from the European Commission.<br />
Printed on 100% recycled chlorine-free paper using soy based inks.<br />
Cover photo: © Jeremy Stump
A PUSH FOR CLEANER<br />
INDUSTRIAL PRODUCTION<br />
A discussion of the issues surrounding the Commission’s<br />
proposal <strong>for</strong> a Directive on Industrial Emissions
A PUSH FOR CLEANER INDUSTRIAL PRODUCTION<br />
KEY ACRONYMS USED IN THIS DOCUMENT<br />
BAT<br />
BATAEL<br />
BREF<br />
ELVs<br />
IPPC<br />
LCPs<br />
NEC<br />
VOC<br />
Best Available Techniques<br />
Best Available Technique Associated Emission Level<br />
BAT Reference Document<br />
Emission Limit Values<br />
Integrated Pollution Prevention and Control<br />
Large Combustion Plants<br />
National Emissions Ceiling<br />
Volatile Organic Compounds<br />
2
Contents<br />
Background to the Revision of the IPPC Directive and the Aim of this Brief 4<br />
The Goalposts 5<br />
Promoting Innovation 8<br />
The Environmental Safety Net 12<br />
Combustion Plants 14<br />
Co-Incinerating Waste 19<br />
En<strong>for</strong>cement 22<br />
Soil and Groundwater 24<br />
Intensive Farming 26<br />
Summary of Solutions 30<br />
References 31<br />
Annex 1: Technical Tables 34<br />
3
A PUSH FOR CLEANER INDUSTRIAL PRODUCTION<br />
Background to the Revision of the IPPC Directive<br />
and the Aim of this Brief<br />
This paper provides background in<strong>for</strong>mation <strong>for</strong> discussions in the European Parliament during<br />
the 2007-2009 revision process of the Integrated Pollution Prevention and Control (IPPC) Directive<br />
which will be integrated into the Directive on Industrial Emissions.<br />
Since 1996, emissions from 52,000 <strong>industrial</strong> installations ranging from steel works to tanneries<br />
to pig farms have progressively been regulated under IPPC. However, by the time the deadline<br />
<strong>for</strong> full implementation arrived on 30 October 2007, many Member States had fallen well behind<br />
schedule, with only half of IPPC plants permitted in some Member States. Furthermore, sharp differences<br />
were evident in the stringency of implementation, while vague language in the existing<br />
Directive left little scope <strong>for</strong> the Commission to pursue infringement procedures.<br />
The revision incorporated separate sectoral Directives into IPPC, as part of the better regulation<br />
initiative of the European Commission and as a means of achieving more effective, comprehensive<br />
and even implementation. The separate Directives on Large Combustion Plants, Solvents, Waste<br />
Incineration and Titanium Dioxide were introduced into the Directive on Industrial Emissions.<br />
In general, <strong>EEB</strong> welcomes the proposal as a targeted attempt to address gaps in the provisions of<br />
the existing IPPC Directive, which paved the way <strong>for</strong> weak and divergent implementation across<br />
the EU.<br />
The Industrial Emissions Directive 1 needs teeth to address <strong>industrial</strong> pollution and to play its role<br />
in delivering on European objectives to protect our air, water and soils from further degradation.<br />
The <strong>EEB</strong> urges Members of European Parliament to take an objective look at the costs and benefits<br />
of implementing technologies to prevent and control <strong>industrial</strong> pollution, and to vote on the side<br />
of human health and the environment.<br />
In this document, we provide in<strong>for</strong>mation on the key issues under discussion, including the use of<br />
the Best Available Technique Reference Documents (BREFs) in permitting, the safety net, emission<br />
limit values <strong>for</strong> large combustion plants and cement installations, inspection regimes, protecting<br />
soils and intensive farming. We provide key in<strong>for</strong>mation on the associated environmental impacts,<br />
and where available, we present data on costs and benefits of the proposed changes.<br />
The document opens with a reminder of the goals that the Industrial Emissions Directive must help<br />
us to reach.<br />
1 COM (2007) 844 final; Proposal <strong>for</strong> a Directive of the European Parliament and of the Council on <strong>industrial</strong><br />
emissions (integrated pollution prevention and control) RECAST<br />
4
The Goalposts<br />
The proposed Directive on Industrial Emissions is designed to deliver protection of air, water and<br />
soil from <strong>industrial</strong> emissions, as well as limiting waste <strong>production</strong> and improving energy and<br />
resource efficiency in installations. Below are summaries of the key goals to which the Directive is<br />
intended to contribute, together with some statistics on progress towards achieving these goals.<br />
AIR<br />
The Directive on Integrated Pollution Prevention and Control (IPPC) together with a number<br />
of sectoral directives on large combustions plants, waste incineration, solvents and titanium<br />
dioxide currently frame the setting of emission limit values (ELVs) designed to deliver reductions<br />
in anthropogenic emissions to air from <strong>industrial</strong> sources 2 .<br />
Currently, about 52,000 IPPC installations in the EU are responsible <strong>for</strong> 3 :<br />
Emission Health impacts Environmental impacts<br />
83% of SO 2<br />
Asthma, respiratory illness, aggravates heart Acid rain, smog<br />
disease<br />
55% of Volatile<br />
Organic<br />
Compounds<br />
38% of ammonia<br />
(farming only)<br />
Respiratory problems, suspected carcinogen<br />
Irritation of the eyes, nose and throat<br />
Global warming, <strong>for</strong>mation<br />
of ground level ozone and<br />
<strong>for</strong>mation of secondary<br />
particulate matter leading<br />
to eutrophication and<br />
acidification<br />
Eutrophication,<br />
groundwater contamination<br />
34% of NOx<br />
25% of dioxins<br />
23% of mercury<br />
Respiratory illness, emphysema, bronchitis,<br />
increase in mortality<br />
Development defects, cancer, hepatotoxicity,<br />
endocrine disruption, damage to immune<br />
system, death<br />
Neurological damage, renal and gastrointestinal<br />
damage, death<br />
Acid rain, eutrophication,<br />
smog<br />
Bioaccumulates in living<br />
tissues<br />
Bioaccumulates in living<br />
tissues<br />
Total annual damage cost estimate of €53-164 billion<br />
(relating to 5 key pollutants only and excluding wider environmental<br />
damages to ecosystems)<br />
Commission, 2007a, p. 11<br />
2<br />
The list of polluting substances are to be found on Annex II of the proposal. Other polluting substances that<br />
because of their nature and potential to transfer pollution are also subject to measures<br />
3<br />
Data on ammonia from Alterra, 2007, all other data from Commission, 2007a<br />
5
A PUSH FOR CLEANER INDUSTRIAL PRODUCTION<br />
Thematic Strategy emission reduction targets <strong>for</strong> 2020<br />
Nitrogen Oxide, NOx -60% The Thematic Strategy on Air Pollution defines<br />
Sulphur Dioxide, SO 2<br />
-82%<br />
interim air quality objectives <strong>for</strong> 2020 that will<br />
lead to a reduction in negative impacts on human<br />
Ammonia, NH 3<br />
-27%<br />
health and the environment.<br />
EU 27 NEC emission reduction targets <strong>for</strong> 2010<br />
Nitrogen Oxide, NOx -51% The National Emissions Ceilings Directive<br />
Sulphur Dioxide, SO 2<br />
-77%<br />
2001/81/EC sets emission reduction targets<br />
<strong>for</strong> 2010 <strong>for</strong> each Member States, as well as <strong>for</strong><br />
Ammonia, NH 3<br />
-14% the EU-27.<br />
Data on progress towards the interim 2006 NEC targets are now<br />
available. The data shows which countries are overshooting, and<br />
reveals a concerning trend with regards to NOx emissions. (see<br />
table in Annex 1 <strong>for</strong> a cost benefit analysis of two IPPC scenarios<br />
relative to the NEC baseline)<br />
• 18 Member States reported that they were above their 2006<br />
NOx ceiling<br />
• 13 Member States are projected to miss their 2010 nitrogen<br />
oxide ceilings,<br />
• EU emissions predicted to be 9% above the aggregated emission<br />
ceiling and 20% above the stricter EU-27 NECD ceiling<br />
<strong>for</strong> 2010<br />
• 11 Member States exceeded their 2006 SO ceilings<br />
2<br />
• The Netherlands is projected to exceed its 2010 SO ceiling<br />
2<br />
• Germany and Spain are projected to exceed their 2010 NH3<br />
ceilings<br />
Europe is not on track to meet its air targets<br />
NOx emissions against 2006<br />
NEC ceilings, top 10 worst<br />
per<strong>for</strong>ming Member States:<br />
Ireland 74%<br />
Austria 68%<br />
France 68%<br />
Spain 61%<br />
Belgium 58%<br />
Denmark 46%<br />
UK 37%<br />
Germany 33%<br />
Netherlands 30%<br />
Luxembourg 28%<br />
EEA, 2008b, p19<br />
6
WATER<br />
The Water Framework Directive 2000/60/EC aims to achieve both good chemical status and<br />
good ecological status in Europe’s surface waters and groundwater. Environmental quality<br />
standards have been established <strong>for</strong> 33 priority substances with these thresholds intended to act<br />
as a trigger <strong>for</strong> additional point source controls under IPPC, should they be transgressed.<br />
• Many small waterways and some large rivers remain severely polluted<br />
(EEA, 2007a)<br />
IPPC is the key tool <strong>for</strong> controlling point source pollution to European waters by requiring the<br />
application of BAT to reduce the levels of contaminants in waste waters. Should environmental<br />
quality standards <strong>for</strong> priority substances be jeopardised, stricter controls are required.<br />
The Drinking Water Directive 98/83/EC stipulates that nitrate concentrations in drinking water<br />
shall not exceed 50 mg/l. With groundwater serving a crucial source of drinking water in many<br />
Member States, the contamination of groundwater with nitrate is of high concern.<br />
Europe’s waters are contaminated with high levels of nitrates<br />
• Nitrate concentration limits are exceeded in 1/3 of groundwater bodies tested.<br />
No substantial improvement has resulted from current practice<br />
SOIL<br />
(EEA, 2008c)<br />
The Thematic Strategy <strong>for</strong> Soil Protection 4 sets a framework <strong>for</strong> actions to protect further degradation<br />
of Europe’s soils, and includes a proposed Framework Directive on Soil.<br />
In terms of soil contamination at <strong>industrial</strong> sites, both the numbers of sites and the hazardous<br />
chemicals involved generate cause <strong>for</strong> concern.<br />
• 3.5 million sites potentially contaminated<br />
• Industrial <strong>production</strong> and commercial service responsible <strong>for</strong> 41.4% of contamination<br />
• 0.5 million sites seriously contaminated and in need of remediation<br />
(EEA, 2007)<br />
Europe’s soils are not adequately protected and are continuing to degrade.<br />
4<br />
COM (2006) 23;1Thematic Strategy <strong>for</strong> Soil Protection<br />
7
A PUSH FOR CLEANER INDUSTRIAL PRODUCTION<br />
Promoting Innovation<br />
The Problem: An Unlevel Playing Field<br />
To date, implementation of the IPPC Directive has shown widespread divergence across the EU,<br />
both in the level of stringency of the permits and in the percentage of IPPC installations permitted.<br />
Standards in many permits show little relation to Best Available Techniques (BAT) in the BAT<br />
Reference Document (BREF) <strong>for</strong> the relevant sector 5 .<br />
Divergence means an unlevel playing field <strong>for</strong> industry and an uneven level of environmental<br />
protection <strong>for</strong> EU citizens. It means that a plant in one Member State can avoid investment in BAT<br />
in order to gain short term advantage over a competitor in another where permitting is more<br />
rigorous. That advantage comes at the cost of environmental protection, and Europe’s citizens<br />
pay the price.<br />
Aberthaw Coal-fired Power Station, Wales, UK<br />
th<br />
• Europe’s 6 largest point source of NOx<br />
• Granted a derogation from BAT and allowed<br />
to emit 1200 mg/Nm3 of NOx instead of<br />
500 mg/Nm 3<br />
• Current permit conditions only require the<br />
plant to reduce emissions to 200 mg/Nm 3<br />
by 2018<br />
• No plans to implement BAT <strong>for</strong> NOx removal<br />
(SCR)<br />
• Friends of the Earth in the UK, was unable to<br />
pursue the case in court because the BREFs<br />
are <strong>for</strong> guidance only and standards set at<br />
the discretion of the local authority<br />
Situation in the Netherlands<br />
• NOx emissions of existing coal power<br />
plants have been reduced to 25 g/GJ by<br />
a combination of Low-Nox burners and<br />
installation of DeNox.<br />
• E.ON Maasvlakte and NUON Amsterdam<br />
achieve 75 mg/Nm 3 NOx<br />
• Amer-9, an old plant, achieves emissions of<br />
about 100mg/Nm 3<br />
• there is not an existing coal power plant without<br />
DeNox anymore in the Netherlands<br />
5<br />
<strong>for</strong> illustrations see COM, 2007a, p. 17<br />
8
The Solutions<br />
The recast of the IPPC Directive presents a crucial opportunity to reduce that divergence and<br />
create a more level playing field <strong>for</strong> <strong>industrial</strong> operators across the EU. A permitting system that<br />
closely follows the BREFs can send clear, consistent messages to <strong>industrial</strong> operators across the<br />
EU about what they have to achieve as a sector. An operator who is certain that his competitor will<br />
be obliged to invest in environmental protection, will more easily earmark funds <strong>for</strong> his own plant.<br />
The suppliers of relevant techniques will see a stable market <strong>for</strong> their products and innovations,<br />
so boosting eco-industries.<br />
The IPPC permitting system must be consistent, viable and based on BAT. In establishing BAT,<br />
technical experts, including industry, assess the economic and technical feasibility of techniques<br />
available on the market in commercially operating installations. BAT uptake represents an achievable<br />
goal since BAT are defined as “available techniques developed on a scale which allow<br />
implementation under economically and technically viable conditions, taking into consideration<br />
the costs and advantages [...] and that are reasonably accessible to the operator” 6 . The following<br />
new mechanisms are specifically designed to promote uptake:<br />
• The emission limit values in the permit cannot exceed the BAT Associated Emission Levels that<br />
are laid out in the BREF, as set out in Article 16.2 of the Commission proposal.<br />
• Publication of a new BREF must trigger a review of permits issued <strong>for</strong> that sector within two<br />
years instead of four. With BREFs revised every 8 years, the implicit deadline <strong>for</strong> permit review<br />
would be approximately 10 years.<br />
• At least the essential parts of the BREFs, such as the BAT chapters, must be translated into all the<br />
official EU languages. This in order to make them accessible and understandable to competent<br />
authorities and operators on the ground and give them the necessary legal status.<br />
• Each installation must provide an annual report that compares their environmental per<strong>for</strong>mance<br />
with that achievable using BAT. This key tool requires that the operator remains up to date<br />
with BREF requirements and reassesses the installation’s per<strong>for</strong>mance.<br />
• There must be clear links between permit conditions with environmental quality standards and<br />
emission ceilings such as the National Emissions Ceilings under the NEC Directive<br />
Potential Benefits<br />
The European eco-industry (i.e. pollution prevention, control and management) has a turnover of<br />
€227 billion, contributing around 2.2% of total EU GDP. Between 1999-2004 it employed 1.85<br />
million people, more than the European car industry 7 . Regulation is the main driver in the development<br />
of eco-industries, and an increased uptake of BAT would deliver a major boost to this sector<br />
while further consolidating Europe’s position as world leader in environmental technologies.<br />
6<br />
see the unchanged definition in article 3(9) of the proposal<br />
7<br />
Ernst and Young, 2006<br />
9
A PUSH FOR CLEANER INDUSTRIAL PRODUCTION<br />
The Problem: Indiscriminate application of the Inherent Flexibility<br />
Even as these key mechanisms will work to generate a level playing field <strong>for</strong> <strong>industrial</strong> operators, a<br />
number of elements remain that serve to retain much of the flexibility inherent in IPPC.<br />
Range:<br />
The standards in the BREF, the BATAELs, are presented not as a single value<br />
but as a range. In all cases, the range of BATAELs presented in the BREF accounts<br />
<strong>for</strong> the variation expected from commercially operating installations that install<br />
and operate BAT within different technological and environmental contexts. As<br />
shown by the figures below, installations with different per<strong>for</strong>mances can be<br />
accommodated by the BAT range.<br />
Selection of BAT and ELV: Plant A (Spain)<br />
Cost<br />
BAT range<br />
Selection of BAT and ELV: Plant B (Italy)<br />
Cost<br />
BAT range<br />
Investment<br />
Needed<br />
Investment<br />
Needed<br />
Plant A<br />
Plant B<br />
Emission Reduction<br />
Required<br />
ELV<br />
Current<br />
Emission<br />
Emission<br />
Emission Reduction<br />
Required<br />
ELV<br />
Current<br />
Emission<br />
Emission<br />
Excerpt from case study of two aluminium plants operating according to BAT; ALCOA (Aluminium<br />
Industry) EP Lunch Debate May 14th, 2008<br />
Peaks:<br />
Compliance:<br />
Derogations:<br />
BATAELs are presented as emission levels averaged over specific time periods<br />
and are drawn from commercial installations operating under normal conditions.<br />
Normal conditions inevitably include fluctuations in process factors such as input<br />
quality, and as such the BATAELs already account <strong>for</strong> short term peaks in emissions<br />
and are directly transferable to emission limit values in the permits.<br />
Member States have full freedom to determine the regime under which an installation’s<br />
compliance with permit conditions is assessed. Compliance regimes<br />
frequently allow actual emissions to exceed the emission limit values in the<br />
permit under certain circumstances and <strong>for</strong> specific time limits. These regimes<br />
allow <strong>for</strong> some peaks, <strong>for</strong> instance under abnormal operating conditions, and so<br />
provide flexibility to the operator.<br />
Member States retain the flexibility to set permit standards that exceed the<br />
standards in the BREF in exceptional cases based on an assessment of the<br />
environmental and economic costs and benefits, and taking into account the<br />
technical characteristics of the installation, its geographical location and the<br />
local environmental conditions (Article 16.3).<br />
10
The Solution: Playing Fair According to Clear Criteria<br />
The flexibility inherent in IPPC has been applied indiscriminately, leading to a situation where the<br />
innovative effects of BAT-based permitting have not been fully realised. In order to ensure fair play<br />
and guarantee the level playing field, it is essential that all derogations granted must be based<br />
on clear and common parameters and must be part of a transparent permitting process open to<br />
public scrutiny.<br />
• The justification <strong>for</strong> the exceptional derogation must be included in the permit and available<br />
to the public that must be given early and effective opportunities to participate in decisionmaking.<br />
• The criteria by which an exceptional derogation can be granted must be established at community<br />
level by the Commission in order to set clear and common parameters.<br />
11
A PUSH FOR CLEANER INDUSTRIAL PRODUCTION<br />
The Environmental Safety Net<br />
The Problem<br />
Annexes V, VI, VII and VIII of the Industrial Emissions Directive integrate binding minimal emission<br />
limit values (ELVs) <strong>for</strong> large combustion plants, waste incineration and co-incineration plants,<br />
installations and activities using organic solvents and installations producing titanium dioxide.<br />
Regulatory authorities can draw on the BATAEL in the BREF to set emission standards in the permit<br />
that are stricter than these binding ELV, but they cannot be less strict 8 . These standards act as a<br />
safety net to ensure that emission levels do not exceed a certain level.<br />
Practice in permitting these types of installations has shown that the permit conditions are often<br />
based directly on the binding ELVs, with no reference to the BATAEL in the BREF.<br />
In some of the new Member States, authorities rely on the binding standards to guide their<br />
permitting practice, as the case-by-case BAT-based permitting approach demands additional time,<br />
expertise and a philosophy with which they are unfamiliar.<br />
The Solution: A Safety Net extended to all IPPC sectors<br />
The sectoral ELVs there<strong>for</strong>e represent a critical safety net, requiring a bottom line of environmental<br />
per<strong>for</strong>mance below which standards cannot slip. It is there<strong>for</strong>e essential that the level at which ELVs<br />
are set is strict enough to deliver a baseline of environmental protection.<br />
Current practice, where standards in permits<br />
often drawn directly from the binding<br />
sectoral ELVs with no reference to BATAEL<br />
in the BREF, have led to a disconnection<br />
between levels of emissions and those<br />
achievable using BAT.<br />
Setting sectoral ELVs within the BAT range<br />
will serve to ensure that permits deliver a<br />
level of pollution control that is achievable<br />
using techniques that are readily available<br />
on the European market and that have<br />
been successfully applied in commercially<br />
operating installations.<br />
The sectoral ELVs have been instrumental in driving<br />
improvements in UK industry‘s environmental<br />
per<strong>for</strong>mance, after the implementation of IPPC.<br />
• Implementation of the Waste Incineration<br />
Directive NOx ELV of 800 mg/Nm 3 drove<br />
uptake of SNCR at Lafarge’s Hope Aberthaw<br />
and Cauldron cement works and at Castle<br />
Cement’s Ketton works<br />
• Rugby cement replaced upgraded dust control<br />
techniques to comply with Waste Incineration<br />
Directive ELVs<br />
• Implementation of the Large Combustion Plant<br />
Directive <strong>for</strong>ced UK power plants to retrofit<br />
flue gas desulphurisation techniques or operate<br />
at low loads to meet SO 2<br />
emissions ELVs<br />
8<br />
the Dutch administrative court has made clear that sectoral ELVs are only a bottom line, competent authorities<br />
have to refer to BATAEL in the BREF and take them into account. e.g. AB RvS 25 January 2006, 200409; AB<br />
RvS 20 April 2005,200405315/1233/1<br />
12
BAT-based binding ELVs will deliver an additional <strong>push</strong> <strong>for</strong> environmental innovation, and will<br />
ensure that the Directive is consistent in the signals sent to operators. Derogations to standards<br />
below these levels will not be possible and a bottom line of environmental per<strong>for</strong>mance will be<br />
assured.<br />
The following mechanisms will help to ensure that the sectoral ELVs contribute to achieving<br />
the long term objectives of the Thematic Strategy on Air Pollution and the Water Framework<br />
Directive:<br />
• The binding sectoral ELVs should be based on BAT and set within the range of the BATAELs in<br />
the BREF.<br />
This approach will ensure a coherent and consistent BAT-based framework <strong>for</strong> controlling<br />
<strong>industrial</strong> emissions to the environment.<br />
• Following the updating of a BREF, the minimum requirements should be adjusted to reflect<br />
scientific and technical progress within a 12-month period.<br />
This is essential to ensure that the minimum requirements reflect what is technically and<br />
economically feasible in commercially operating installations.<br />
• The safety net should be extended to cover all IPPC sectors. In extending the binding minimal<br />
requirements to cover all sectors, emission limit values may be supplemented by equivalent<br />
parameters of technical measures provided that an equivalent or higher level of environmental<br />
protection can be achieved.<br />
To deliver a baseline of protection to the environment and European citizens.<br />
• Measures designed to update or establish the binding minimum requirements should be<br />
adopted through comitology with scrutiny.<br />
The comitology procedure is much faster than co-decision, geared towards technical<br />
decision-making, and more able to rapidly respond to technological progress.<br />
• Stakeholders representing the public interests should be consulted by the Commission be<strong>for</strong>e<br />
the final decision regarding such measures is made.<br />
In order to make the decision making process open, transparent and increase the confidence<br />
of European citizens.<br />
13
A PUSH FOR CLEANER INDUSTRIAL PRODUCTION<br />
Combustion Plants<br />
The Problem: Dirty and Toxic Air<br />
The latest EEA data clearly shows that we are not on<br />
track to deliver clean air by 2020. Figures <strong>for</strong> NOx<br />
emissions are particularly alarming, with IPPC installations<br />
responsible <strong>for</strong> 34% of the EU NOx emissions.<br />
In fact, only six Member States are responsible <strong>for</strong><br />
70% of these emissions, namely the UK (14.4%),<br />
Germany (12.6%), Spain (12.3%), France (12.3%), Italy (9.8%), and Poland (7.9%) 9 .<br />
Large combustion plants (LCPs) contribute over 90% of <strong>industrial</strong> emissions of NOx and SO 2<br />
10<br />
.<br />
However, BAT uptake is generally low and the emission limit values under the Large Combustion<br />
Plants Directive are well higher than those associated with BAT 11 . Many LCPs have emission levels<br />
that far exceed those achievable using BAT.<br />
In 2006 more than 2 million tonnes of NOx were emitted by the electricity generating LCPs alone.<br />
The Member States featuring as the top 5 polluters <strong>for</strong> 2006 are: UK (19,32%), Poland (13,27%),<br />
Germany (12,33%), Spain (12,13%) and Italy (5,45%). The total average SO 2<br />
emissions between<br />
2004-2006 amount to 5.137 Million tonnes, of which the top five polluters were Spain (18.5%),<br />
Bulgaria (15.1%), Poland (14,7%), Romania (10,3%) and the UK (8,8%) 12 . The UK, Bulgaria, Spain,<br />
Poland, Greece and Romania also operate the ten highest emitters in public electricity generation<br />
13 . See Annex 1 <strong>for</strong> tables outlining details of the EU’s LCPs.<br />
In order to meet the objectives of the Thematic Strategy on Air Pollution, emissions of SO 2<br />
and<br />
NOx from <strong>industrial</strong> installations need to be cut by about 50% by 2020.<br />
9<br />
EEA, 2008b<br />
10<br />
COM2007 a, p 32<br />
11<br />
Commission, 2007a<br />
12<br />
ENTEC, 2008, table 4.12 and 4.15<br />
13<br />
ibid, table 4.16 and 4.17<br />
14
The Solution: Applying BAT(Example of NOx)<br />
Emissions reductions achieved through the application of BAT to LCPs<br />
will be the main element in achieving the objectives of the Thematic<br />
Strategy on Air Pollution. For coal-fired power plants BAT <strong>for</strong> reducing<br />
NOx emissions includes a number of primary and secondary measures<br />
(SCR and SNCR). SNCR and the more advanced SCR have been successfully<br />
applied to reduce NOx from <strong>industrial</strong> installations <strong>for</strong> over a<br />
decade and can reduce NOx emissions by 80-90% respectively.<br />
BAT <strong>for</strong> SO 2<br />
reduction includes using low-sulphur fuel coupled with the<br />
wet scrubber or the spray dry scrubber desulphurisation 14 .<br />
Typical costs <strong>for</strong><br />
the installation and<br />
operation of SCR:<br />
€ 0.5-1 per kg NOx<br />
Yara, 2008<br />
€1.5-2.5 per kg NOx<br />
LCP BREF, 2006<br />
Key mechanisms to promote BAT uptake<br />
by LCPs include:<br />
• Setting the LCP ELVs at the lower end<br />
of BATAELs<br />
• An implementation deadline of 2014<br />
<strong>for</strong> sectoral emission limit values <strong>for</strong><br />
LCPs<br />
• Do away with the NERP since it results<br />
in lower emission reductions than<br />
plant by plant ELVs<br />
• Rigorous en<strong>for</strong>cement<br />
• A level playing field<br />
National Emission Reduction Plans (NERP) allow<br />
<strong>for</strong> LCP Directive compliance across a whole sector<br />
or sub-sector within a Member State, rather than at<br />
the level of each individual plant. They have been<br />
applied to the LCP sector in the UK.<br />
The Commission’s IED proposal removes the option<br />
<strong>for</strong> using a NERP based on evidence of a lack<br />
of success in reducing emissions.<br />
A UK study investigating future scenarios found<br />
that the use of a NERP in the UK would result in<br />
significantly lower emissions reductions <strong>for</strong> NOx,<br />
SO 2<br />
and dust. (ENTEC 2008,DEFRA study).<br />
Brindisi Federico II plant, Puglia, Italy<br />
• SCR installed in 1998<br />
• World largest coal, fuel and orimulsion<br />
power plant<br />
• Consumes 6 million tons of coal every year<br />
3<br />
• NOx emissions 170 mg/m<br />
Enel, 2006<br />
Electrabel plant, Ruien, Belgium<br />
• Was one of Europe’s worst polluters<br />
• SCR installed in 2004<br />
• NOx emissions down by 70%<br />
Electrabel, 2006<br />
14<br />
Large Combustion Plants BREF, 2006<br />
15
A PUSH FOR CLEANER INDUSTRIAL PRODUCTION<br />
Country<br />
Top 20 NOx producing point sources in the EU-27<br />
Site<br />
Capacity<br />
(MWe)<br />
Current emissions<br />
estimate<br />
(kilotonnes)<br />
Emissions<br />
estimate using<br />
BAT (kt)<br />
UK Drax 3960 58 7<br />
Poland Belchatow 4,340 40 2<br />
Bulgaria Maritsa II 1,450 39 2<br />
Spain Compostilla 1,312 35 2<br />
Spain Teruel 1,050 31 2<br />
UK Aberthaw 1,425 24 1<br />
Portugal Sines 1,256 23 2<br />
UK Ratcliffe 2,000 23 3<br />
UK West Burton 2,000 23 2<br />
Bulgaria Maritsa III 840 23 2<br />
Spain La Robla 620 23 1<br />
UK Cottam 2,008 22 3<br />
Greece Dimitrios 1,570 22 3<br />
Spain Velilla - 21 -<br />
UK Kingsnorth 1,455 20 2<br />
Ireland Moneypoint 915 20 2<br />
Greece Kardia 1,200 20 1<br />
UK Ferrybridge 1,470 20 2<br />
Romania Turceni 2,310 20 1<br />
UK Longannet 2,400 19 2<br />
Source: The Swedish NGO Secretariat on Acid Rain/European Environmental Bureau, 2008<br />
300<br />
250<br />
200<br />
150<br />
100<br />
Overview of 2006 LCP per<strong>for</strong>mance vs. LCP Directive ELV and BATAELs <strong>for</strong> NOx<br />
LCPD<br />
50<br />
0<br />
Biomass<br />
Other Solid Fuels<br />
Liquid Fuels<br />
Natural Gas (excl.<br />
GTs)<br />
Natural Gas (GTs)<br />
Biomass<br />
Other Solid Fuels<br />
Liquid Fuels<br />
Natural Gas (excl.<br />
GTs)<br />
Natural Gas (GTs)<br />
Biomass<br />
Other Solid Fuels<br />
Liquid Fuels<br />
Natural Gas (excl.<br />
GTs)<br />
Natural Gas (GTs)<br />
Biomass<br />
Other Solid Fuels<br />
Liquid Fuels<br />
Natural Gas (excl.<br />
GTs)<br />
Natural Gas (GTs)<br />
Number of LCPs<br />
50-100MWth<br />
100-300MWth<br />
300-500MWth<br />
>500MWth<br />
16<br />
Source: ENTEC, 2008, Evaluation of the Member States’ emission inventories 2004-2006 <strong>for</strong> LCPs under the LCP<br />
Directive (2001780/EC), September 2008, Figure 4.27
Potential Benefits<br />
The benefits of applying BAT to Europe’s LCPs outweigh the costs from at least three-to-one (low<br />
estimate) and ten-to-one (high estimate). This evaluation does not include damages to ecosystems<br />
because it is not possible at this time to adequately calculate an economic value <strong>for</strong> them. The<br />
European Environment Agency has found that applying the stricter end of the BATAELs to the<br />
top 450 large combustion plants would reduce <strong>industrial</strong> emissions of NOx by 87% and SO 2<br />
by<br />
97% 15 . The greatest potential <strong>for</strong> reduction lies with coal-fired power plants. The table below gives<br />
an indication of the emissions reduction potential and the associated health benefits and costs to<br />
industry if the uptake of BAT by large coal-fired power plants increased by 40%:<br />
Annual emissions reductions 260,000 tonnes of NOx p/a 8,000 tonnes of NOx p/a<br />
Health benefi ts € 2.2 billion p/a € 600 million p/a<br />
Costs of implementing BAT € 600 million p/a € 160 million p/a<br />
Net benefi t of installing BAT € 1.6 billion p/a € 440 million p/a<br />
EU mercury emissions would fall by 2 tonnes per year<br />
The health benefits to citizens from <strong>cleaner</strong> air are at least three to ten times greater<br />
than the costs to polluters of implementing BAT.<br />
ENTEC, 2007<br />
NOx<br />
Dust<br />
Commission estimates of total benefits:<br />
• Net environmental and health benefits of €7–28 billion per year <strong>for</strong> least strict level of BAT<br />
and € 14-59 billion per year <strong>for</strong> stricter BAT range 16<br />
• Reduction in acute mortality deaths by 21,000 chronic mortality by 243,000 and infant<br />
mortality by 360<br />
17<br />
• Reduce years of life lost by 125,000 and 270,000 from impact of PM<br />
15<br />
EEA, 2008a<br />
16<br />
AEAT 2007a,p.6<br />
17<br />
Commission, 2007b, AEAT 2007a,p.20<br />
17
A PUSH FOR CLEANER INDUSTRIAL PRODUCTION<br />
The Solution: Small Combustion Installations under IPPC<br />
Another solution to current high levels<br />
of NOx is to broaden the scope of IPPC<br />
to capture small combustion installations<br />
with a capacity of less than 50<br />
MW. This will bring IPPC in line with the<br />
EU Greenhouse Gas Emissions Trading<br />
Directive and require these installations<br />
to apply <strong>for</strong> BAT-based permits. Many of<br />
these installations are already covered<br />
Contribution to total <strong>industrial</strong><br />
emissions<br />
Potential reductions with application<br />
of best per<strong>for</strong>ming<br />
abatement measures<br />
AEAT, 2007a, Table 5.3, Table 5.2<br />
NOx SO 2<br />
PM<br />
25% 10% 15%<br />
83% 95% 95%<br />
by permitting regimes at the national level, thus competent authorities are already engaged and<br />
additional administrative costs would be limited. The extension would serve to level the playing<br />
field <strong>for</strong> <strong>industrial</strong> actors relying on on-site energy generation.<br />
Potential Benefits<br />
In a scenario where small combustion installations implement best per<strong>for</strong>ming abatement measures,<br />
potential benefits include significant reductions in key pollutants. Estimated health benefits<br />
could then be in the range of € 2.6 billion per year (without including environmental benefits), at<br />
an estimated cost to industry of € 989 million (AEAT, 2007a).<br />
Estimated net benefit is €1.6 billion per year.<br />
18
Co-Incinerating Waste<br />
The Problem: Perverse Incentives and Impacts on Health<br />
“..the pursuit of profit in waste management should<br />
under no circumstances lead to compromises on the<br />
environmental profile of waste treatment.”<br />
IPTS, 1999<br />
The playing field <strong>for</strong> <strong>industrial</strong> installations incinerating waste is uneven, and generates perverse<br />
incentives that lead to higher emissions of nitrogen oxides to the air. Weaker standards <strong>for</strong> cement<br />
kilns make it cheaper <strong>for</strong> a cement kiln to burn waste. This generates a perverse incentive<br />
to incinerate waste in poorly per<strong>for</strong>ming cement kilns and results in higher emissions of nitrogen<br />
oxides.<br />
The recast process offers the opportunity to correct this imbalance. The emission limit values in<br />
Annex VI are to be revised and it is critical that they be brought in line with the BAT Associated<br />
Emission Limit Values in the BREF.<br />
The Solution: SNCR and SCR<br />
Technologies that enable cement installations<br />
to reduce their nitrogen oxide emissions are<br />
readily available on the market and have been<br />
successfully installed in commercially operating<br />
installations.<br />
Industry cost estimates <strong>for</strong> the installation of<br />
NOx abatement techniques<br />
SNCR<br />
SCR<br />
€ 358 per tonne NOx removed<br />
€ 946 per tonne NOx removed<br />
Scur and Hoppe, 2006<br />
The most commonly used abatement technique, selective non-catalytic reduction techniques<br />
(SNCR) can reduce emissions by 75% to 200-500mg/Nm 3 .<br />
BREF NOx emission limit values <strong>for</strong> cement<br />
installations:<br />
Installations with SNCR 200-500mg/Nm 3<br />
Installations with SCR 100-200mg/Nm 3<br />
Cement and Lime BREF, 2001<br />
The more advanced selective catalytic reduction<br />
techniques (SCR) can bring emissions<br />
down to 50mg/Nm 318 , achieving emissions<br />
reductions of 90% or more. SCR techniques<br />
also serve to reduce emissions of other key<br />
pollutants, namely carbon monoxide, VOC,<br />
dioxins and furans.<br />
SCR is more cost-effective than SNCR in delivering a multi-pollutant control strategy 19 .<br />
ELVs <strong>for</strong> NOx <strong>for</strong> the cement sector should be set at the lower end of the BATAELs,<br />
200 mg/Nm 3<br />
18<br />
Revised lime BREF<br />
19<br />
Neuffer and Laney, 2007<br />
19
A PUSH FOR CLEANER INDUSTRIAL PRODUCTION<br />
Cementa AB Sweden achieves 80-85%<br />
NOx emission reductions with SNCR in two<br />
installations, Skövde and Slite<br />
3<br />
• Nitrogen oxide emissions less than 200mg/Nm<br />
• Stable functioning over a prolonger period<br />
• Total cost of NOx abatement: 250 €/t of NOx.<br />
Junker and Lynberg, 2007<br />
Cementeria di Sarche di Calavino<br />
successfully installs SCR technique in<br />
2007<br />
Reductions in nitrogen oxide <strong>for</strong>eseen<br />
Italcementi Group, 2008<br />
Progressive Member States have already acted to protect their citizens by imposing stricter emissions<br />
standards <strong>for</strong> nitrogen oxides through establishing general binding rules. There are cement<br />
installations successfully operating with emissions below 200 mg/Nm 3 in Italy and Sweden.<br />
Germany has set 200 mg/Nm 3 <strong>for</strong> new and substantially changed co-incineration cement kilns<br />
after 2012 as well as <strong>for</strong> existing kilns when combustion is based on 100% waste.<br />
NOx Emission Limits <strong>for</strong> Cement Installations in<br />
Progressive Member States<br />
Germany<br />
>60% waste<br />
incineration<br />
100% waste<br />
incineration<br />
500 mg/Nm 3<br />
200 mg/Nm 3<br />
Sweden 200 mg/Nm 3<br />
Cementeria di Monselice cuts nitrogen oxide<br />
emissions with SCR<br />
• Nitrogen oxide emissions less than 200mg/<br />
Nm 3<br />
• Nitrogen oxide removal efficiencies of 97%<br />
• SCR is a “cost effective multi-pollutant control<br />
strategy”<br />
Linero, Bellin and Lieibacher, 2006 and<br />
Linero, Leibacher and Bellin, 2007<br />
The application of SCR to NOx emission<br />
reduction in the cement industry has been<br />
successfully tested in Austria, Italy, Sweden<br />
and Germany.<br />
Results of a successful pilot plant trails in<br />
Kirchdorf,<br />
Upper Austria resulted in NOx emission levels<br />
of 100-200 mg/Nm 3 .<br />
Kossina, 2001<br />
Solnhofen Portland Zementwerke AG (SPZ)<br />
conducted trials with SCR<br />
3<br />
• NOx emissions reduced to 200 mg/Nm<br />
• 90% NOx reduction rates achieved<br />
• additional reductions in ammonia<br />
• Cost effective and economical<br />
Stuttgart, 2007<br />
Bolwerk et al., 2006<br />
20
Potential Benefits<br />
Implementing SCR techniques in the cement industry is a low-hanging fruit that can deliver significant<br />
environmental and health benefits. Setting NOx emission limit values at 200mg/Nm 3 will promote<br />
uptake of the more advanced SCR techniques and in doing so maximize reductions in nitrogen oxide<br />
emissions. Additional environmental benefits include reductions in emissions of volatile organic compounds,<br />
dioxins and furans.<br />
If just 40% of cement plants implement BAT as defined in the BREF:<br />
High end of BATAELs Low end of BATAELs<br />
Annual emissions reductions 29,000 tonnes of NOx p/a 57,000 tonnes of NOx p/a<br />
Health benefi ts of NOx reduction € 330 million p/a € 660 million p/a<br />
Costs of implementing BAT € 15 million p/a € 30 million p/a<br />
Net benefi t of installing BAT € 315 million p/a € 630 million p/a<br />
Estimated net benefits € 630 million per year<br />
ENTEC, 2007<br />
21
A PUSH FOR CLEANER INDUSTRIAL PRODUCTION<br />
En<strong>for</strong>cement<br />
The Problem<br />
Site inspections are key tools <strong>for</strong> ensuring compliance with IPPC. However, the current IPPC<br />
Directive contains no concrete obligations with regards to inspections and as a result there is a<br />
wide divergence across Member States in terms of the policies and practices in inspecting <strong>industrial</strong><br />
sites and ensuring compliance 20 . In particular, in some of the new Member States planning<br />
is only now underway <strong>for</strong> the establishment of inspection systems. Although Recommendation<br />
2001/331 provides minimum criteria <strong>for</strong> environmental inspections (RMCEI) 21 , it is not legally<br />
binding and not specific to IPPC installations.<br />
Inspections are a prerequisite in order to assess<br />
compliance and enable competent authorities<br />
to detect leaks or malfunctions of abatement<br />
equipment. Where non-compliance goes undetected<br />
at an <strong>industrial</strong> site, the consequences can<br />
be devastating.<br />
Potential cost of non-compliance:<br />
• 10% exceedence of SO ELVs <strong>for</strong> 1 year<br />
2<br />
• additional 100 tonnes of SO2<br />
• € 0.6-1.6 million<br />
Commission, 2007a<br />
The Solution<br />
In order to minimise administrative cost and encourage compliance, inspection frequencies<br />
should be tailored to reflect the compliance record of the installation, the implementation of<br />
environmental management systems (EMAS), and the risks associated with the activities.<br />
Annual inspections<br />
Compliant low-risk installations with EMAS<br />
2 random inspections per year General case<br />
3 random inspections per year Installations where a breach has been detected<br />
Additional costs <strong>for</strong> a minimum frequency of 1 inspection per year <strong>for</strong> all installations are estimated<br />
at about €18 million per year. Considering that currently 52.000 installations are covered by IPPC<br />
that would represent about € 350 per year per installation.<br />
In addition, <strong>industrial</strong> operators should provide an annual report on their compliance with permit<br />
conditions and their per<strong>for</strong>mance against the range of BAT in the BREF. This will provide valuable<br />
in<strong>for</strong>mation to the authorities on how the per<strong>for</strong>mance of the installation compares with other<br />
similar installations. Such a report can be streamlined with other reporting obligations, <strong>for</strong> example<br />
<strong>for</strong> the European Pollutant Release and Transfer Register (E-PRTR) and under EMAS. In addition,<br />
this in<strong>for</strong>mation can then be brought into the Sevilla Process when updating the BREFs.<br />
20<br />
IMPEL, 2007<br />
21<br />
Recommendation of the European Parliament and of the Council of 4 April 2001 providing <strong>for</strong> minimum<br />
criteria <strong>for</strong> environmental inspection in the Member States, 2001/331/EC<br />
22
Sevilla Process and BREFs:<br />
The BREFs are high quality technical documents developed by technical experts in a<br />
multi-stakeholder group<br />
• Participants include representatives from Member States, industry and non-governmental<br />
organisations promoting environmental protection<br />
• Much of the data upon which decisions are based is submitted by industry, which has<br />
significant influence over the final BREF document and the BATAELs therein<br />
• The BREF set the European benchmark <strong>for</strong> environmental per<strong>for</strong>mance and are used<br />
worldwide<br />
• Developing one BREF costs €5-10 million, about €150-300 million over 1997-2007<br />
(Commission, 2007a)<br />
The Benefits<br />
Such a system will ensure that breaches are quickly detected and that impacts on the environment<br />
and human health are minimised. It enhances the prevention of pollution and is based on the<br />
polluter pays principle. It will also serve to foster an ongoing dialogue between operators and<br />
permitting authorities on BAT.<br />
In addition, public confidence in the safety of <strong>industrial</strong> installations will be bolstered.<br />
23
A PUSH FOR CLEANER INDUSTRIAL PRODUCTION<br />
Soil and Groundwater<br />
The Problem: Contamination<br />
There are an estimated 3.5 million <strong>industrial</strong> sites in the<br />
EU that are potentially contaminated, 500,000 of which<br />
are thought to be seriously contaminated and in need of<br />
remediation 22 . The estimated annual social cost of soil<br />
contamination is between €2.4 and €17.3 billion, with<br />
most of these costs borne by tax payers, rather than<br />
by the polluters. Industrial activities, including waste<br />
management, are the most significant cause of soil contamination<br />
in the EU. At <strong>industrial</strong> and commercial sites<br />
handling losses, leakages from tanks, pipelines, on-site<br />
landfills and accidents are the most frequent causes of<br />
In 2004, contaminated soil made up 45%<br />
of hazardous waste treated in Ireland due<br />
to redevelopment of brownfield sites<br />
soil and groundwater contamination, with the chemical and metal working industries, energy<br />
<strong>production</strong>, and the oil industry being the greatest contributors 23 .<br />
As a result of soil contamination, people may be exposed to hazardous substances at the workplace,<br />
as neighbours to <strong>industrial</strong> sites through wind dispersion of contaminated soil particles,<br />
and at redeveloped sites that have not been adequately remediated. While is it positive that<br />
brownfield sites are redeveloped to reduce urban sprawl, it is critical that all contamination is<br />
addressed. Groundwater is contaminated through leaching and leakages leading to degradation<br />
in the chemical status of European groundwater. Groundwater is a key source of drinking water<br />
in many European countries, and its contamination requires costly treatment to make the water fit<br />
<strong>for</strong> human consumption.<br />
The latest Presidency’s proposal <strong>for</strong> a Soil Framework Directive does not propose remedies to<br />
this problem. There is no obligation to de-pollute the soil, nor is there any frequency requirement<br />
<strong>for</strong> monitoring. The outcome of this piece of legislation is uncertain, however it is not expected<br />
that it will set specific requirements on the cessation of activities from IPPC installations or on the<br />
monitoring of soil and groundwater (also because of the legal nature of Framework Directives).<br />
22<br />
Commission, 2006<br />
23<br />
EEA, 2007<br />
24
The Solution: Baseline Reports<br />
The remediation of contaminated soil begins with the identification of sites posing dangers to<br />
human health and the environment. In addition, where contamination is found, <strong>industrial</strong> operators<br />
must take action to identify the source and prevent emissions. Where soil is only tested at<br />
site closure, severe contamination of soil and groundwater and associated impacts on human<br />
health may already have occurred. Requirements under the Industrial Emissions Directive should<br />
complement the aims of the proposed Soil Directive by generating an in<strong>for</strong>mation baseline on the<br />
levels of contamination at <strong>industrial</strong> sites. Key mechanisms include:<br />
• A baseline report on soil and groundwater, including<br />
quantified in<strong>for</strong>mation<br />
• Monitoring of groundwater and soil quality at least<br />
every five years respectively<br />
• Upon cessation of activities, operators must return<br />
the site to the state established in the baseline report<br />
Estimated costs per sites<br />
Soil monitoring:€1,300 to 4,900<br />
Baseline report:€ 5,000-10,000<br />
Commission, 2007a<br />
The Benefits<br />
• The baseline report will clarify the status of soil and groundwater and, in the case of contamination,<br />
serve as an in<strong>for</strong>mation basis <strong>for</strong> identifying liability<br />
• Periodic monitoring will allow <strong>for</strong> the early detection of contamination, reducing remediation<br />
costs and associated impacts on human health and the environment<br />
• Industrial operators will be obliged to clean up and pay <strong>for</strong> the soil and groundwater pollution<br />
that has resulted from their activities<br />
25
A PUSH FOR CLEANER INDUSTRIAL PRODUCTION<br />
Intensive Farming<br />
The Problem: Excess Nutrient Loads<br />
Eutrophication due to excessive nutrient loads<br />
leads to algal growth, low oxygen, fish kills,<br />
and eventually a major decline in biodiversity.<br />
Pig and poultry farming continues to expand, with a trend towards concentrated farming generating<br />
high volumes of manure on a daily basis. Spreading manure on land without adequate<br />
techniques causes negative environmental impacts on the quality of nearby waters, soil and air.<br />
The impact relates to the high nutrient load of manure, and the loss of nitrogen and phosphorous<br />
through evaporation, leaching and conversion.<br />
Agriculture contributes to approximately 64% of the nitrogen load to surface waters 24 . Nutrient<br />
leaching causes eutrophication of waters and is common on lands that have been agriculturally<br />
employed <strong>for</strong> decades, since the soil is already saturated with nutrients. Excessive application of<br />
manure reduces soil quality and increases run-off, so exacerbating eutrophication. Nitrogen seriously<br />
degrades the quality of surface and groundwater, making it unfit <strong>for</strong> use as drinking water.<br />
The Drinking Water Directive 98/83/EC stipulates that nitrate concentrations in drinking water<br />
should not exceed 50 mg/l. However, results from the European Environment Agency indicate<br />
that concentration limits are exceeded in 1/3 of groundwater bodies, with trends towards a<br />
continued degradation of our water resources 25 . In Western Europe the mean nitrate concentrations<br />
in groundwater are above the Drinking Water Guide level (> 25 mg/l). There is a high and<br />
stagnant level of nitrate in European groundwater, with levels described as stable to increasing 26 .<br />
The map below identifies those areas where the maximum nitrate concentrations are exceeded<br />
in groundwater.<br />
24<br />
Commission, 2007c<br />
25<br />
EEA, 2003<br />
26<br />
EEA, 2008c<br />
26
Source: Commission, 2007, “Report from the<br />
Commission to the Council and the European<br />
Parliament On implementation of Council Directive<br />
91/676/EEC concerning the protection of waters against<br />
pollution caused by nitrates from agricultural sources<br />
<strong>for</strong> the period 2000-2003,” COM (2007) 120 Final<br />
27
A PUSH FOR CLEANER INDUSTRIAL PRODUCTION<br />
The nitrogen application rate of 170 ka/ha is<br />
exceeded in Belgium, the Netherlands, Italy,<br />
France, Spain and Portugal 27 . As a result of<br />
high domestic nitrogen emissions and input<br />
from rivers draining agricultural lands in other<br />
countries, the Netherlands has the highest<br />
nitrogen surplus in the EU, at 319 kg/ha 28 .<br />
Concentrations of nitrogen and phosphorous<br />
in Dutch coastal waters exceed natural values<br />
by a factor of 5-10, causing frequent algae<br />
blooms, and covering North Sea Beaches with<br />
foam 29 .<br />
Up to 65% of available nitrogen can be lost<br />
to the air as ammonia from farm yard manure<br />
left on the soil surface following application.<br />
MAFF, 1999<br />
Gaseous ammonia causes considerable nuisance<br />
to local residents and upsets the nutritional<br />
balance of surrounding ecosystems.<br />
NH 3<br />
is also a greenhouse gas contributing to<br />
climate change.<br />
The Solution: Applying BAT to Spreading of Manure<br />
BAT <strong>for</strong> the spreading of manure involves following management principles, as well as using particular<br />
equipment (injection or band-spreading and incorporation within 4 hours <strong>for</strong> pig manure<br />
and incorporation within 12 hours <strong>for</strong> poultry manure).<br />
Management principles<br />
<strong>for</strong> spreading manure:<br />
• Balance volume<br />
applied with plant<br />
needs<br />
• Consider soil<br />
characteristics<br />
• Apply to dry land<br />
• Do not apply to slops<br />
• Do not apply close to<br />
watercourses<br />
• Time application with<br />
plant growth<br />
Denmark has successfully introduced controls on manure application<br />
and significantly reduced nitrogen losses from agriculture.<br />
• 31% reduction in the nitrogen surplus, 1990-2003<br />
Kronvang et al., 2008<br />
27<br />
Commission, 2007c<br />
28<br />
BREF <strong>for</strong> Intensive Rearing of Poultry and Pigs, 2003<br />
29<br />
Erisman et al, 2005<br />
28
The Solution: A Differentiated Threshold <strong>for</strong> Inclusion under IPPC<br />
Current IPPC thresholds <strong>for</strong> the inclusion of intensive farming installations exclude 80% of pigs and<br />
40% of poultry. There is a huge difference in the volumes of manure produced by different species<br />
of poultry. The more intensive the <strong>production</strong>, the more risk of negative impacts from the manure.<br />
The Alterra 2007 study calculated thresholds <strong>for</strong> poultry using those <strong>for</strong> <strong>production</strong> pigs (>30kg)<br />
as a basis with an assumed mean N excretion rate of 11 kg per animal per year. There<strong>for</strong>e the IPPC<br />
threshold is fixed at 22,000 kg N p.a. per installation, leading to following poultry thresholds:<br />
Broilers 36,000 Production pigs 2,000 (reference threshold)<br />
Laying hens 37,000 Turkeys 10,000<br />
Ducks 22,000<br />
Benefits<br />
Reducing the nutrient load and applying BAT to spreading manure will:<br />
• reduce NH emissions by 50-60 kt per year at a cost of € 6,000 per tonne and provide <strong>for</strong><br />
3<br />
appropriate management of nitrogen<br />
Differentiated thresholds <strong>for</strong> poultry would<br />
reduce NH emissions by at least 10kt per year at cost of € 1,000 per tonne30<br />
•<br />
3<br />
• will also ensure that all poultry installations having similar environmental impacts are regulated<br />
under IPPC, whatever the species being reared<br />
30<br />
Commission, 2007a<br />
29
A PUSH FOR CLEANER INDUSTRIAL PRODUCTION<br />
Summary of Solutions<br />
Problem: Unlevel playing field and inadequate progress towards environmental objectives in the<br />
Thematic Strategies on Air Pollution and on Soil Protection and the Water Framework<br />
Directive<br />
Solutions: • ELVs in the permit within the BAT range in the BREF<br />
• Derogation only in exceptional case and publicly justified. The public must be involved<br />
in the decision making process<br />
• Criteria <strong>for</strong> derogations established by the Commission<br />
• BREF publication triggers permit review within 2 years<br />
• clear link between permits and environmental quality standards such as NEC<br />
• Translate at least the BAT chapters of the BREFs into all European languages<br />
• Annual report comparing per<strong>for</strong>mance with BAT<br />
Problem:<br />
Solutions:<br />
Problem:<br />
Solutions:<br />
Problem:<br />
Solution:<br />
Problem:<br />
Solutions:<br />
Problem:<br />
Solutions:<br />
Problem:<br />
Solutions:<br />
Sectoral ELVs are not linked to BAT in the BREF leading to inconsistent permitting<br />
• Sectoral ELVs are providing a bottom line environmental protection, but must be in the<br />
BAT range<br />
• ELVs to be updated through comitology following BREF review and require public consultation<br />
be<strong>for</strong>e final decision is reached<br />
• Extend safety net within 12 months of adoption of relevant BREF with the aim of covering<br />
all IPPC sectors<br />
Nitrogen oxide emissions over emission ceilings in 18 Member States<br />
• ELVs <strong>for</strong> combustion plants must be fixed at the stricter BAT range<br />
• Implementation deadline of 2014<br />
• No more NERPs<br />
• Include smaller combustions plants<br />
Unlevel playing field <strong>for</strong> waste incinerators and perverse incentives to emit more nitrogen<br />
oxide<br />
3<br />
• Implement SCR techniques and set ELVs <strong>for</strong> the cement sector at 200mg/Nm<br />
Lack of systematic and targeted inspections in all Member States<br />
• Implement minimum of one annual inspection<br />
• Risk and per<strong>for</strong>mance-based inspection frequency<br />
• Annual operator report on compliance<br />
Contaminated soil and groundwater<br />
• Require detailed baseline report on soils and groundwater<br />
• 5 yearly monitoring of soil and groundwater quality<br />
• Upon cessation of activities, operators must return site in baseline condition<br />
Eutrophication of lakes and nitrate thresholds exceeded in drinking water sources<br />
• Apply BAT to manure and slurry off-site spreading<br />
• Lower and differentiated thresholds <strong>for</strong> poultry installations according to N excretion<br />
factor<br />
30
References<br />
AEAT, 2004, “Costs and environmental effectiveness of options <strong>for</strong> reducing air pollution from<br />
small-scale combustion installations,” Final report to the European Commission, AEA Technology,<br />
November 2004<br />
AEAT, 2007a, Assessment of the benefits and costs of the potential application of the IPPC Directive<br />
(96/61/EC) to <strong>industrial</strong> combustion installations with 20-50 MW rated thermal input, Final report<br />
<strong>for</strong> the European Commission, AEA Technology, October 2007<br />
AEAT, 2007b, Evaluation of the costs and benefits of the implementation of the IPPC Directive on<br />
Large Combustion Plant, AEA Technology, July 2007<br />
Alterra, 2007, Impact assessment of a possible modification of the IPPC Directive as regards intensive<br />
livestock rearing (part of a project on integrated measures in agriculture to reduce ammonia<br />
emissions carried out by the consortium Alterra, Wageningen UR, EuroCare, University of Bonn<br />
and A&F, Wageningen UR), June 2007<br />
IPTS, 1999, “The incineration of waste in Europe: issues and perspectives,” Institute <strong>for</strong> Prospective<br />
Technological Studies, Sevilla<br />
Commission, 2006, “Impact Assessment of the Thematic Strategy on Soil Protection,” Commission<br />
Staff Working Document, SEC(2006) 620<br />
Commission, 2007a, “ Impact Assessment of the Proposal <strong>for</strong> a Directive of the European<br />
Parliament and of the Council on <strong>industrial</strong> emissions,” Commission Staff Working Document,<br />
SEC(2007) 1679<br />
Commission, 2007b, “Communication from the Commission to the Council, the European<br />
Parliament, the Economic and Social Committee and the Committee of the Regions, Towards an<br />
improved policy on <strong>industrial</strong> emissions,” Commission, COM(2007) 843 final<br />
Commission, 2007c, “Report from the Commission to the Council and the European Parliament<br />
On implementation of Council Directive 91/676/EEC concerning the protection of waters against<br />
pollution caused by nitrates from agricultural sources <strong>for</strong> the period 2000-2003,” Commission,<br />
SEC(2007)339<br />
EEA, 2003, “Europe’s Environment: the third assessment,” Environmental assessment report No.<br />
10, European Environment Agency, Copenhagen, Denmark<br />
EEA, 2007a, “Europe’s Environment: the fourth assessment,” State of the environment report No<br />
1/2007, European Environment Agency, Copenhagen, Denmark<br />
EEA, 2007b, “Progress in the management of contaminated sites,” EEA core-set indicator no 15.,<br />
European Environment Agency, Copenhagen, Denmark<br />
EEA, 2008a, “NEC Directive status report 2007 Reporting by the Member States under Directive<br />
2001/81/EC of the European Parliament and of the Council of 23 October 2001 on national<br />
emission ceilings <strong>for</strong> certain atmospheric pollutants,” EEA Technical report No. 9/2008, European<br />
Environment Agency, Copenhagen, Denmark<br />
31
A PUSH FOR CLEANER INDUSTRIAL PRODUCTION<br />
EEA, 2008b, “Indicator Fact Sheet, WEU1 Nitrate in groundwater,” European Environment Agency,<br />
Copenhagen, Denmark<br />
EEA, 2008c, “Air pollution from electricity-generating large combustion plants: An assessment of<br />
the theoretical emission reduction of SO 2<br />
and NOX through implementation of BAT as set in the<br />
BREFs,” EEA Technical report No. 4/2008, European Environment Agency, Copenhagen<br />
Electrabel, 2006, “Annual Report,” Electrabel, Belgium, http://www.electrabel.com/finance/<br />
annual_report/documents/mmvi_ac5vi5esreport_en.pdf#page_1<br />
Enel, 2006, “Sustainability Report,” ENEL, Italy, hip://www.enel.it/azienda_en/Sostenibilita/<br />
bilanci_sostenibilita/doc/2006_BdS.pdf<br />
ENDs, 2005, Environmental Data Services Ltd., UK, ENDS Report, No. 370, pp.15-16,<br />
ENTEC, 2007, Assessment of options to streamline legislation on <strong>industrial</strong> emissions and analysis<br />
of the interactions between the IPPC Directive and possible emission trading schemes <strong>for</strong> NOx<br />
and SO 2<br />
, June 2007<br />
ENTEC, 2008, Evaluation of the Member States’ emission inventories 2004-2006 <strong>for</strong> LCPs under<br />
the LCP Directive (2001780/EC), September 2008<br />
ENTEC/DEFRA 2008 “Phase 1 of the impact Assessment of Proposals <strong>for</strong> a Revised IPPC Directive,<br />
Part 1: Combustion plants” DEFRA, May 2008<br />
Erisman, J.W., Domburg, P., de Haan, B.J., de Vries, W., Kros, J. and Sanders, K., “The Dutch<br />
Nitrogen Cascade in the European Perspective,” 2005, VROM<br />
Ernst and Young, 2006, “Eco-industry, its size, employment and barriers to growth in an enlarged<br />
EU,” Final report to the European Commission, August 2006<br />
Bolwerk, R., Ebertsch, G., Heinrich, M., Plickert, S. and Oerter, M., “German Contribution to<br />
the Review of the Reference Document on Best Available Techniques in the Cement and Lime<br />
Manufacturing Industries,” June 1, 2006<br />
IMPEL, 2007, “IMPEL Project on review of Compliance promotion, Inspection practices and<br />
En<strong>for</strong>cement <strong>for</strong> IPPC installations,” Final report, November 2007<br />
Intalicementi, 2008, Prezentazione della cementeria dei Sarchi di Calavino, May 2008, http://<br />
www.italcementi.it/NR/rdonlyres/000EED87-6C80-41AB-97E0-1398D3B37953/0/Sarche_<br />
presentazioneaprile2007.pdf<br />
Junker, P. and Lyberg, A., 2006, “Swedish Contribution to European Best Available Techniques<br />
Reference (BREF) <strong>for</strong> the cement industry,” May 30, 2006<br />
Kossina, I., 2001, “Reduction of NOx Emissions from Exhaust Gases of Cement Kilns by Selective<br />
Catalytic Reduction,” Proceedings of NOx Conference, Paris March 2001<br />
Kronvang, B., Andersen, H.E., Børgesen, C., Dalgaard, T., Larsen, S.E., Bøgestrand, J. and Blicher-<br />
Mathiasen, G., 2008, “Effects of policy measures implemented in Denmark on nitrogen pollution<br />
of the aquatic environment,” Environmental Science and Policy, Vol. 11, pp. 144-152<br />
32
Leibacher, U., Bellin, C., Linero, A.A., 2006, “High Dust SCR Solution,” International Cement<br />
Review. No. 12/2006<br />
Linero, A.A., Leibacher, U., Bellin, C., 2007, “High Dust SCR Succeeds at Cementeria di Monselice”.<br />
AWMA Annual Conference, June 2007.<br />
MAFF, 1999, “Making better use of livestock manures on arable land,” Ministry <strong>for</strong> Agriculture<br />
Food and Fisheries, UK<br />
Neuffer, B. and Laney, M., “Alternative Control Techniques Document Update - NOx Emissions<br />
from New Cement Kilns,” 2007, EPA-453/R-07-006, Environmental Protection Agency, pp. 88<br />
Scur, P., Hoppe, H., 2006, “The Present State of NOX Abatement with the SNCR Process,” Cement<br />
International, No. 2/2006<br />
Stuttgart, 2006, “Regierungspräsidium und Firma Schwenk Zement KG vereinbaren Projekt zur<br />
katalytischen Stickstoffoxidminderung - Andriof: Fortschritt für den Umweltschutz in der Zementindustrie,”<br />
Pressmitteilung, 22.11.2007<br />
Yara, 2008, Industrial Solutions to reduce NOx emissions, presentation provided to <strong>EEB</strong> upon<br />
request from Yara representatives<br />
33
A PUSH FOR CLEANER INDUSTRIAL PRODUCTION<br />
Annex 1: Technical Tables<br />
AEAT B ,2007<br />
<br />
<br />
<br />
<br />
<br />
<br />
<br />
<br />
<br />
<br />
<br />
<br />
<br />
<br />
<br />
<br />
<br />
<br />
<br />
34
ENTEC 2008,<br />
Table 4.15<br />
The five highest emitting MS <strong>for</strong> annual emissions of SO 2, NO X and dust, showing average annual<br />
emissions (in kt), the fraction of EU LCP emissions this MS emits and an indicative 2004-2006 trend.<br />
Member<br />
State<br />
Average total<br />
annual (2004-2006)<br />
SO 2 emissions<br />
Member<br />
State<br />
Average total<br />
annual (2004-2006)<br />
NO X emissions<br />
Member<br />
State<br />
Average total<br />
annual (2004-2006)<br />
dust emissions<br />
kt<br />
% of<br />
EU<br />
% change<br />
’04-‘06<br />
kt<br />
% of<br />
EU<br />
% change<br />
’04-‘06<br />
kt<br />
% of<br />
EU<br />
% change<br />
’04-‘06<br />
1. Spain 949 18.5% -13.0% 1. UK 385 17.9% +8.4% 1. Poland 43.4 17.2% -10.4%<br />
2. Bulgaria 776 15.1% -2.5% 2. Spain 287 13.3% fluctuates 2. Greece 39.1 15.5% -43.8%<br />
3. Poland 754 14.7% fluctuates 3. Germany 271 12.6% -5.3% 3. Spain 30.4 12.0% -22.7%<br />
4. Romania 526 10.3% +14.6% 4. Poland 266 12.3% +4.8% 4. Romania 25.8 10.2% fluctuates<br />
5. UK 450 8.8% -28.2% 5. Italy 128 5.9% -3.4%<br />
(Note 1)<br />
5. Bulgaria 22.0 8.7% -3.9%<br />
Table 4.16 The ten LCPs with highest average annual emissions of SO 2.<br />
Number<br />
Member<br />
State<br />
LCP Name<br />
LCP Location<br />
Thermal<br />
capacity<br />
(MWth)<br />
Average annual<br />
SO 2 emissions<br />
2004-2006 (kt)<br />
Remarks<br />
1. Bulgaria TPP “Maritsa Iztok 2” Kovachevo 4,312 310.2<br />
2. Spain CT AS Pontes La Coruña (Galicia) 3800 295.0<br />
3. Bulgaria TPP “Maritsa Iztok 3” Mednikarovo 2,420 183.7<br />
4. Spain CT Teruel I-II-III Andorra-Teruel (Aragon) 3300 156.2<br />
5. Poland BOT Elektrownia<br />
Bełchatów S.A.<br />
Rogowiec, ul. Energetyczna 7,<br />
97-406 Bełchatów<br />
11,892 128.2 Note 1<br />
6. Greece Megalopoli II Megalopoli, Arcadia 839 112.4<br />
7. Poland Elektrownia Ptnów ul. Kazimierska 45, 62-510 Konin 3,624 100.0<br />
8. Bulgaria TPP “Bobov dol” Golemo selo 1,950 84.5 Note 2<br />
9. Bulgaria TPP “Brikel” Galabovo 1,020 77.4 Opted out<br />
10. Romania S.C. Complexul<br />
Energetic Rovinari<br />
S.A. No. 2<br />
Rovinari, str. Energeticianului<br />
nr.25<br />
1,756 71.3 Note 3<br />
Note 1: The 2003 Accession Treaty states that, by way of derogation from Article 4(3) and part A of Annexes III and IV of the<br />
LCPD, the emission limit values <strong>for</strong> SO 2 shall not apply until 31 December 2015 at the latest to El. Bełchatów, while during this<br />
transition period the total SO 2 emissions from all Polish LCPs are subject to an overall ceiling – see section 4.3.3.<br />
Note 2: The 2005 Accession Treaty states that, by way of derogation from Article 4(3) and part A of Annexes III, IV and VII of<br />
the LCPD, the emission limit values <strong>for</strong> SO 2 shall not apply until the date indicated <strong>for</strong> each unit of the plant ‘Bobov dol’: unit 2<br />
(until 31 December 2011); unit 3 (until 31 December 2014). During this transition period the total SO 2 emissions from all<br />
Bulgarian LCPs are subject to an overall ceiling – see section 4.3.3.<br />
35
A PUSH FOR CLEANER INDUSTRIAL PRODUCTION<br />
Table 4.17 The ten LCPs with highest average annual emissions of NO X.<br />
Number<br />
Member<br />
State<br />
LCP Name<br />
LCP Location<br />
Thermal<br />
capacity<br />
(MWth)<br />
Average annual<br />
NO X emissions<br />
2004-2006 (kt)<br />
Remarks<br />
1. United<br />
Kingdom<br />
Drax<br />
Drax Power, Drax P Stn,<br />
Selby<br />
10,800 58.3<br />
2. Poland BOT Elektrownia<br />
Bełchatów S.A.<br />
Rogowiec, ul. Energetyczna<br />
7, 97-406 Bełchatów<br />
11,892 42.0<br />
3. Spain CT Teruel I-II-III Andorra-Teruel (Aragon) 3,300 31.1<br />
4. United<br />
Kingdom<br />
Aberthaw<br />
RWE nPower - Aberthaw P<br />
Stn<br />
4,200 24.5<br />
5. Poland Elektrownia<br />
"Kozienice" S.A.<br />
wiere Górne, gm.<br />
Kozienice, 26-900 Kozienice<br />
6,812 22.3 Note 1<br />
6. United<br />
Kingdom<br />
Cottam EDF Energy, Cottam P Stn 5,500 22.0<br />
7. Spain CT Compostilla II (G<br />
3 and 4)<br />
Leon (Castilla y Leon) 1,675 21.5<br />
8. United<br />
Kingdom<br />
Ratcliffe<br />
E.On UK, Ratcliffe-on-Soar P<br />
Stn, Nottingham<br />
5,500 21.5<br />
9. United<br />
Kingdom<br />
Kingsnorth<br />
E.On UK, Kingsnorth P Stn,<br />
Kent<br />
5,500 21.4 Opted out<br />
10. United<br />
Kingdom<br />
Scottish Power plc Longannet Power Station 6,400 20.4<br />
Note 1: The 2003 Accession Treaty states that, by way of derogation from Article 4(3) and part A of Annex VI of the LCPD, the<br />
emission limit values <strong>for</strong> NO X that would be applicable from 1 January 2016 shall not apply until 31 December 2017 to El.<br />
Kozienice. During this transition period the total NO X emissions from all Polish LCPs are subject to an overall ceiling – see<br />
section 4.3.3.<br />
Figure 4.26 Overview of 2006 LCP per<strong>for</strong>mance vs LCPD ELVs/BAT-AELs <strong>for</strong> SO 2<br />
180<br />
160<br />
140<br />
LCPD<br />
Number of LCPs<br />
120<br />
100<br />
80<br />
60<br />
40<br />
20<br />
0<br />
Biomas<br />
Other Solid<br />
Fuels<br />
50-100MWth<br />
Liquid Fuels Biomass Other Solid<br />
Fuels<br />
100-300MWth<br />
Liquid Fuels Biomass Other Solid<br />
Fuels<br />
300-500MWth<br />
Liquid Fuels Biomass Other Solid<br />
Fuels<br />
>500MWth<br />
Liquid Fuels<br />
36
A PUSH FOR CLEANER INDUSTRIAL PRODUCTION<br />
The European Environmental Bureau (<strong>EEB</strong>) is a federation of<br />
over 150 environmental citizens’ organisations based in most EU<br />
Member States, most candidate and potential candidate countries as<br />
well as in a few neighbouring countries. These organisations range<br />
from local and national, to European and international.<br />
<strong>EEB</strong>’s aim is to protect and improve the environment by influencing<br />
EU policy, promoting sustainable development objectives and<br />
ensuring that Europe’s citizens can play a part in achieving these<br />
goals. <strong>EEB</strong> stands <strong>for</strong> environmental justice and participatory<br />
democracy. Our office in Brussels was established in 1974 to provide<br />
a focal point <strong>for</strong> our members to monitor and respond to the EU’s<br />
emerging environmental policy. In 2004, <strong>EEB</strong>, working with the<br />
Mercury Policy Project/Ban Mercury Working Group, launched the<br />
‘Zero Mercury’ campaign.<br />
European Environmental Bureau (<strong>EEB</strong>)<br />
Boulevard de Waterloo 34 | B-1000 Brussels | Belgium<br />
Tel.: +32 2 289 1090 | Fax: +32 2 289 1099<br />
E-mail: eeb@eeb.org<br />
Websites: www.eeb.org, www.chemicalreaction.org, www.newngo<strong>for</strong>um.org,<br />
www.participate.org, www.zeromercury.org<br />
AN INTERNATIONAL NON-PROFIT ASSOCIATION | ASSOCIATION INTERNATIONALE SANS BUT LUCRATIF