A push for cleaner industrial production - EEB
A push for cleaner industrial production - EEB
A push for cleaner industrial production - EEB

Create successful ePaper yourself
Turn your PDF publications into a flip-book with our unique Google optimized e-Paper software.
A PUSH FOR CLEANER INDUSTRIAL PRODUCTION<br />
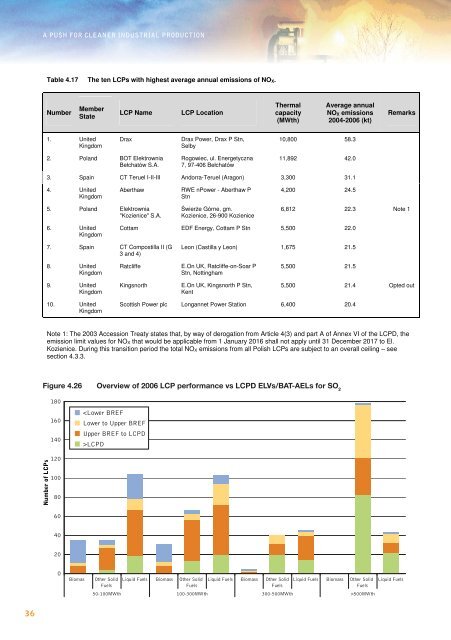
Table 4.17 The ten LCPs with highest average annual emissions of NO X.<br />
Number<br />
Member<br />
State<br />
LCP Name<br />
LCP Location<br />
Thermal<br />
capacity<br />
(MWth)<br />
Average annual<br />
NO X emissions<br />
2004-2006 (kt)<br />
Remarks<br />
1. United<br />
Kingdom<br />
Drax<br />
Drax Power, Drax P Stn,<br />
Selby<br />
10,800 58.3<br />
2. Poland BOT Elektrownia<br />
Bełchatów S.A.<br />
Rogowiec, ul. Energetyczna<br />
7, 97-406 Bełchatów<br />
11,892 42.0<br />
3. Spain CT Teruel I-II-III Andorra-Teruel (Aragon) 3,300 31.1<br />
4. United<br />
Kingdom<br />
Aberthaw<br />
RWE nPower - Aberthaw P<br />
Stn<br />
4,200 24.5<br />
5. Poland Elektrownia<br />
"Kozienice" S.A.<br />
wiere Górne, gm.<br />
Kozienice, 26-900 Kozienice<br />
6,812 22.3 Note 1<br />
6. United<br />
Kingdom<br />
Cottam EDF Energy, Cottam P Stn 5,500 22.0<br />
7. Spain CT Compostilla II (G<br />
3 and 4)<br />
Leon (Castilla y Leon) 1,675 21.5<br />
8. United<br />
Kingdom<br />
Ratcliffe<br />
E.On UK, Ratcliffe-on-Soar P<br />
Stn, Nottingham<br />
5,500 21.5<br />
9. United<br />
Kingdom<br />
Kingsnorth<br />
E.On UK, Kingsnorth P Stn,<br />
Kent<br />
5,500 21.4 Opted out<br />
10. United<br />
Kingdom<br />
Scottish Power plc Longannet Power Station 6,400 20.4<br />
Note 1: The 2003 Accession Treaty states that, by way of derogation from Article 4(3) and part A of Annex VI of the LCPD, the<br />
emission limit values <strong>for</strong> NO X that would be applicable from 1 January 2016 shall not apply until 31 December 2017 to El.<br />
Kozienice. During this transition period the total NO X emissions from all Polish LCPs are subject to an overall ceiling – see<br />
section 4.3.3.<br />
Figure 4.26 Overview of 2006 LCP per<strong>for</strong>mance vs LCPD ELVs/BAT-AELs <strong>for</strong> SO 2<br />
180<br />
160<br />
140<br />
LCPD<br />
Number of LCPs<br />
120<br />
100<br />
80<br />
60<br />
40<br />
20<br />
0<br />
Biomas<br />
Other Solid<br />
Fuels<br />
50-100MWth<br />
Liquid Fuels Biomass Other Solid<br />
Fuels<br />
100-300MWth<br />
Liquid Fuels Biomass Other Solid<br />
Fuels<br />
300-500MWth<br />
Liquid Fuels Biomass Other Solid<br />
Fuels<br />
>500MWth<br />
Liquid Fuels<br />
36