A push for cleaner industrial production - EEB
A push for cleaner industrial production - EEB
A push for cleaner industrial production - EEB

You also want an ePaper? Increase the reach of your titles
YUMPU automatically turns print PDFs into web optimized ePapers that Google loves.
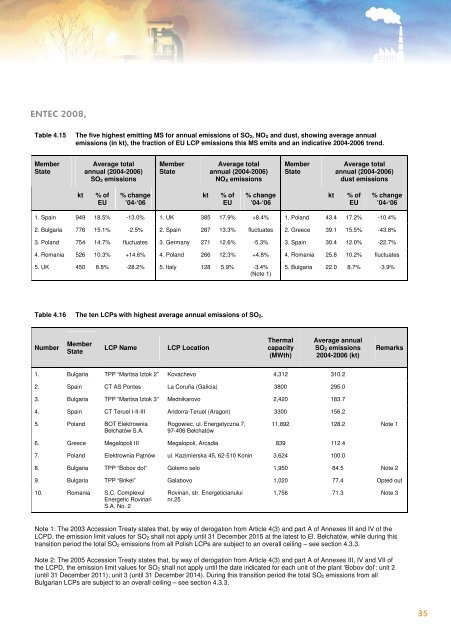
ENTEC 2008,<br />
Table 4.15<br />
The five highest emitting MS <strong>for</strong> annual emissions of SO 2, NO X and dust, showing average annual<br />
emissions (in kt), the fraction of EU LCP emissions this MS emits and an indicative 2004-2006 trend.<br />
Member<br />
State<br />
Average total<br />
annual (2004-2006)<br />
SO 2 emissions<br />
Member<br />
State<br />
Average total<br />
annual (2004-2006)<br />
NO X emissions<br />
Member<br />
State<br />
Average total<br />
annual (2004-2006)<br />
dust emissions<br />
kt<br />
% of<br />
EU<br />
% change<br />
’04-‘06<br />
kt<br />
% of<br />
EU<br />
% change<br />
’04-‘06<br />
kt<br />
% of<br />
EU<br />
% change<br />
’04-‘06<br />
1. Spain 949 18.5% -13.0% 1. UK 385 17.9% +8.4% 1. Poland 43.4 17.2% -10.4%<br />
2. Bulgaria 776 15.1% -2.5% 2. Spain 287 13.3% fluctuates 2. Greece 39.1 15.5% -43.8%<br />
3. Poland 754 14.7% fluctuates 3. Germany 271 12.6% -5.3% 3. Spain 30.4 12.0% -22.7%<br />
4. Romania 526 10.3% +14.6% 4. Poland 266 12.3% +4.8% 4. Romania 25.8 10.2% fluctuates<br />
5. UK 450 8.8% -28.2% 5. Italy 128 5.9% -3.4%<br />
(Note 1)<br />
5. Bulgaria 22.0 8.7% -3.9%<br />
Table 4.16 The ten LCPs with highest average annual emissions of SO 2.<br />
Number<br />
Member<br />
State<br />
LCP Name<br />
LCP Location<br />
Thermal<br />
capacity<br />
(MWth)<br />
Average annual<br />
SO 2 emissions<br />
2004-2006 (kt)<br />
Remarks<br />
1. Bulgaria TPP “Maritsa Iztok 2” Kovachevo 4,312 310.2<br />
2. Spain CT AS Pontes La Coruña (Galicia) 3800 295.0<br />
3. Bulgaria TPP “Maritsa Iztok 3” Mednikarovo 2,420 183.7<br />
4. Spain CT Teruel I-II-III Andorra-Teruel (Aragon) 3300 156.2<br />
5. Poland BOT Elektrownia<br />
Bełchatów S.A.<br />
Rogowiec, ul. Energetyczna 7,<br />
97-406 Bełchatów<br />
11,892 128.2 Note 1<br />
6. Greece Megalopoli II Megalopoli, Arcadia 839 112.4<br />
7. Poland Elektrownia Ptnów ul. Kazimierska 45, 62-510 Konin 3,624 100.0<br />
8. Bulgaria TPP “Bobov dol” Golemo selo 1,950 84.5 Note 2<br />
9. Bulgaria TPP “Brikel” Galabovo 1,020 77.4 Opted out<br />
10. Romania S.C. Complexul<br />
Energetic Rovinari<br />
S.A. No. 2<br />
Rovinari, str. Energeticianului<br />
nr.25<br />
1,756 71.3 Note 3<br />
Note 1: The 2003 Accession Treaty states that, by way of derogation from Article 4(3) and part A of Annexes III and IV of the<br />
LCPD, the emission limit values <strong>for</strong> SO 2 shall not apply until 31 December 2015 at the latest to El. Bełchatów, while during this<br />
transition period the total SO 2 emissions from all Polish LCPs are subject to an overall ceiling – see section 4.3.3.<br />
Note 2: The 2005 Accession Treaty states that, by way of derogation from Article 4(3) and part A of Annexes III, IV and VII of<br />
the LCPD, the emission limit values <strong>for</strong> SO 2 shall not apply until the date indicated <strong>for</strong> each unit of the plant ‘Bobov dol’: unit 2<br />
(until 31 December 2011); unit 3 (until 31 December 2014). During this transition period the total SO 2 emissions from all<br />
Bulgarian LCPs are subject to an overall ceiling – see section 4.3.3.<br />
35